
Synthetic monitoring is one of the Splunk features you can use to continuously measure your website performance. This guide explains how to set up synthetic browser tests, view performance reports, and configure alerts.
What is Splunk Synthetic Monitoring?
Synthetic website monitoring is one of the features of the Splunk Observability Cloud platform. It lets you run scheduled tests in a controlled test environment to keep track of uptime and page speed.
Synthetic testing is one of the features of Splunk's digital experience monitoring capabilities that provide insight into user experience on your website. It complements real user monitoring by providing consistent data from a controlled environment.
Create a new synthetic monitor
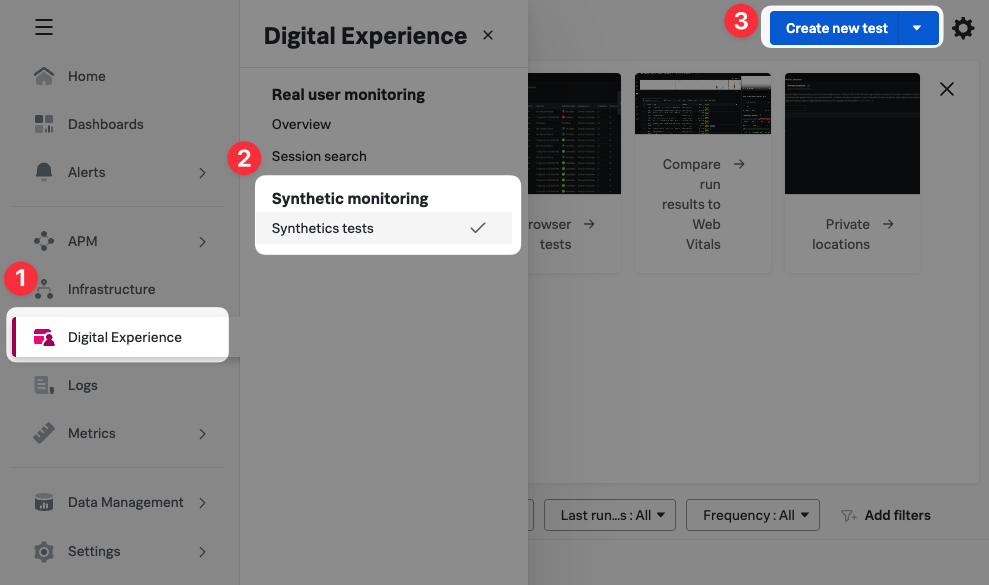
To start creating a new synthetic monitor, open "Digital Experience", select "Synthetic Tests", and finally click "Create new test".
Splunk supports several different types of synthetic tests:
- Browser test: open a website and optionally navigate through it
- SSL test: check SSL certificate validity
- API test: check performance and validity of API endpoints
- HTTP test: check web server availability and response time
- Port test: confirm a specific server port is accessible
We'll go with the browser test to get as much insight into visitor experience as possible.

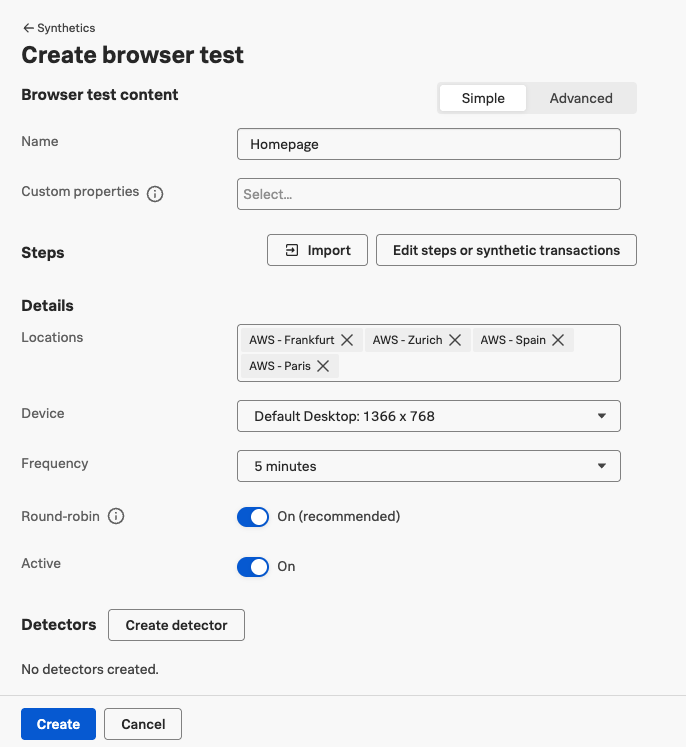
To set up a synthetic check we need to do at least two things: provide a name and configure transaction steps.
We can also configure additional options on how the test should run:
- What test locations should be used to load the website?
- What should the size of the test device be?
- How often should the test run?
You can also set up advanced options like custom headers, cookies, or Chrome flags.
Splunk does not provide a way to throttle the network speed for synthetic tests. If you want to measure performance on a slower network consider using DebugBear instead.
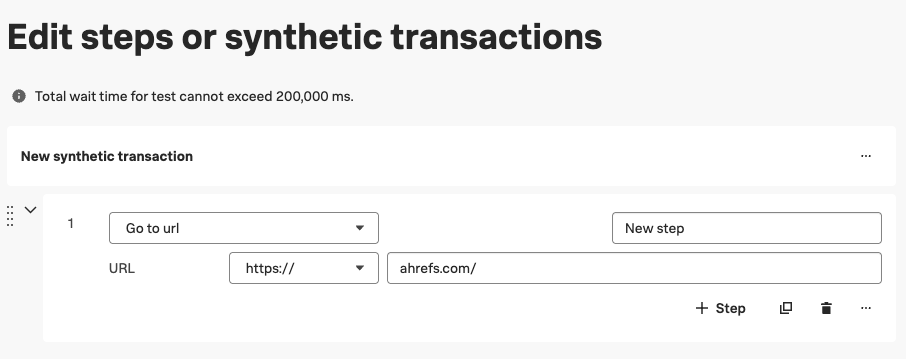
Click on "Edit steps or synthetic transactions" to specify the page URL you want to test.
Splunk supports synthetic transaction monitoring where you can define multiple steps to load your website and interact with it. However, for now we'll just go with a simple URL test.
Click on "Return to test" once you've set up the transaction steps. Then click "Create" to finish the setup process.
View performance data over time
Once the test has run you'll start seeing web performance metrics and historical availability data in your dashboard.
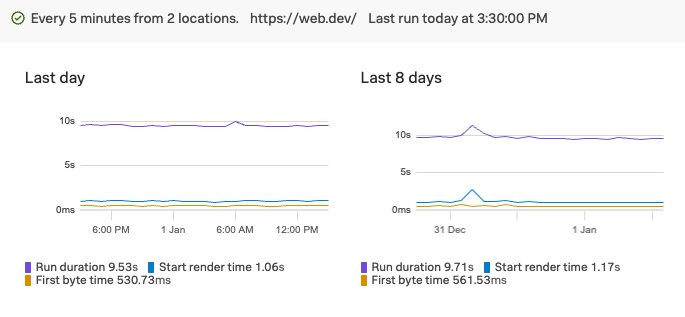
In addition to tracking the technical metrics and the total run time of the test you can also measure Google Core Web Vitals like Largest Contentful Paint and Cumulative Layout Shift.
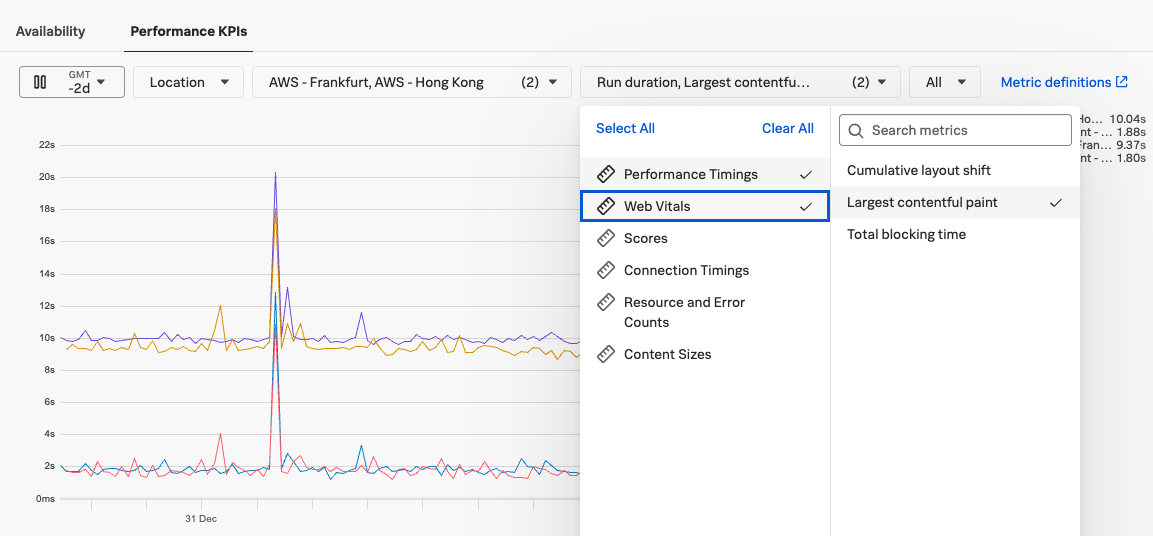
To track Interaction to Next Paint you need to set up real user monitoring. However, Total Blocking Time is available in synthetic tests and can provide partial insights into input delays.
Review specific test runs
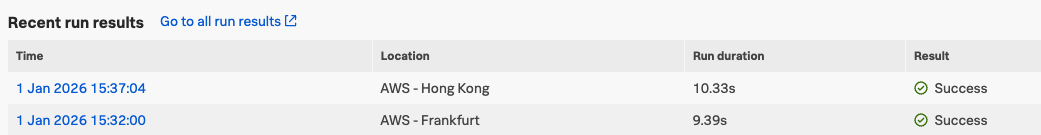
The "Recent test runs" table shows you when individual tests were run in each location. Click on a specific test run to view detailed performance data.
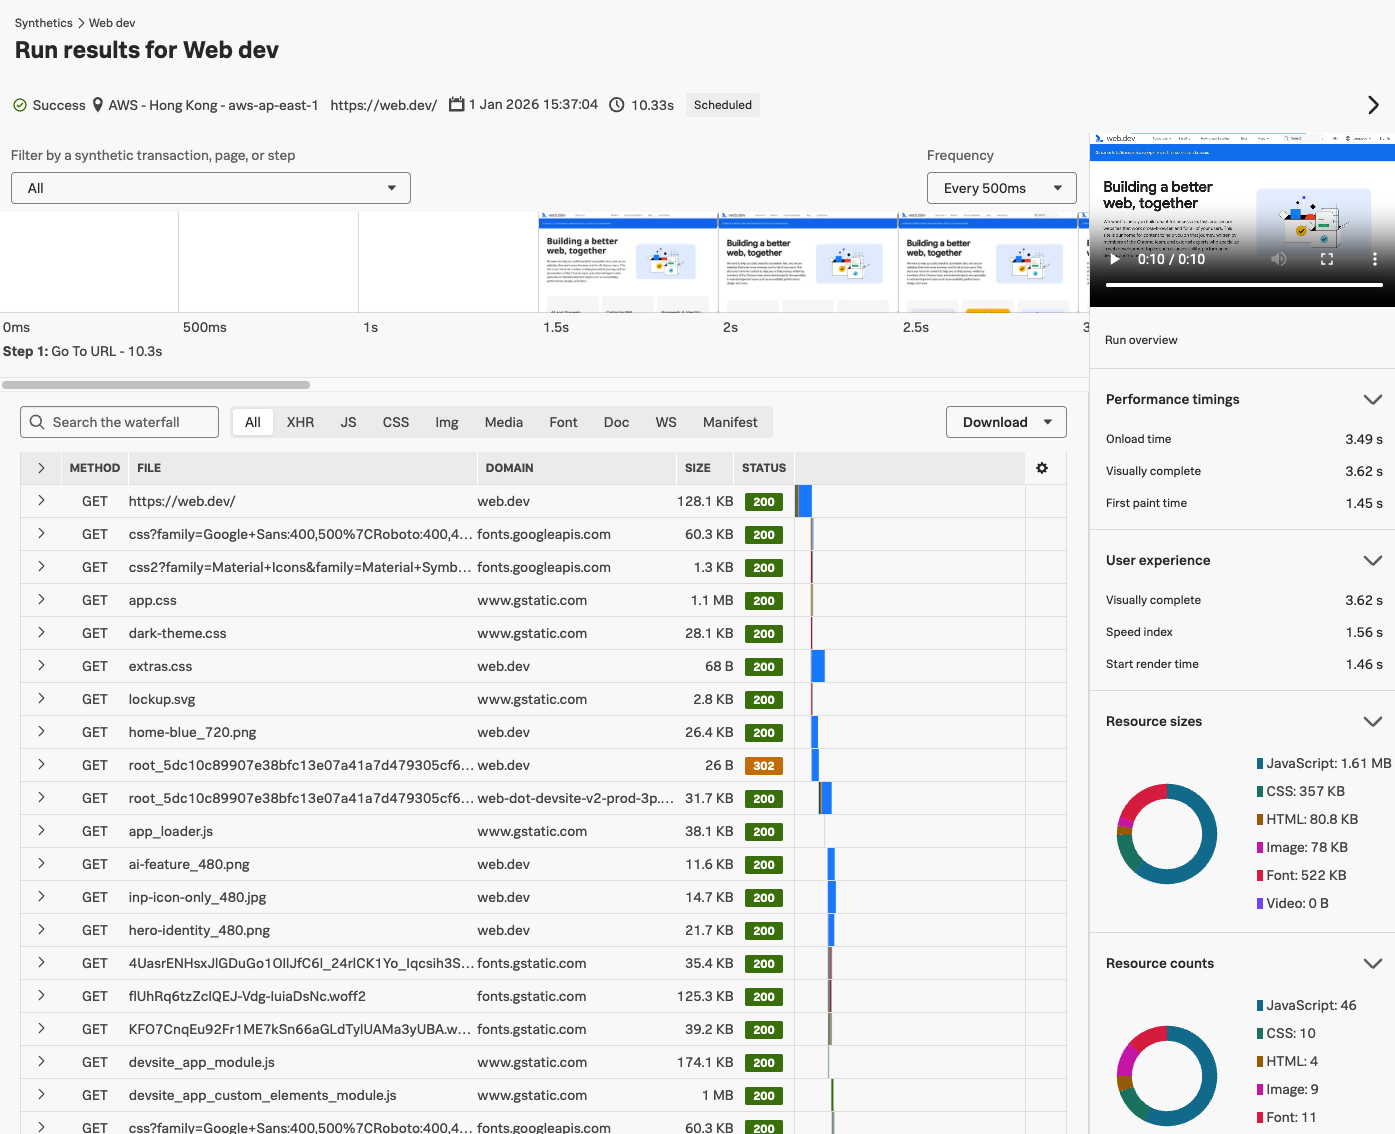
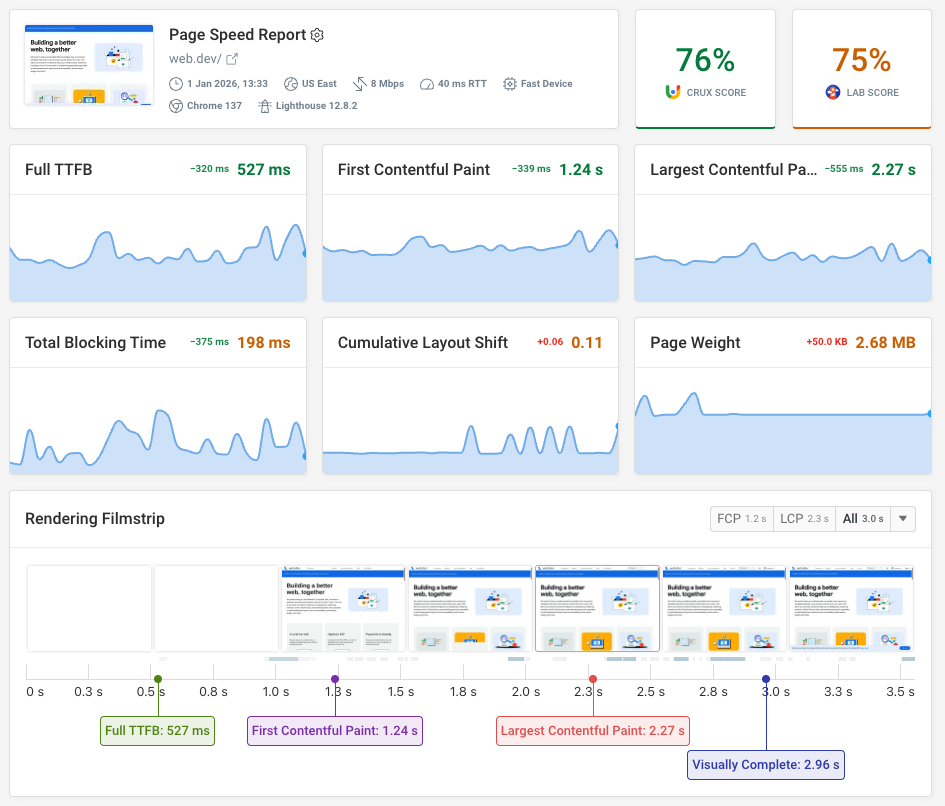
The detailed test result includes a rendering filmstrip and video view that shows you how content on the page loaded gradually. Splunk also provides a breakdown of key performance metrics and a page weight breakdown by resource type.
The request waterfall view shows you all resources that were loaded on the page and how long they took to load. You can inspect each request in more detail to view request and response headers as well as the HTTP status code and transfer protocol (e.g. HTTP/2).
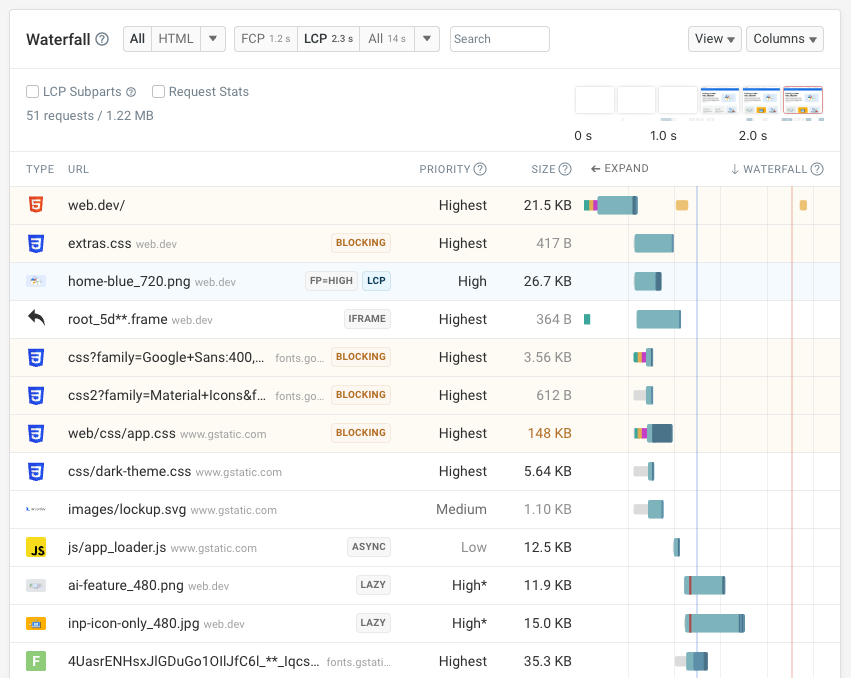
The DebugBear website speed test provides a more detailed breakdown of resources loaded on your website and how they impact page speed.
On top of that, the network is throttled using reliable packet-level throttling to better reflect real user conditions.
Set up alerting with detectors
Splunk detectors allow you to get alerted to performance issues and outages on your website. You define custom thresholds that determine when an alert is triggered.
To set up a detector, go to the list of synthetic monitors you've set up, click on the three dots on the right of the table, and select "Create Detector".
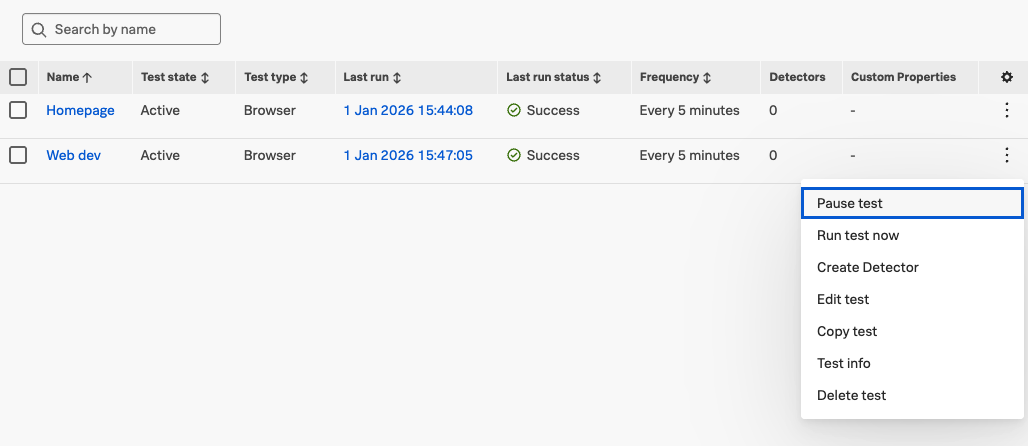
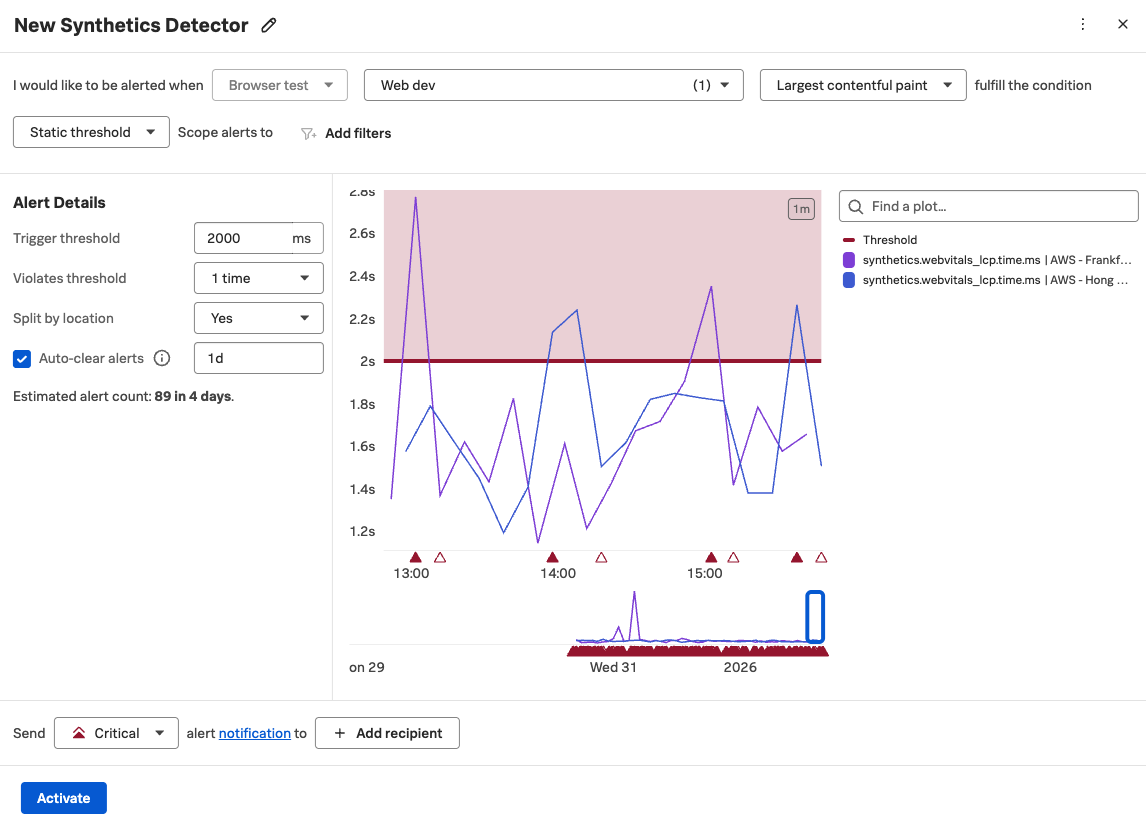
The detector then lets you define what should trigger an alert and how you want to be notified.
- What metric do you want to check?
- What threshold should trigger the alert?
- Are alerts triggered right away or only on multiple consecutive failures?
- What channels should notifications be sent to?
Click "Activate" after configuring the detector to start receiving alerts for issues on your website.
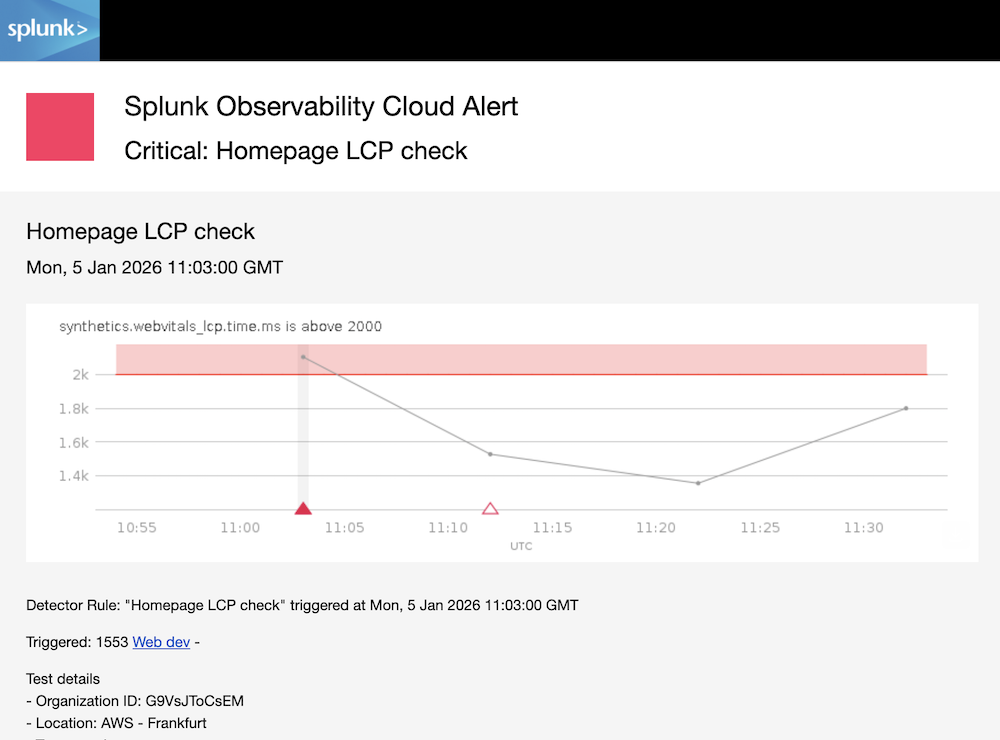
You will then receive notifications when the detector threshold is breached and when the metric goes back to normal.
The alert message also shows you the recent metric values and how long the threshold has been breached.
Try a dedicated web performance monitoring solution
Splunk is a general-purpose observability platform that includes synthetic monitoring as one of its features. If you're looking for a tool that's focused on website performance monitoring consider using DebugBear for more detailed insights and performance recommendations.
Our synthetic monitoring product provides both a high-level view of user experience as well as deep technical reports.
Each test result includes a full Lighthouse report, as well as custom performance recommendations to help you optimize your website performance. You can use experiments to track how specific changes would impact page speed, without having to deploy any code changes on your live site.
Want to learn more about how to use this in practice? We recently published a real-world performance review of the Splunk homepage, highlighting specific optimizations that could be made.


Monitor Page Speed & Core Web Vitals
DebugBear monitoring includes:
- In-depth Page Speed Reports
- Automated Recommendations
- Real User Analytics Data