
Dynatrace is a comprehensive observability platform that includes synthetic monitoring capabilities. This guide explains how to set up and use Dynatrace synthetic monitoring to track your website performance and availability.
What are synthetic monitors on Dynatrace?
Synthetic website monitoring means running scheduled tests in a controlled test environment. You can specify what page to test, what device to test on, or how fast the network should be.
Your monitoring data will then show how your website performance changes over time, check your website is loading correctly, and make sure you get alerted when there's a problem.
Dynatrace supports different types of synthetic monitors:
- Browser: Monitor the full page load of a website, or track user flow performance
- HTTP: Check specific URLs or API endpoints
- Network availability: Check ICMP, TCP, or DNS endpoints
Synthetic monitoring forms part of a more comprehensive digital experience monitoring strategy.
Try DebugBear if you're looking for a synthetic monitoring tool that's more focused on end user experience.
How to set up a synthetic monitor on Dynatrace
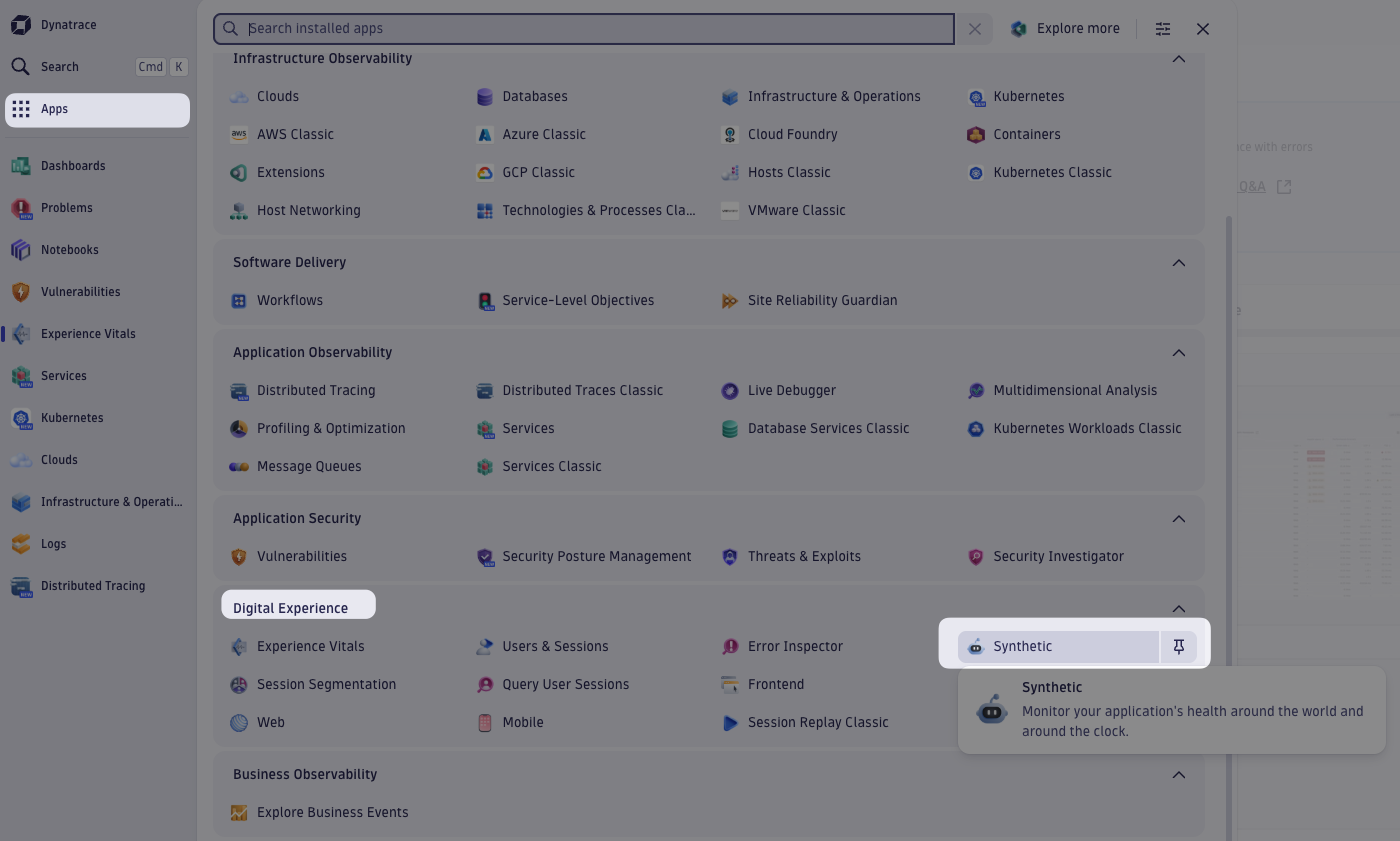
To start setting up a synthetic monitor, first select Apps, look for the Digital Experience section, and then click on Synthetic.
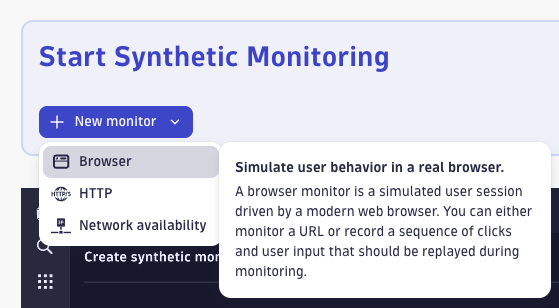
Next you need to select the type of monitor.
We'll pick a Browser monitor that will open the whole web page in the browser and provide insights on how the website is loading and if there were any errors.
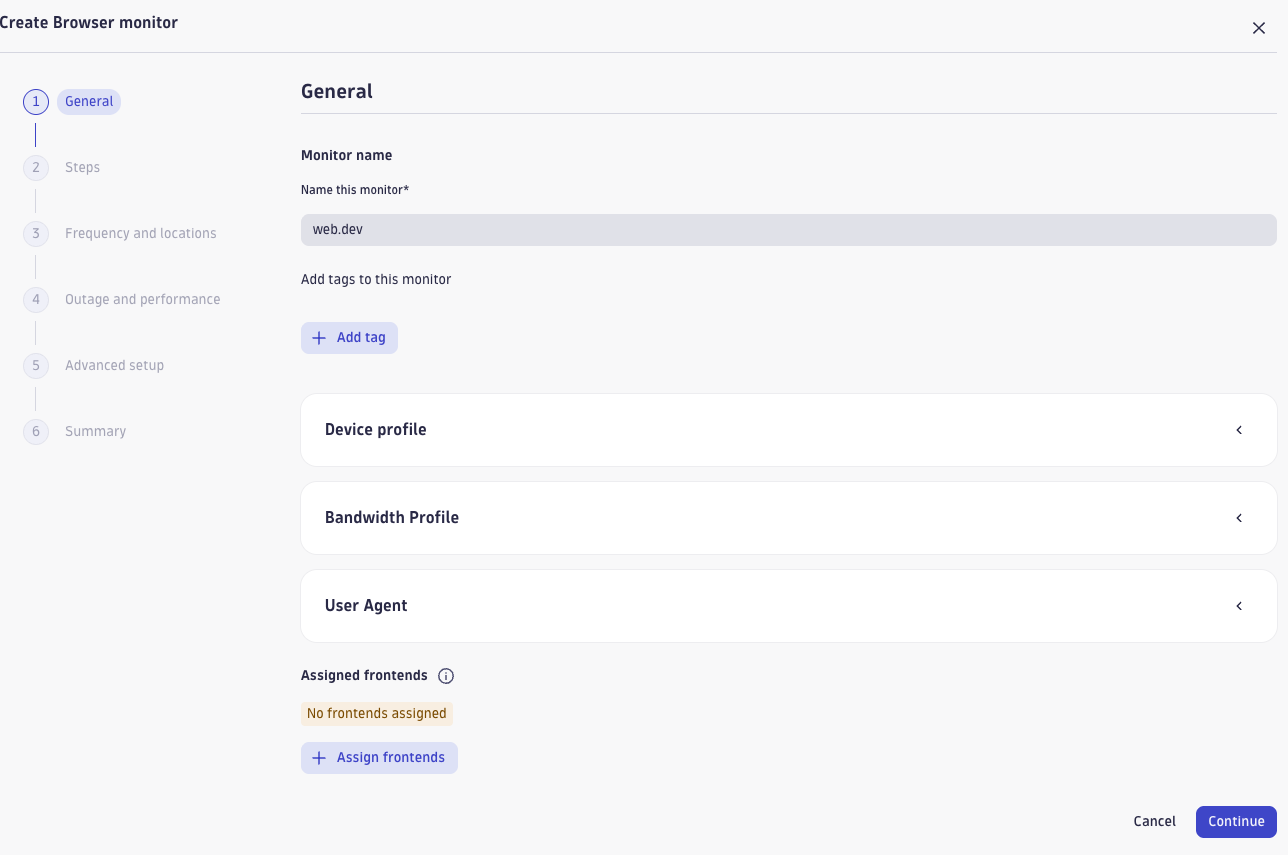
Now we've arrived at the first of 6 setup steps. Here we assign a name for the monitor and specify the device profile, bandwidth profile, and user agent.
Under the device profile we can select a predefined device size, for example an iPad Air. We can also manually specify the screen height and width.
We can also throttle the network and specify a specific download and upload speed. The network latency option introduces additional round trip time between the client and the server.
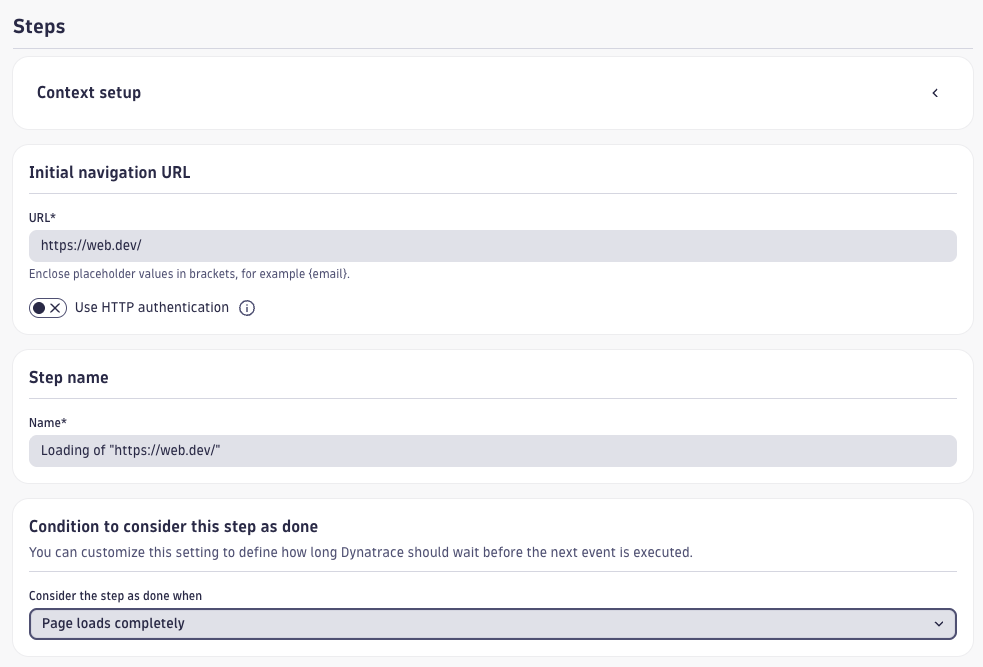
Next you need to set up the monitor steps. That can be either a visit to a single URL or a more complex synthetic transaction flow.
For now we'll just go with a simple URL test.
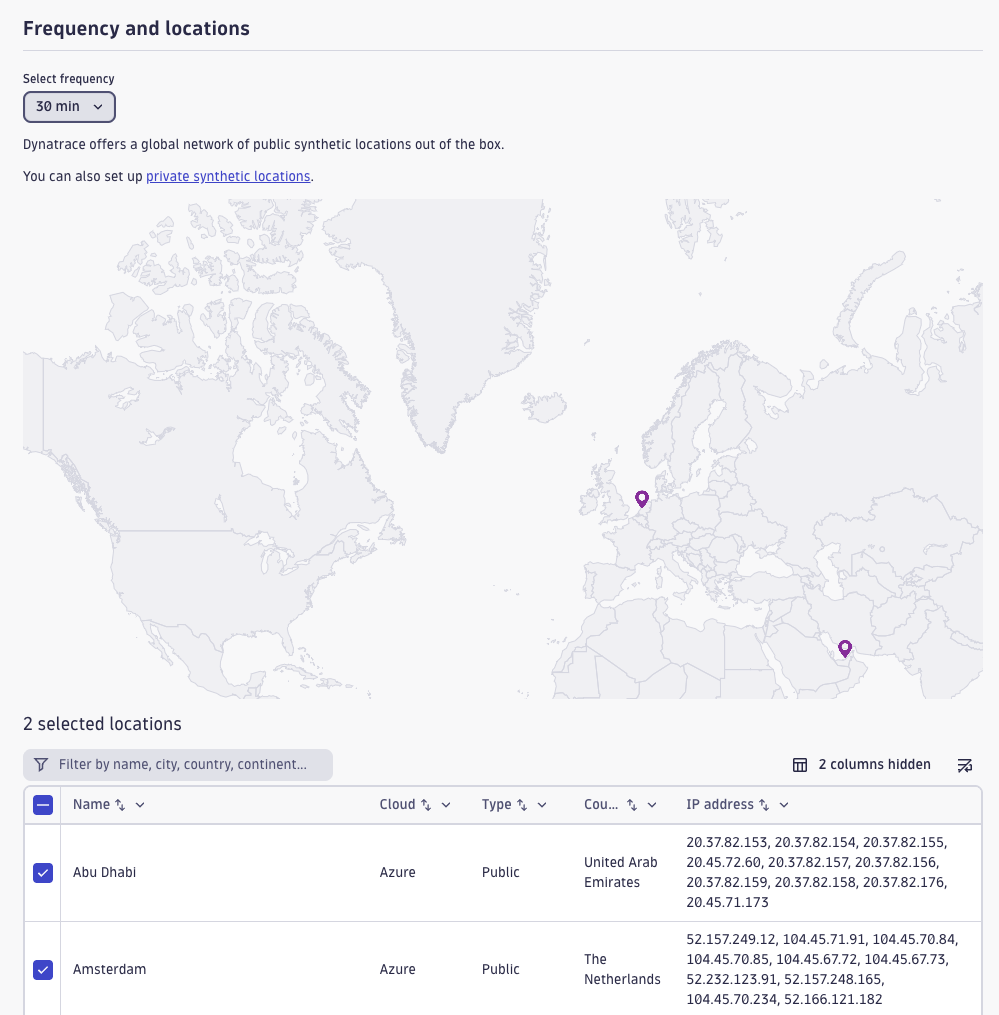
You can specify a test frequency between every 5 minutes and every 4 hours. Alternatively, you can configure the monitor to only run tests on demand.
Dynatrace lets you run synthetic tests from a large number of different test locations. Where a test is run from will impact page load speed and can also impact uptime and errors if page content depends on the visitor location.
You may need to set up your network so that Dynatrace synthetic checks are not blocked accidentally. When selecting a monitoring location Dynatrace provides a list of IP addresses that requests are made from.
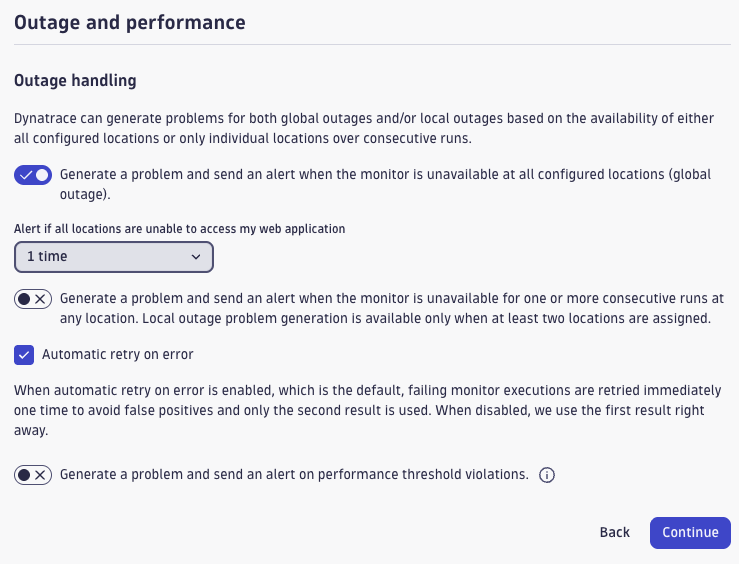
When an outage is detected, Dynatrace can trigger an alert to ensure you're notified.
To avoid unnecessary alert noise you can configure this to only trigger when the test fails several times consecutively.
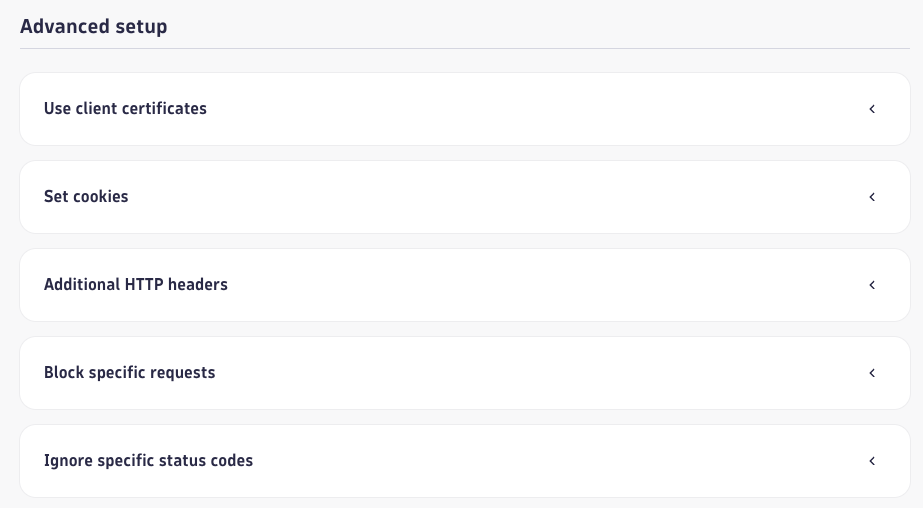
The advanced setup options let you set cookies, block specific requests, or run JavaScript on the page.
You can also pass in additional HTTP headers or make requests through a proxy.
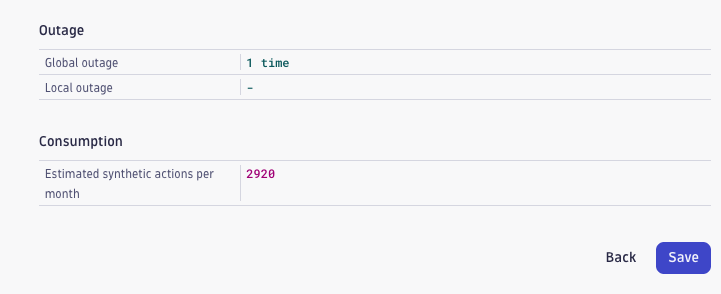
Finally, the Summary step provides an overview of the options you've selected.
Click "Save" to complete the monitoring setup.
Viewing synthetic test result data
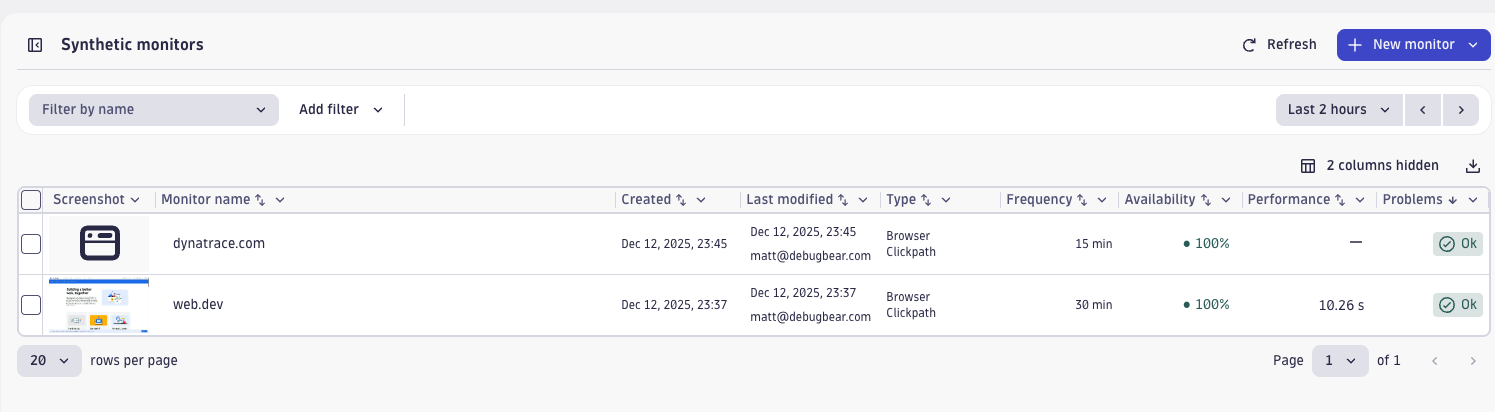
Once the monitor is set up you'll quickly start to see data coming in.
Dynatrace shows you whether the monitor ran successfully and how long the test took to run.
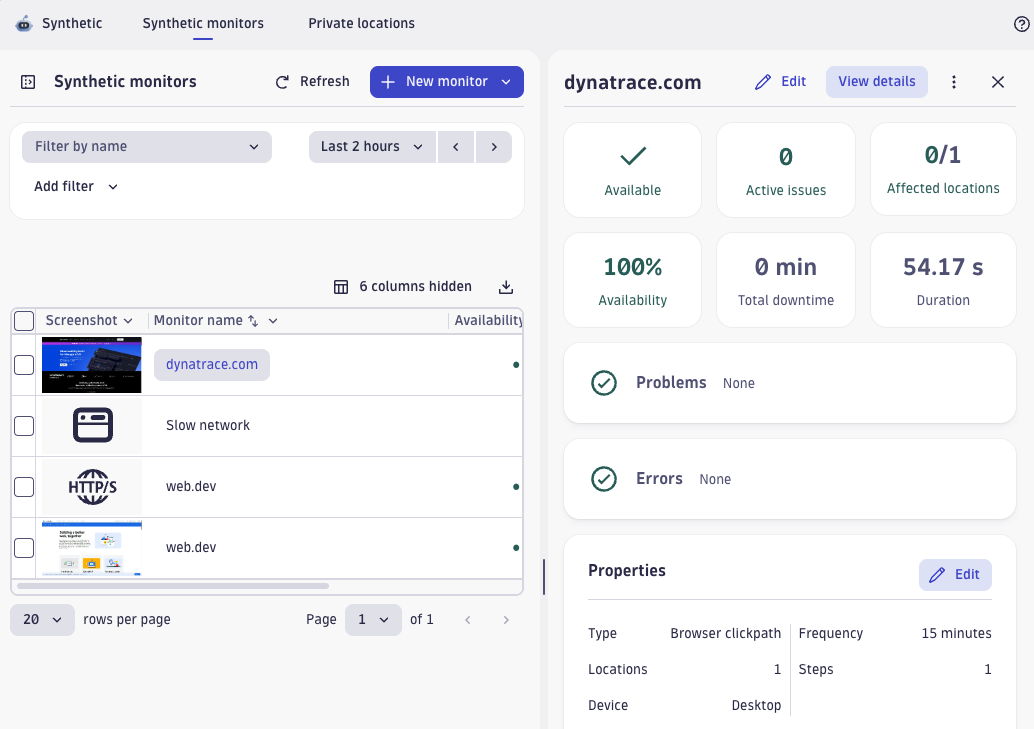
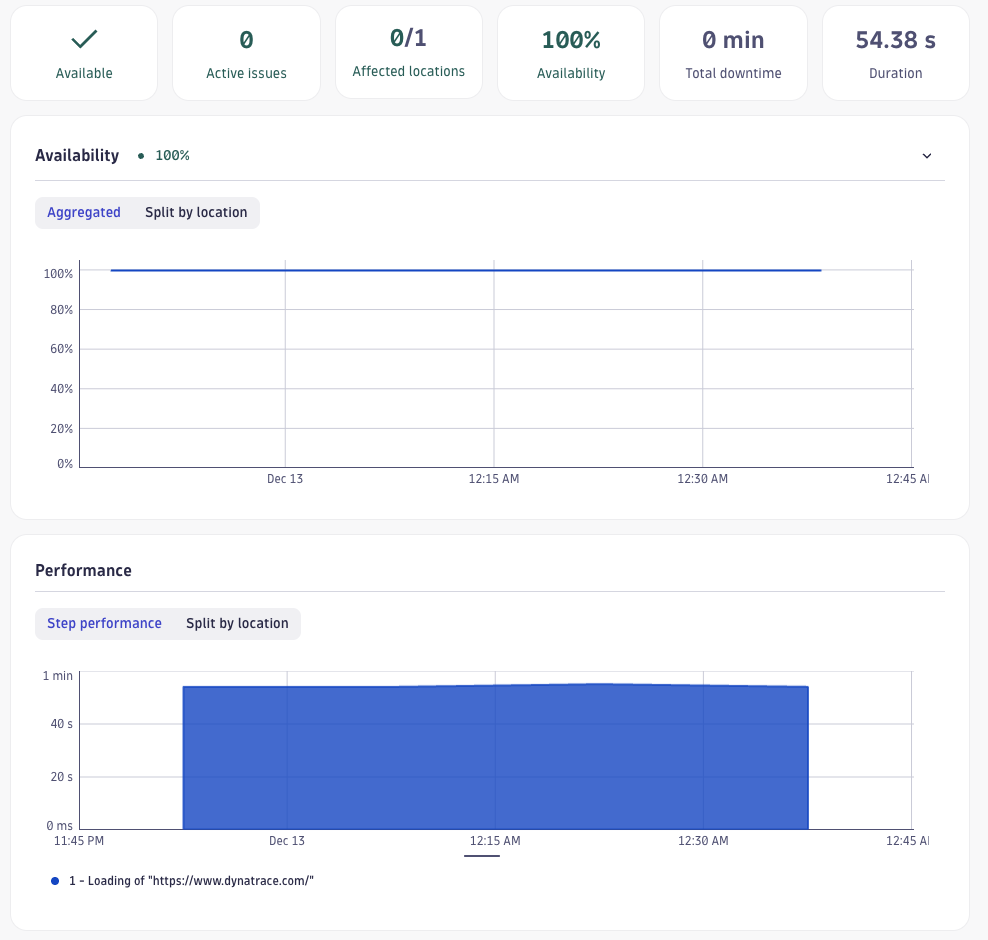
Click on "View details" to see availability and performance tracked over time.
You can see whether the test duration changed over time, how much downtime your website had, and whether outages impacted all test locations.
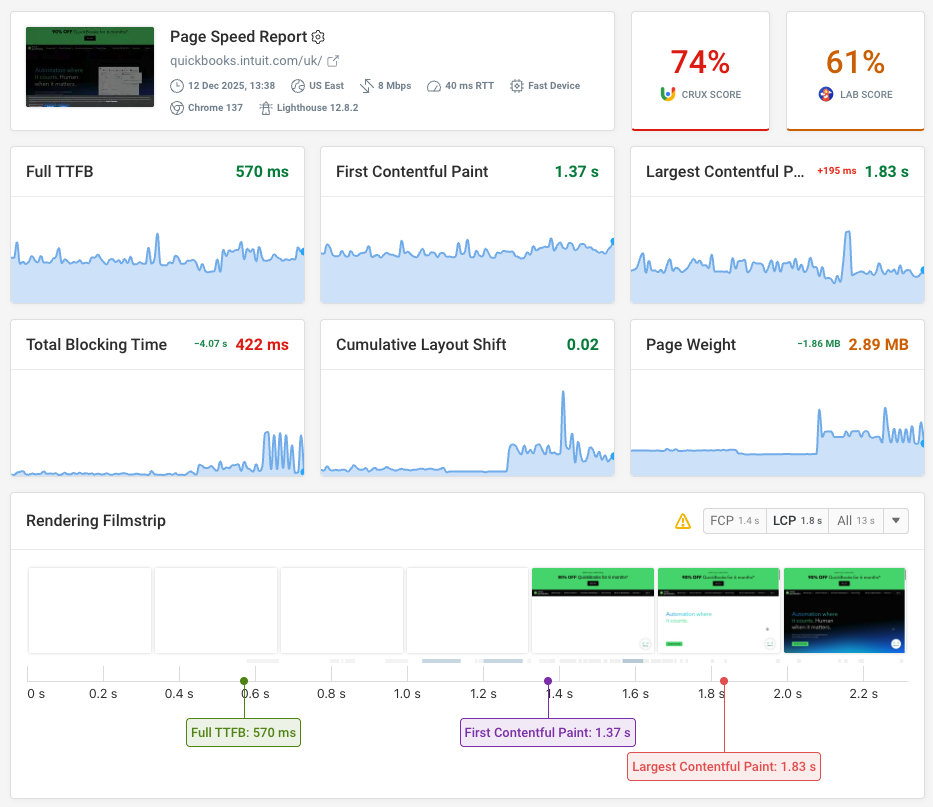
DebugBear synthetic monitoring can quickly surface key metrics that impact visitor experience.
Analyze executions
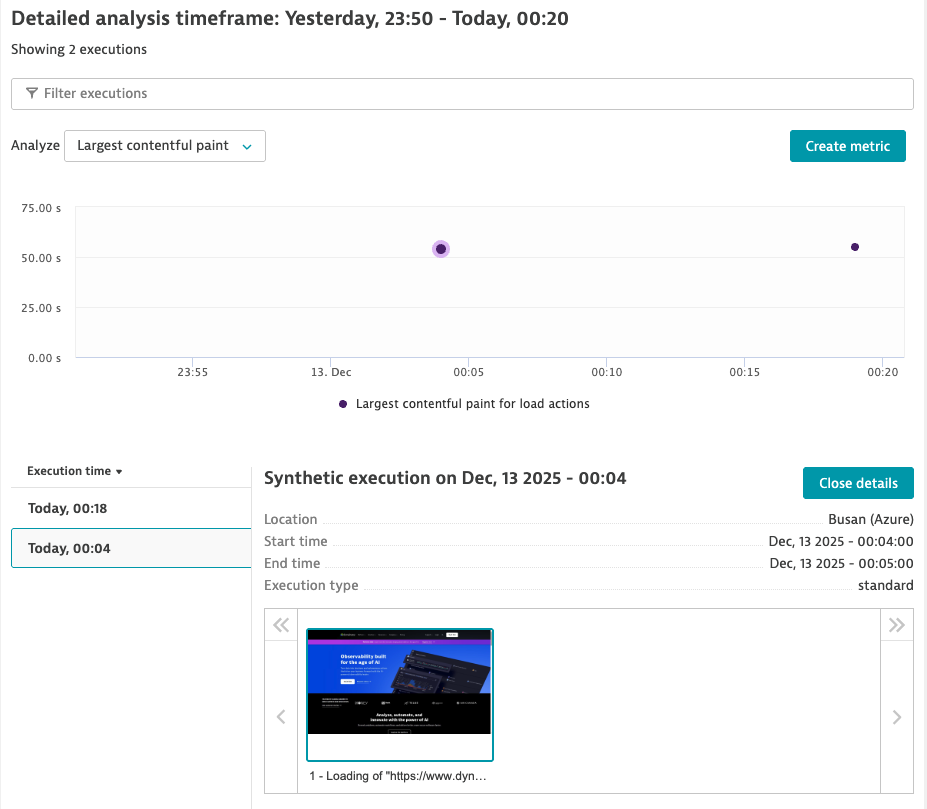
To get more details on each test result, click on "Analyze executions".
You can see the execution time of each monitor, as well as important metrics like the Largest Contentful Paint.
The detailed breakdown view includes a request waterfall view that shows all the resources that are loaded on the page.
Hover over each request to see how much time was spent on establishing a server connection or on downloading the response data.
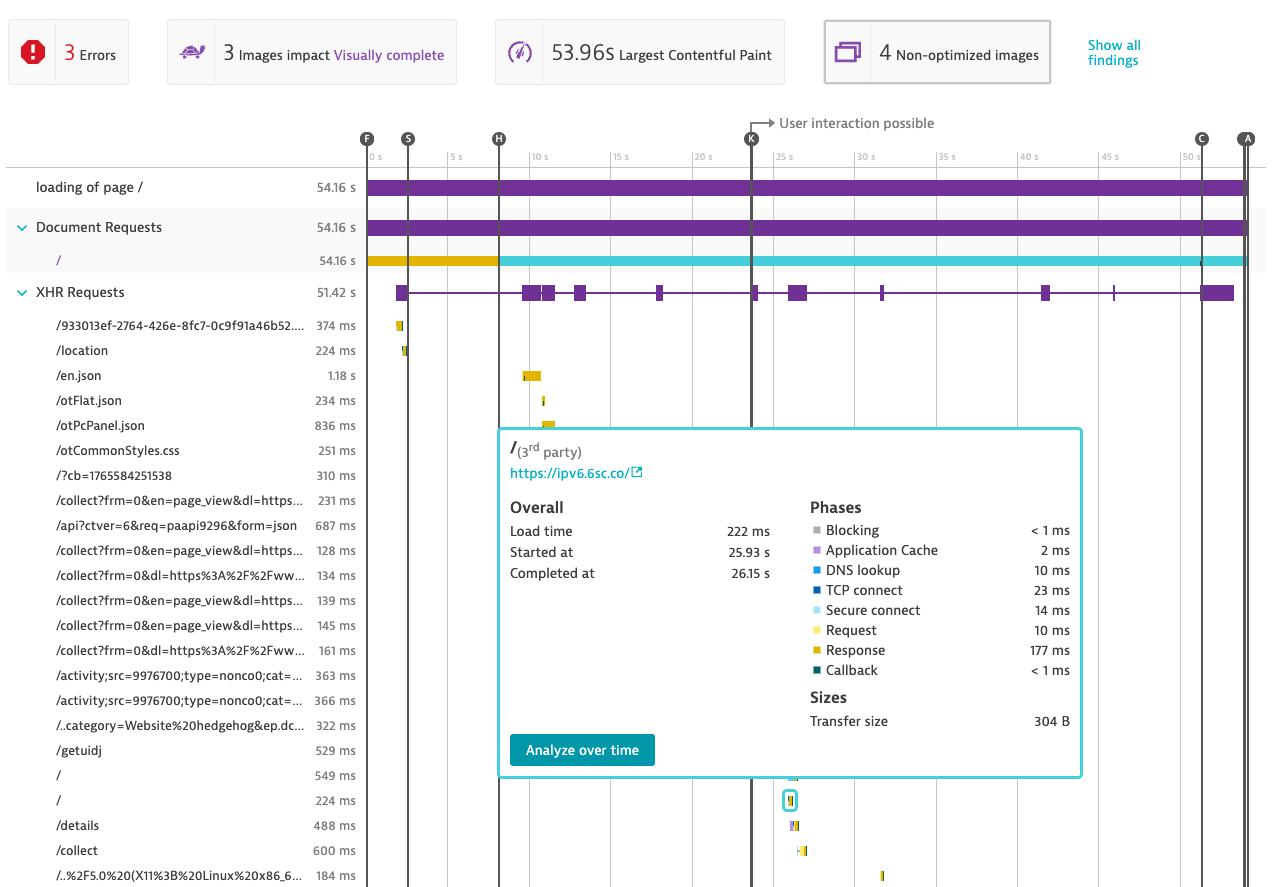
Dynatrace also identifies specific performance issues like non-optimized images or uncompressed text files. Click on "Show all findings" to see all recommendations.
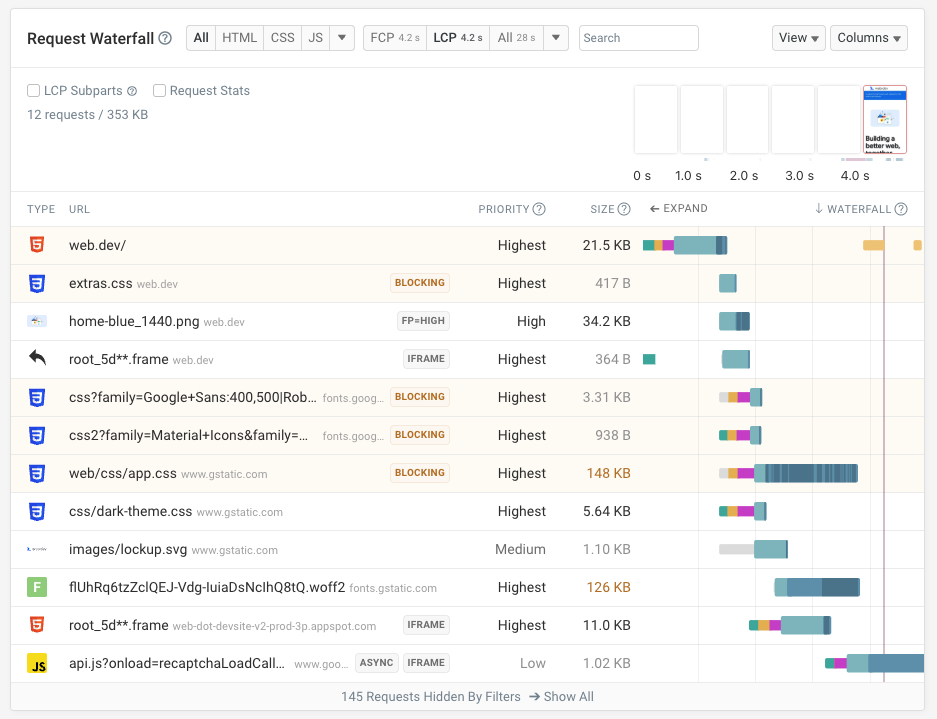
The DebugBear request waterfall is built to make it as easy as possible to identify page speed optimizations.
You can use our free website speed test to try it out!
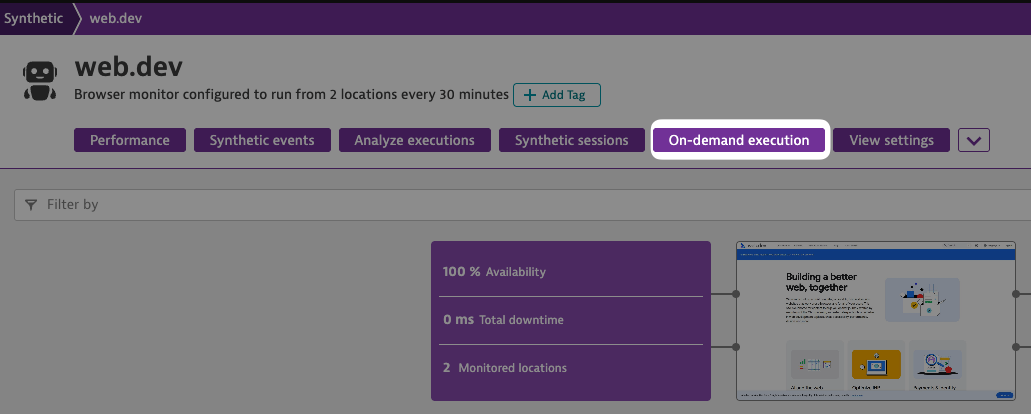
Trigger tests on-demand
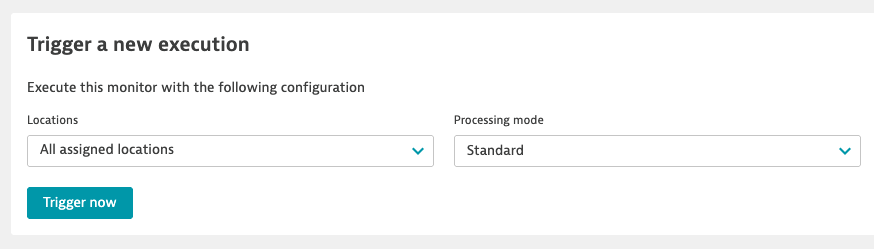
Dynatrace lets you trigger additional on-demand tests for each monitor. Click on "On-demand execution".
You can then configure whether tests will be run in all locations or just in one specific place.
Click on "Trigger now" to start the test.
What are synthetic actions on Dynatrace?
Each browser test counts as one synthetic action that you are billed for.
If you run tests every hour that means you'll use 24 actions per day or roughly 2,900 per month.
Dynatrace pricing for synthetic testing
Dynatrace charges $4.50 per 1,000 synthetic tests. A single hourly monitor will cost roughly $13 per month.
Purpose-built synthetic web performance monitoring
If your focus is on web performance, try out DebugBear monitoring to make optimizing your page load time easier and to get the data you need to identify and fix regressions.
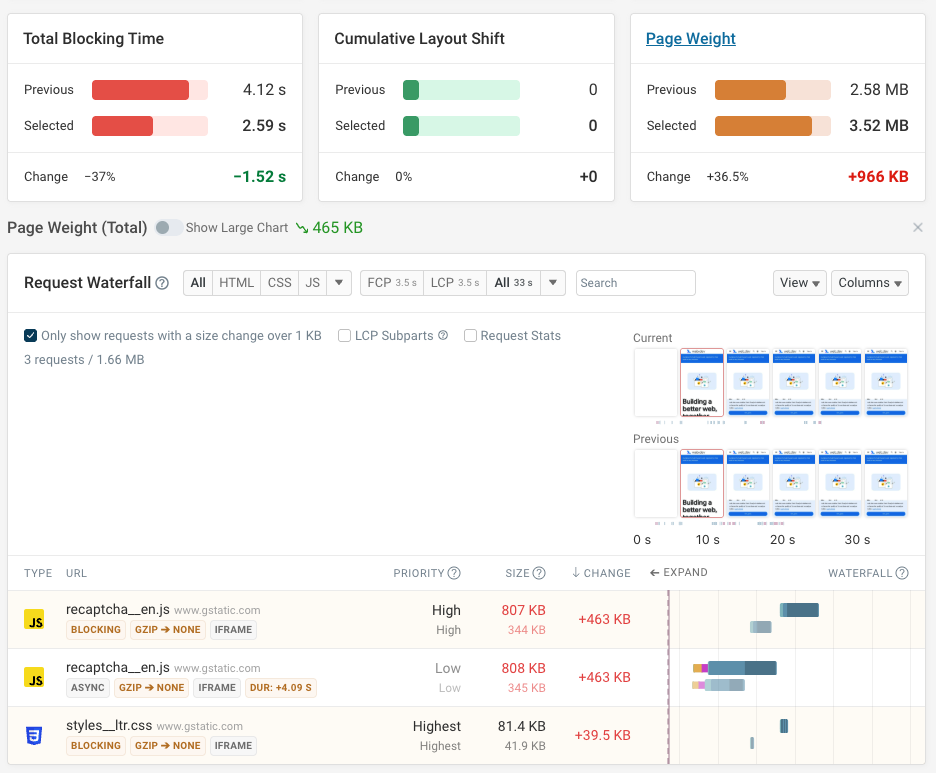
DebugBear can alert you when new issues come up and then help you see what broke. For example, here we can see a 36% increase in page weight. When debugging the change we see the specific files that increased in size. Here text compression no longer works correctly, as indicated by the change from Gzip to no compression being applied.
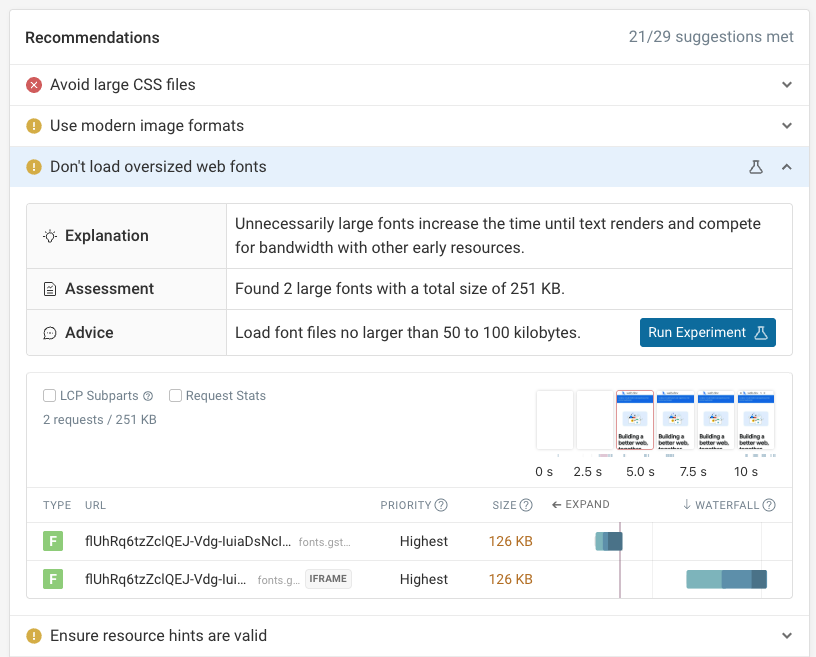
DebugBear also includes more advanced performance recommendations than Dynatrace, helping you find the most important optimizations quickly.
You can also run experiments to try out fixes to see how they impact your metrics. Sign up for a free trial.


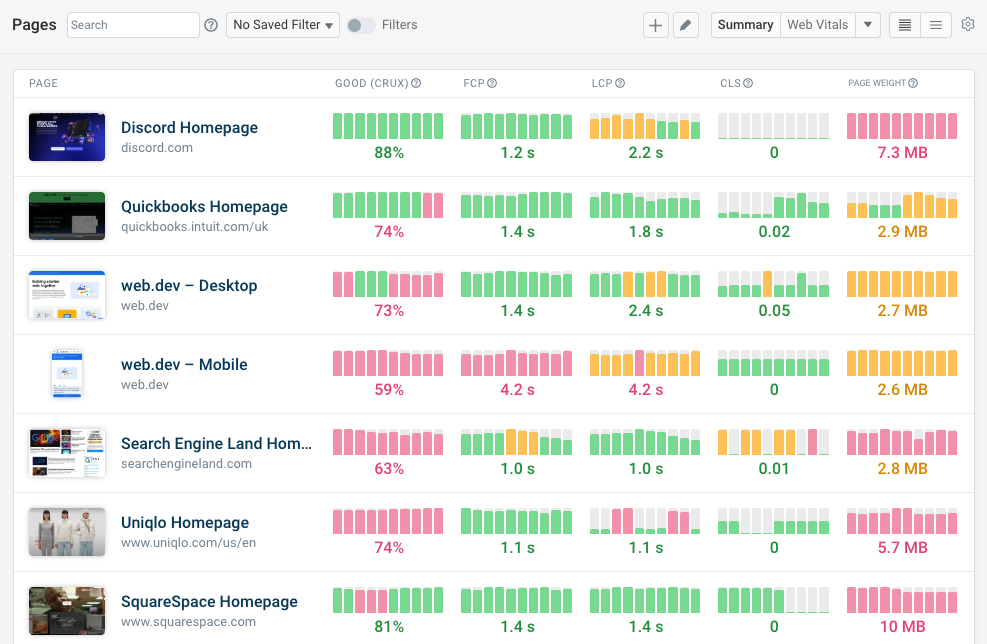
Monitor Page Speed & Core Web Vitals
DebugBear monitoring includes:
- In-depth Page Speed Reports
- Automated Recommendations
- Real User Analytics Data