
Calendly makes it easy to book calls when someone else is available without confusing time zone conversions. We use it at DebugBear to set up calls with our customers.
However, the Calendly booking page often loads frustratingly slowly. In this article, we'll take a look at what's slowing down the Calendly booking page and what can be done to improve it.
How fast is the Calendly website?
First, let's check if poor performance is actually a problem for real users. By running a website speed test we can check real user metrics that Google's Chrome User Experience Report (CrUX) has collected from Chrome users.
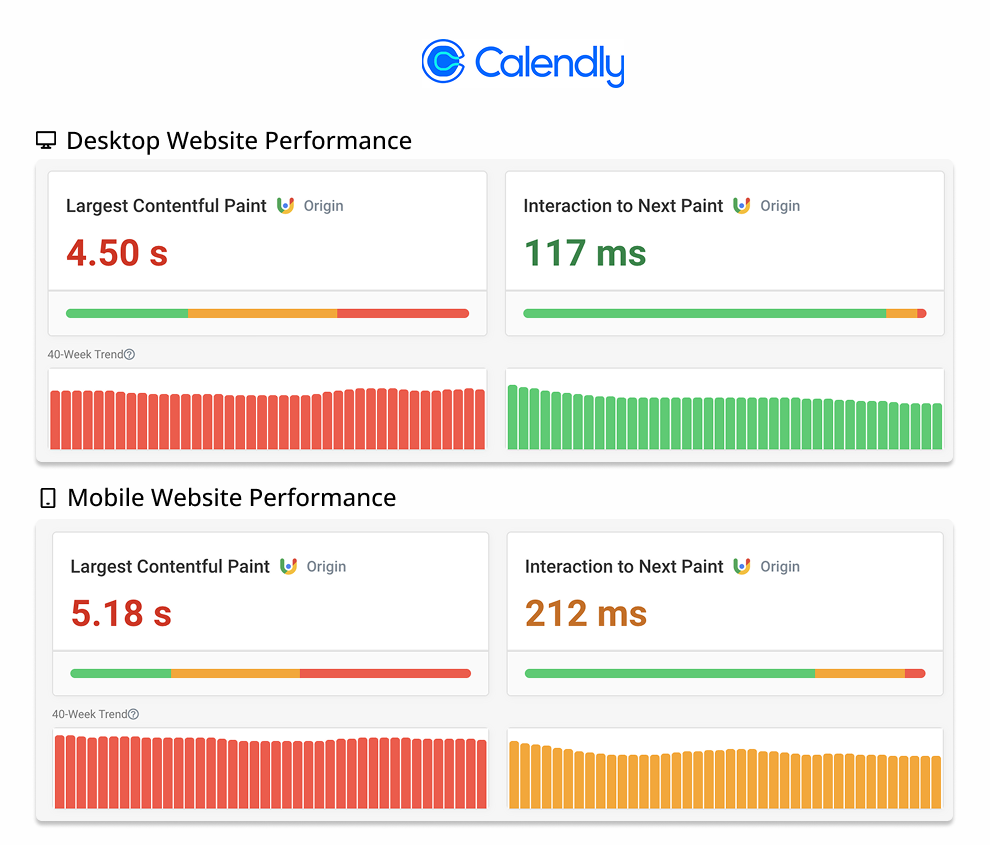
When looking at the entire Calendly website Google reports a loading speed of 4.5 seconds on desktop and 5.2 seconds on mobile. These numbers represent the 75th percentile, which means that 75% of visitors wait less than that while 25% wait longer.
We can also see that 33% of desktop visitors and 43% of mobile visitors wait over 4 seconds for their page to load.
The booking page probably loads more slowly than the website as a whole. Many static marketing pages load fast, while the booking page is more interactive and requires JavaScript to render.
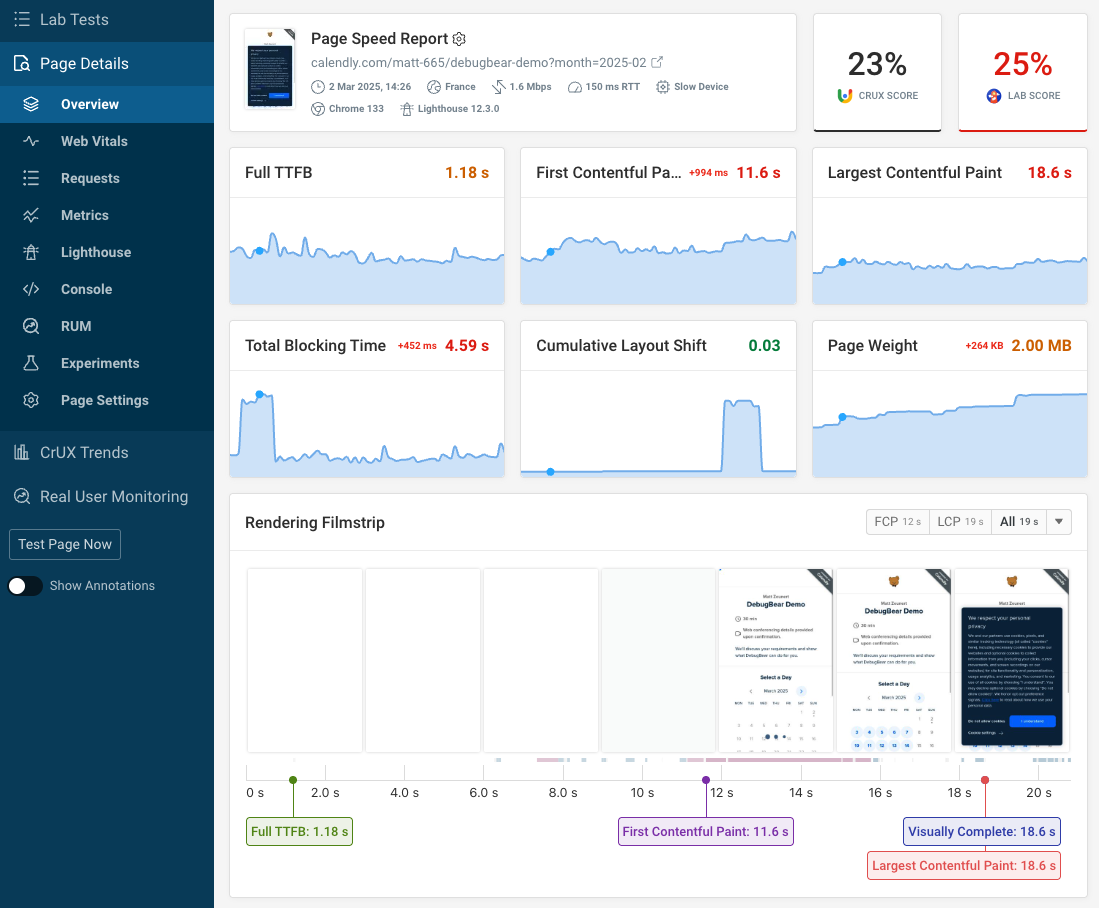
Here's an example of what the loading process of the booking page looks like on a desktop device. We can see a spinner after 2.9 seconds and the main page content starts loading after 5.1 seconds.
I also found several people online reporting with the Calendly embed on their website loading slowly.

Website Performance Audit
When taking a closer look at the website I found several issues:
- A large CSS file
- Client-side rendering logic
- Slow fingerprinting code
Almost half a megabyte of CSS code
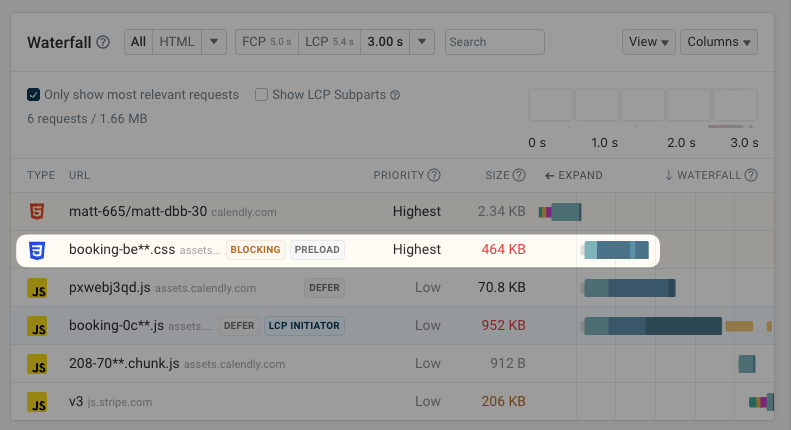
During the early loading stages of the page the booking.css stylesheet jumped out to me. With a size of 464 kilobytes it is unusually large!
That means it takes over 600 milliseconds to download in the test environment, using up bandwidth that is then not available to other requests.
Every now and then I run into a CSS file with a huge number of rules or selectors that are tens of thousands of characters long. But most of the time it's not the CSS itself that is large, but rather embedded resources like images or fonts.
Here we can see that most of the stylesheet consists of web fonts embedded as Base64 data URLs.

CSS files are render-blocking, which means that no page content is shown until the stylesheet has loaded. That means all of these embedded fonts now block rendering, which would not be the case had they been loaded as separate files.
Embedding fonts in CSS can be okay, but like with font preloading you want to only load 1-3 fonts that are used most frequently on the page. Ideally font files are also less than 30 kilobytes large.
Analyze your own CSS files with our free CSS Size Analyzer.
Client-side rendering
If we take a closer look at what causes the largest image on the page to load we can see that the <img> tag is created using JavaScript. The Calendly booking page is a web application with client-side rendering, which means the browser needs to download and execute JavaScript code before any page content shows up.
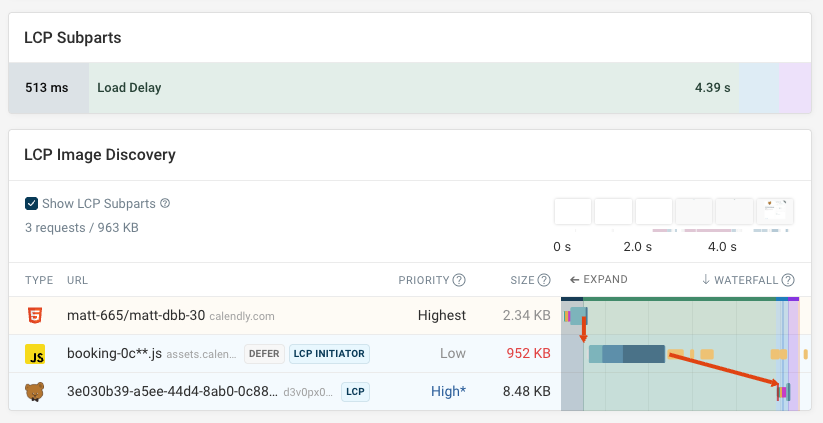
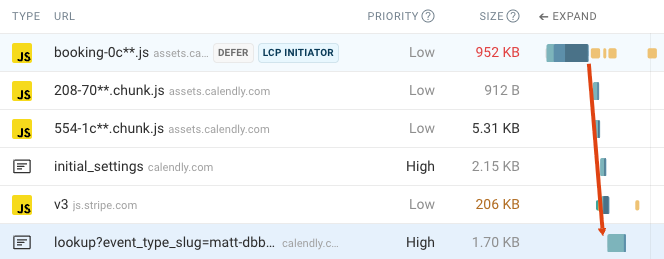
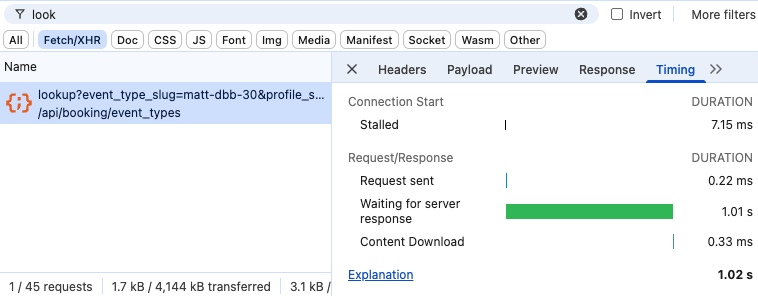
After loading the initial JavaScript bundle, the page starts loading two small additional chunks of JavaScript code. It then requests additional data that's necessary to render the page, like initial_settings and lookup?event_type_slug=.
This screenshot shows some of the requests that are triggered by the main JavaScript bundle code.
From the outside it's difficult to identify specific optimizations in a large JavaScript app, but there are some general best practices that can be applicable.
Server-side rendering
Sending the fully rendered page HTML as part of the initial document response means content can load independently of the client-side JavaScript code.
However, the page won't actually be usable yet, so this might not make sense for a very interactive page like this booking form.
Reduce bundle size
Loading, parsing, and executing JavaScript code takes time. By avoiding unnecessary dependencies and not loading unused JavaScript developers can speed up single page application code.
Avoid sequential request chains
Loading additional JavaScript chunks after the initial bundle requires an extra round trip on the network. Only requesting the data necessary to load the page after that also slows down the page.
If the server could start processing the request while the client-side JavaScript is still loading then the data response might be ready in time for the JavaScript app to start rendering.
The request duration for loading the page data is quite variable, varying from 100 milliseconds to 3 seconds. Loading the data early will often not have a big impact, but will help a lot when the request isn't handled quickly by the server. Here's an example of a slower request from the Chrome DevTools network tab.
Overall it's best to approach fixing these issues by collecting real-user web performance data. That will tell you how long different CPU tasks actually take and whether specific resources on the network are loading slowly.
Resource-intensive bot protection script
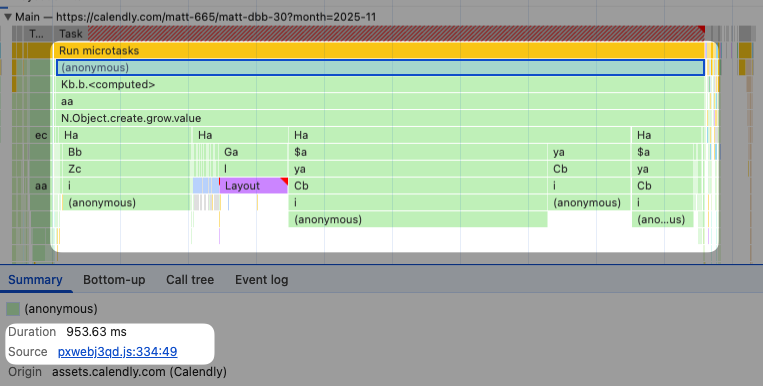
When I load the booking form on my laptop, the page spends about one second running code in pxwebj3qd.js. Here's a screenshot from the Chrome DevTools performance profiler showing a long CPU task.
If we pause execution in Chrome's JavaScript debugger and look at the call stack we can see that this processing logic starts by calling a window.GetTelemetryID function.
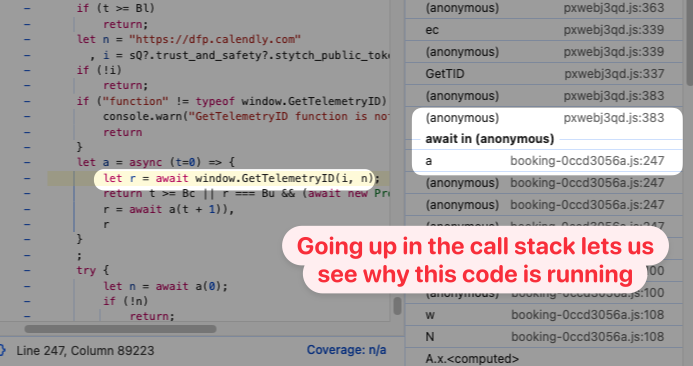
Calendly is using Stytch Device Fingerprinting to identify visitors for fraud and risk prevention. Unfortunately, this script does impact page load time.
After blocking it on my computer the Largest Contentful Paint score improved from about 2.8 seconds to about 2.4 seconds for a repeated page load.
Taking a look at monitoring data
I've been wanting to look into these Calendly performance issues for a while. And I actually started monitoring one of the booking pages back in February!
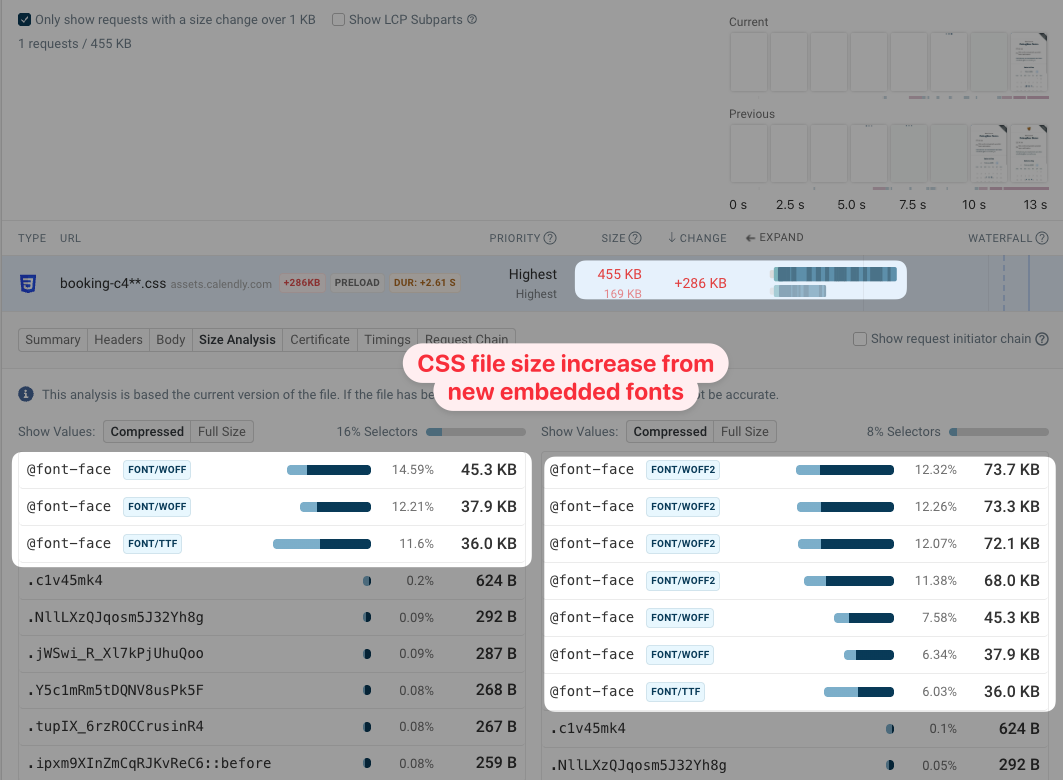
We can see that page weight has increased over time, and that most of this increase comes from additional JavaScript code being added to the page.
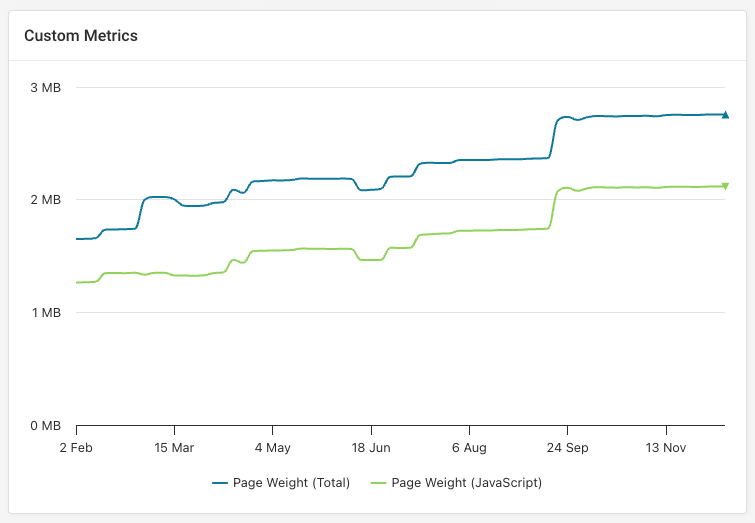
We can also see that the CSS file only contained 3 fonts until early March, when 4 new font files were added.
These two examples show that page size and complexity often increase gradually. Each individual change does not have a performance impact that's immediately noticeable, but over time these changes add up.
Conclusion: keeping websites fast
Creating a booking page for scheduling calls might sound easy, but actually involves advanced functionality to support features like payments, multi-person meetings, or custom branding. Preventing system abuse also adds additional complexity. That makes it easy for performance to slip through the cracks when focusing on other requirements.
In this performance audit we saw performance issues specific to single page applications, as well as a CSS size issue that's also common on many more traditional multi-page apps.
Web performance monitoring can help debug performance issues and get alerted whenever there's a regression. DebugBear can run scheduled synthetic tests as well as collecting real user monitoring data that shows you how your actual visitors are impacted.


Monitor Page Speed & Core Web Vitals
DebugBear monitoring includes:
- In-depth Page Speed Reports
- Automated Recommendations
- Real User Analytics Data