
The Cumulative Layout Shift (CLS) metric measures how much content moves around on a web page after rendering.
However, sometimes real users experience layout shifts that can’t easily be replicated in lab-based test results. This article looks at why this happens and what you can do to identify and fix these layout shifts.
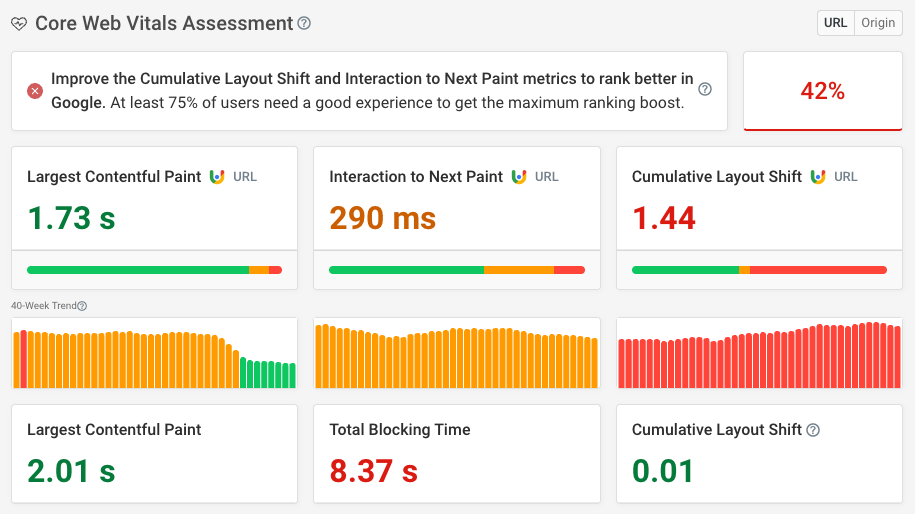
What is the difference between lab and field data generally?
Lab data is collected in a controlled testing environment. It looks at one consistent experience, though you can usually configure variables like opening the page on a desktop or mobile device. By default no user interactions are simulated, and the page test only looks at the initial loading experience of the website.
Field data is collected from a large number of real users and aggregates their experience into a single metric. Visitors will access your website from a range of different devices and interact with the page elements that interest them.
Learn more about the differences between lab and field data.
How to check lab and field CLS
To see both real user and synthetic test data you can use a performance testing tool like the DebugBear website speed test or Google's PageSpeed Insights.
These tools combine two data sources:
- An on-demand synthetic test
- Real user data from the Chrome User Experience Report (CrUX)
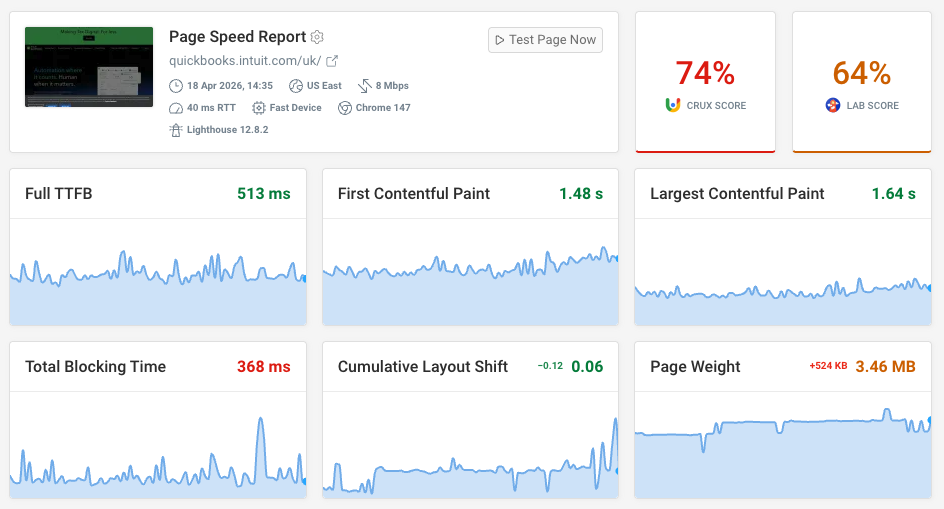
The DebugBear test also shows you a history of how CLS on your website has changed over the last 40 weeks.
Why are there CLS discrepancies between lab and field data?
Discrepancies between the two types of data can arise for a variety of reasons, for example:
- Content shifts when scrolling down the page
- Content shifts when interacting with elements on the page
- The website is a single-page app and field data contains metrics for other URLs
- Navigations using the browser back button
- Users see different content based on login status or saved settings
- Real user data may be out of date
- Differences in screen size
- Browser differences like installed extensions
CLS being higher in the field is most common, although in some cases there will be more layout shift reported by the lab tests.
Layout shift when scrolling down the page
Most of the time lab-based performance tests only open the page and test how quickly content shows. They don't then interact with the UI or scroll down the page.
However, real users won't bounce immediately when they arrive on your website. This may be due to lazy-loaded images or because additional sections are rendered as the user scrolls down.
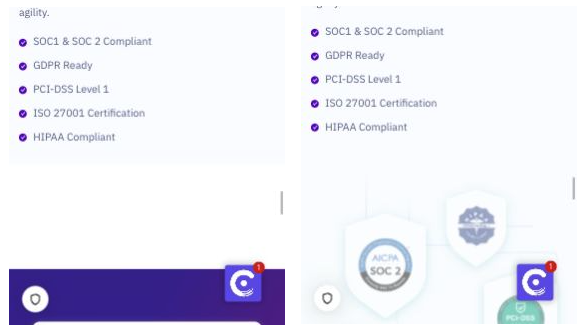
For example, this screenshot shows a new section appearing with an animation, pushing down the existing purple section that was shown before.
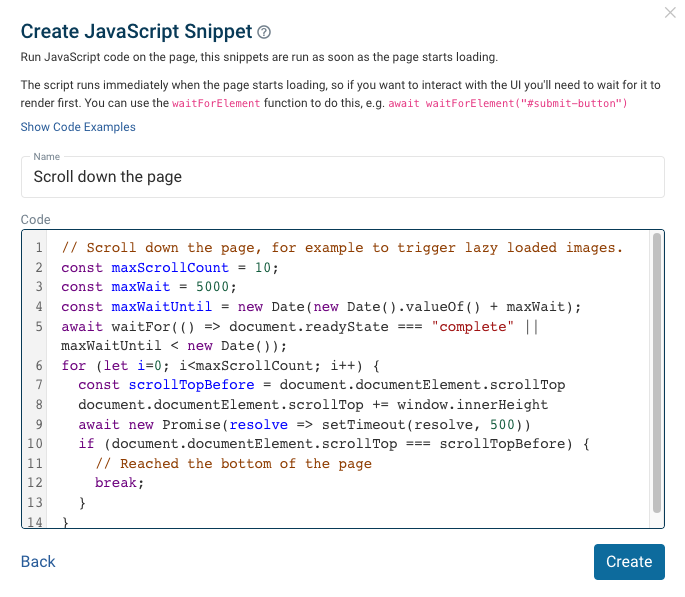
You can set up your performance tests to scroll down the page when monitoring your website with DebugBear. Sign up, open Advanced Settings when creating a page, and then choose "Run JavaScript" and select one of the code examples.
Layout shift when interacting with page elements
Generally layout shift does not count toward the Cumulative Layout Shift score if it follows shortly after a click or keypress. The limit for this is 500 milliseconds.
However, sometimes layout shift occurs later than that but still in response to user input. For example, a server request for new content may take a while to complete, delaying the UI update and potentially also resulting in slow Interaction to Next Paint (INP). Or an animation might be using setInterval to update the UI more than 500 milliseconds after the user interaction.
Layout shift in single-page apps
Single-page applications are especially vulnerable to layout shift as pages render gradually on the client rather than being loaded from the backend in one big chunk.
If a user moves from page A to page B, then any layout shift on page B will still be attributed to page A, at least when working with Google’s CrUX dataset.
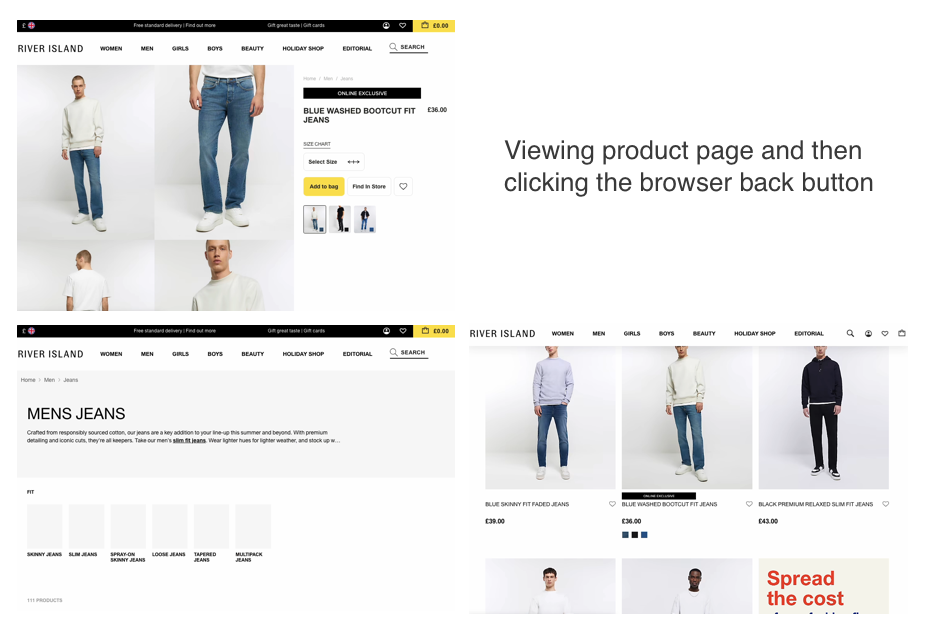
Navigations using the browser back button
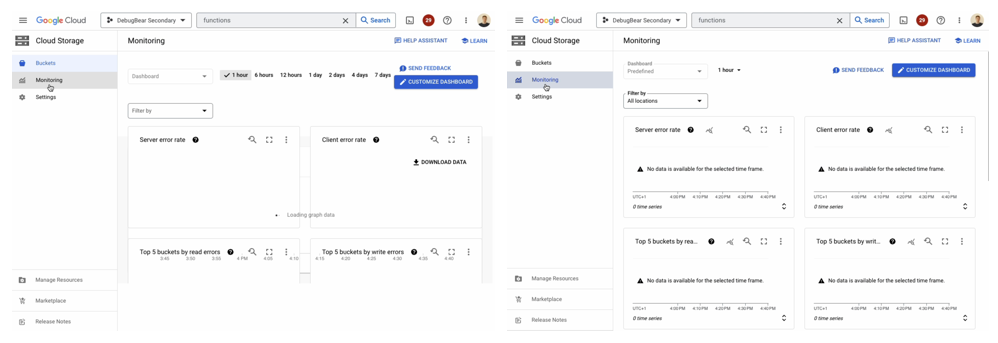
Layout shifts that happen when using the back and forward buttons in the browser are easy to miss. The back/forward cache can avoid these shifts by restoring the previous page state instantly.
This is a common problem on ecommerce websites where users return to a product listing page and need to arrive in the same place they were when they first clicked on a product.
Different content based on login status or saved settings
Depending on what content is shown, the user may or may not experience layout shifts. Maybe a logged-in user sees a comment box that’s not shown to logged-out users. Users may also have saved settings that lead to different content being loaded, for example depending on cookies being opted in or not.
For example, the Opodo homepage shows the “Flights” tab by default, but if the user has previously selected “Car Rentals”, that will be shown as the default tab. However, their skeleton loader always leaves space for the “Flights” tab, not the “Car Rentals” UI.
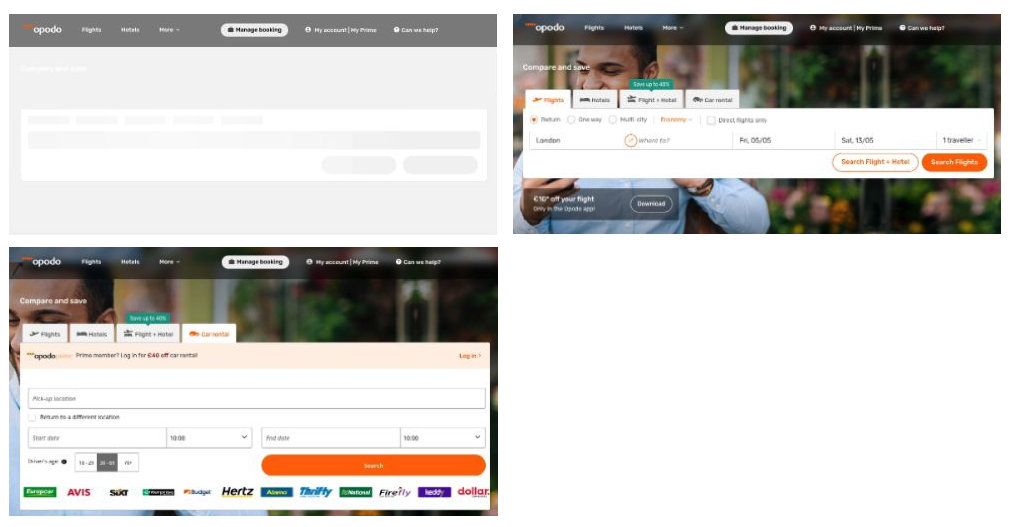
Accordingly, lab tests show little layout shift while Google’s Chrome User Experience Report reports content shifts on the page.
Out-of-date real user data
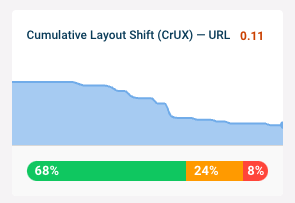
Data from the Chrome User Experience Report (CrUX) aggregates data over the last 28 days. If you’ve deployed an optimization on your website it will take a few weeks to show up in the field data.
Differences in screen size
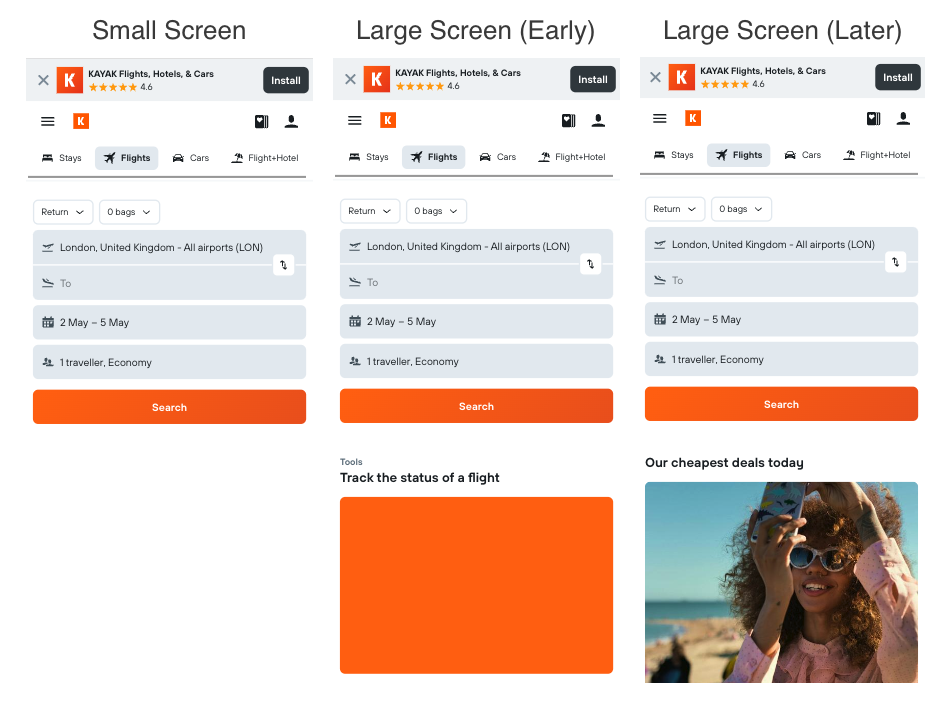
Lab tests are run with a consistent screen size, but real users will open your website on a variety of screens.
For example, on a small mobile screen the Kayak homepage has little layout shift. However, on a long narrow screen the “Our cheapest deals today” section appears and pushes down existing content.
Browser differences like installed extensions
Content on the page may also differ depending on what browser extensions the user has installed. For example, an extension that translates page content could cause layout shift when the translation takes place.
At the same time, extensions may reduce layout shifts. For example, a layout shift that happens when an ad appears won’t occur when an ad blocker is installed.
Debug CLS discrepancies with the CLS tester
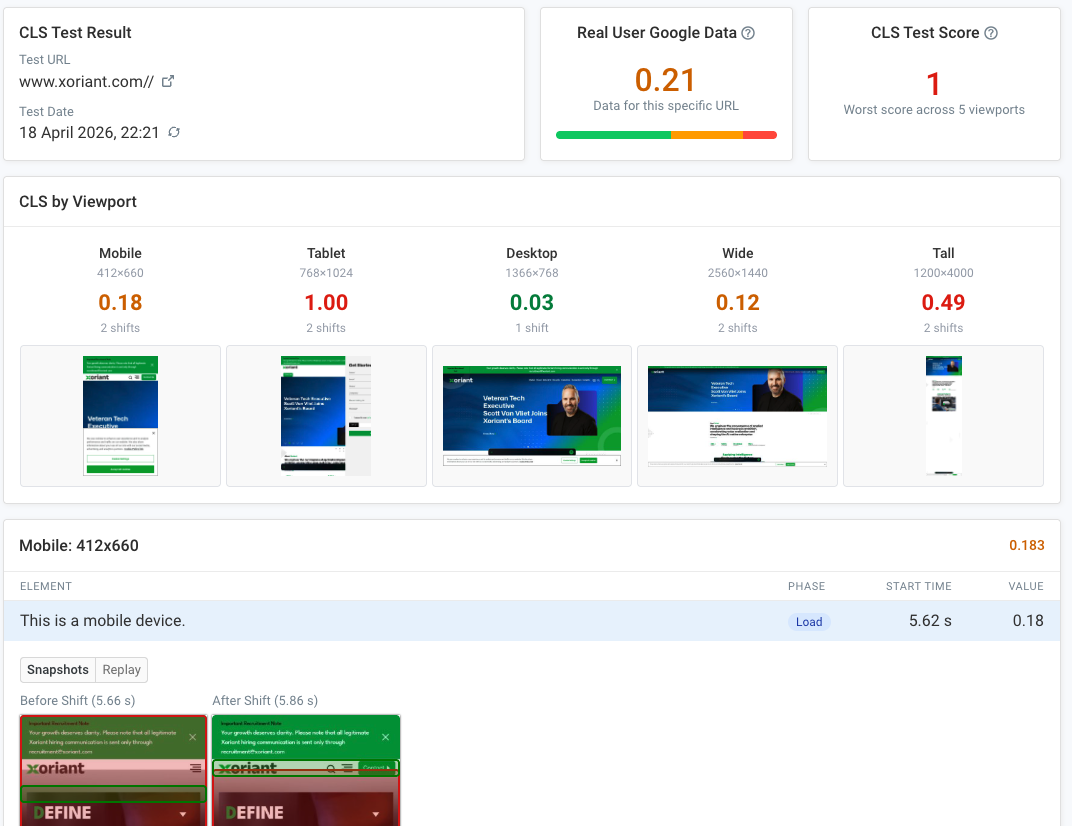
Our free CLS Debugger checks your website for layout shifts across multiple device sizes, and scrolls down the page to check for shifts that happen after the initial page load.
You won't be able to replicate logged-in users or specific user interactions, but you can use the tool to identify a number of common causes of layout shift discrepancies.
How to monitor Cumulative Layout Shift on your website
You can use DebugBear to monitor layout shift and identify optimizations. The tool combines synthetic tests with field data to provide in-depth insights into your website's performance.
See how your scores change over time and get alerted when there's a regression.
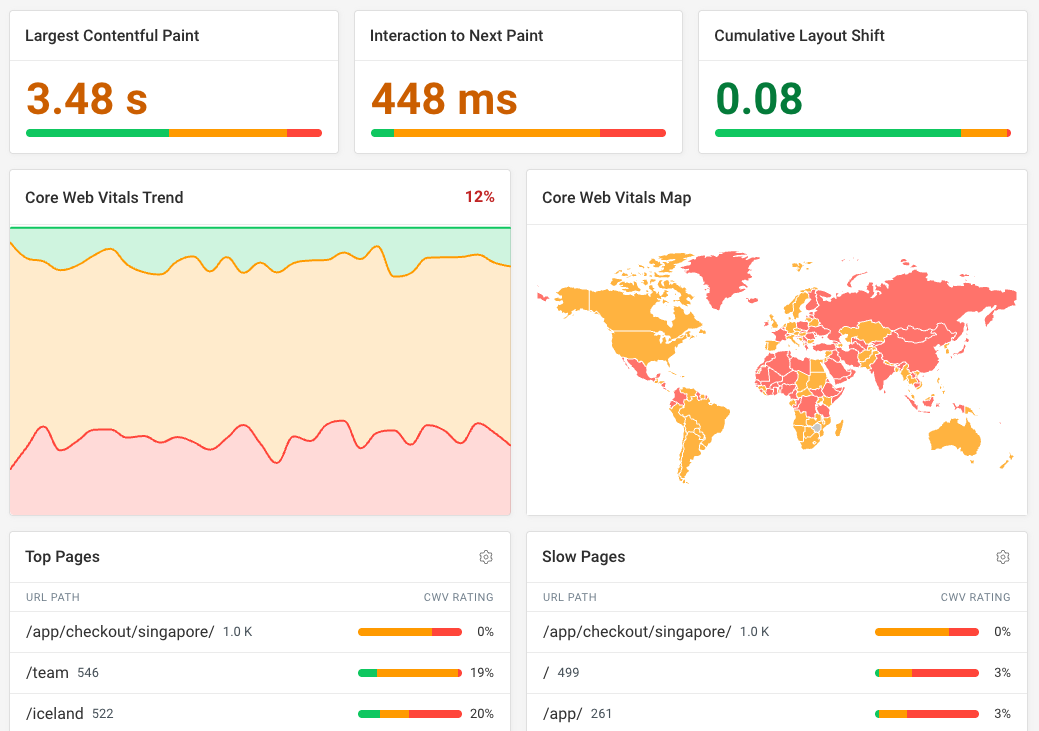
DebugBear also provides real user monitoring for Google's Core Web Vitals metrics.
Use this data to measure page speed for real users, identify scripts that delay interactions, and fix the most common causes of layout shift on your website.
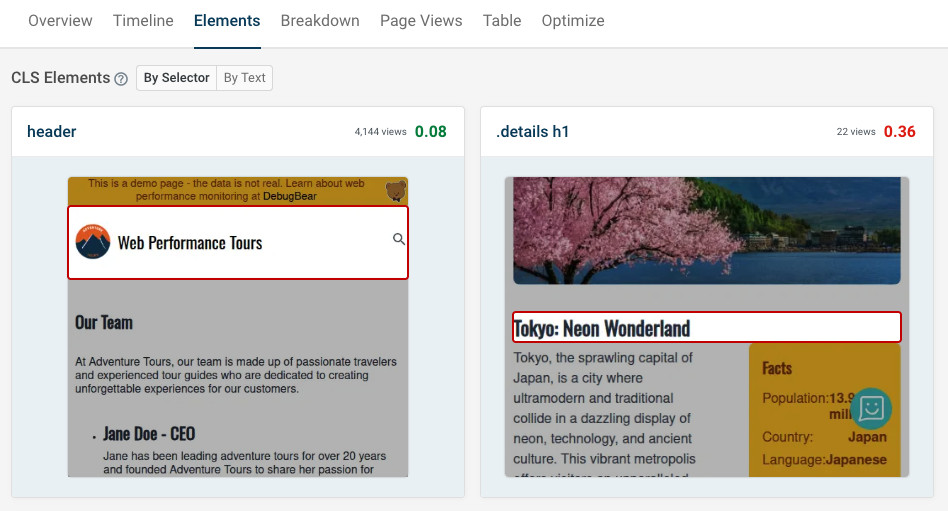
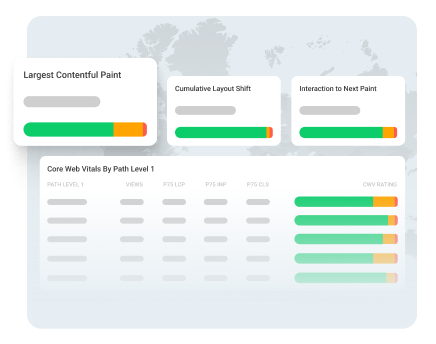
The real user monitoring dashboard for Cumulative Layout Shift lets you see how many users are impacted by layout shifts, what elements are shifting, and when the shifts are happening.
You can also inspect specific page visits to understand the user experience and the technical factors that were responsible.
Monitor Page Speed & Core Web Vitals
DebugBear monitoring includes:
- In-depth Page Speed Reports
- Automated Recommendations
- Real User Analytics Data