
Many site speed testing tools provide recommendations to make your website faster. But it can be hard to tell whether these recommendations will work and how big the impact will be.
To estimate how much an optimization will help you need to try it out on your website. But deploying a new change to a staging server can be slow.
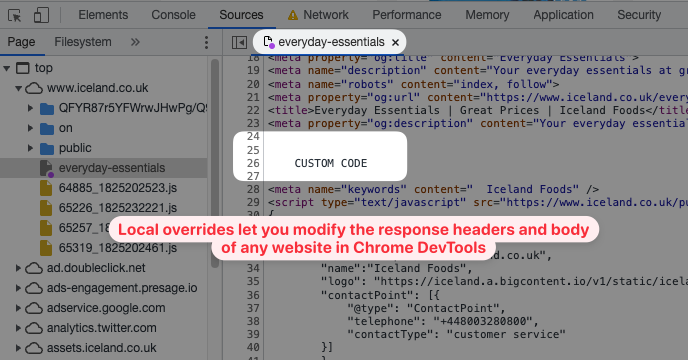
The local overrides feature in Chrome DevTools offers a solution. It allows you to make changes to your website locally and then measure how they impact performance.
This article explains how local overrides work and how they can be used to test Core Web Vitals optimizations.
What are local overrides in Chrome DevTools?
Local overrides let you override server responses with file content saved locally on your computer. Instead of making a network request for a resource Chrome will serve it from a folder on your hard drive.
This lets you do a range of things:
- Experiment with content changes on any website
- Try out new CSS styles on any website
- See how fast your website renders with certain render blocking files removed (to optimize Largest Contentful Paint)
- Check if layout shift fixes are working correctly (to optimize Cumulative Layout Shift)
How to enable local overrides in DevTools
It takes a few steps to run your first experiment, but it’s easier after the initial setup:
- Open Chrome DevTools (by right-clicking the page and clicking Inspect)
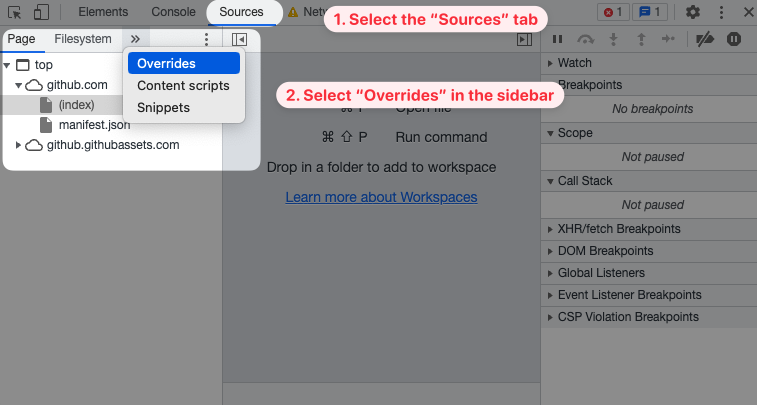
- Switch to the Sources tab
- In the sidebar, select Overrides
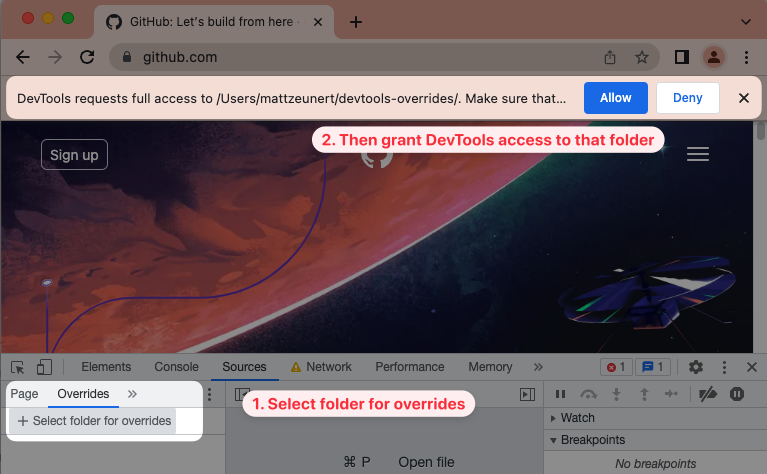
- In the sidebar Overrides tab, click Select folder for overrides (this is a folder on your computer where any custom HTML/CSS/... will be stored.)
- When you get the DevTools requests full access to the folder click Allow
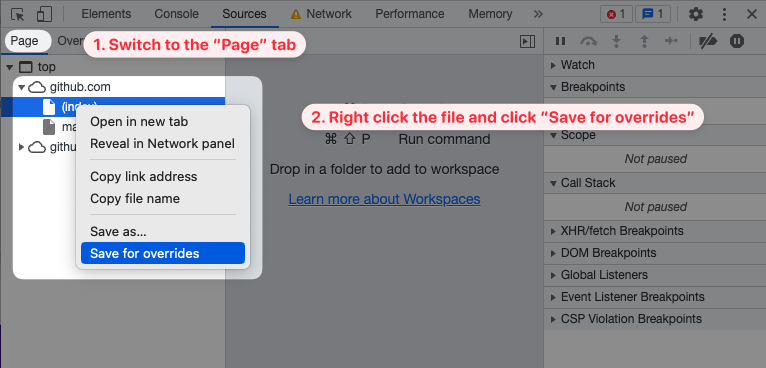
- Switch to the Page tab in the sidebar
- Right-click the file you want to override and click Save for overrides
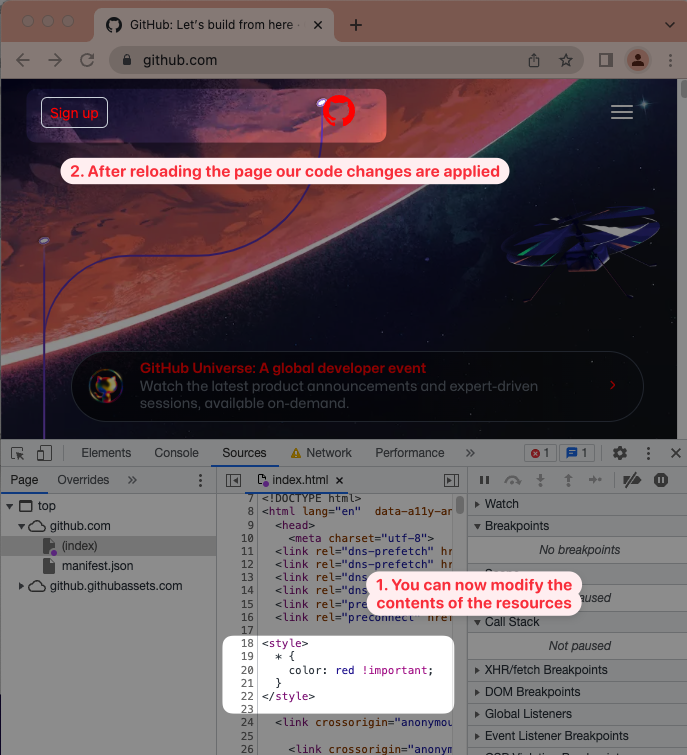
- The file now has a purple icon indicating that it’s served locally
- Click the file to edit it – in this example we just added a new style tag to the HTML
- Use Cmd+S (Mac) or Ctrl+S (Windows) to save your changes
- Reload the page to see the impact of the local overrides
Testing a Largest Contentful Paint optimization
Changing the text color is fun, but we want to optimize Core Web Vitals.
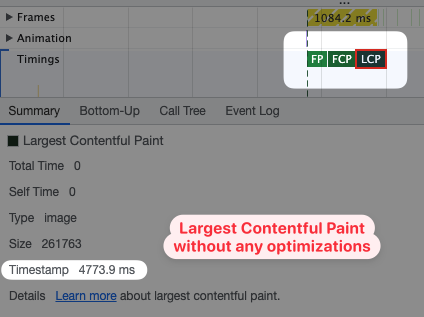
You can collect a performance profile using DevTools. If I go to the GitHub homepage with Slow 3G throttling enabled it takes about 4.8 seconds before the Largest Contentful Paint milestone is reached.
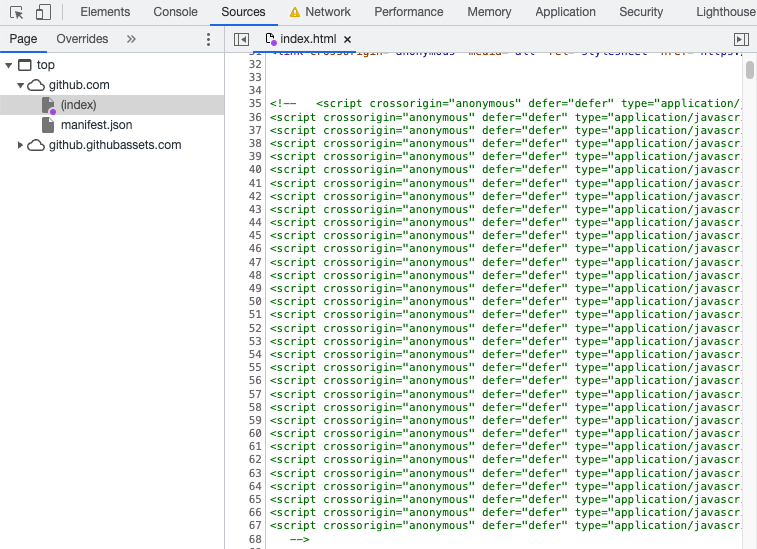
GitHub loads a number of JavaScript files that aren’t important for the initial render. Let’s try commenting them out.
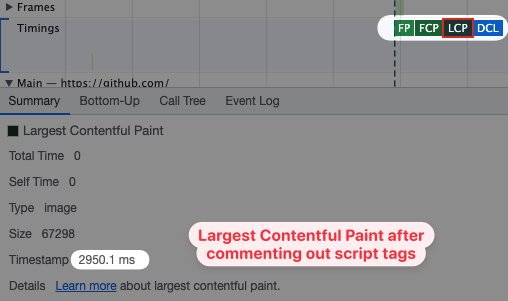
Now the page renders in just 3.0 seconds.
Of course if we wanted to do this in production we’d need to think more about whether we still need to load those scripts and when they should be loaded. But at least we have a rough idea of how big the performance impact of removing the scripts would be.
You can try out a range of LCP optimizations with local overrides, for example:
Run page speed experiments on DebugBear
DebugBear provides detailed page speed recommendations and lets you try out fixes through local overrides using the experiments feature.
When viewing a test result expand a recommendation with a beaker icon and click on "Run Experiment" to preview an HTML change and measure its performance impact.
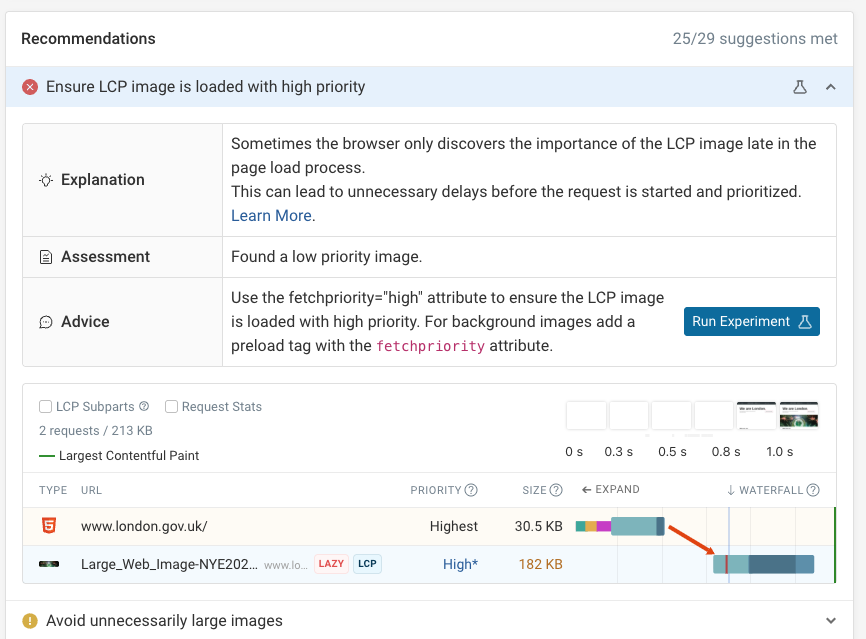
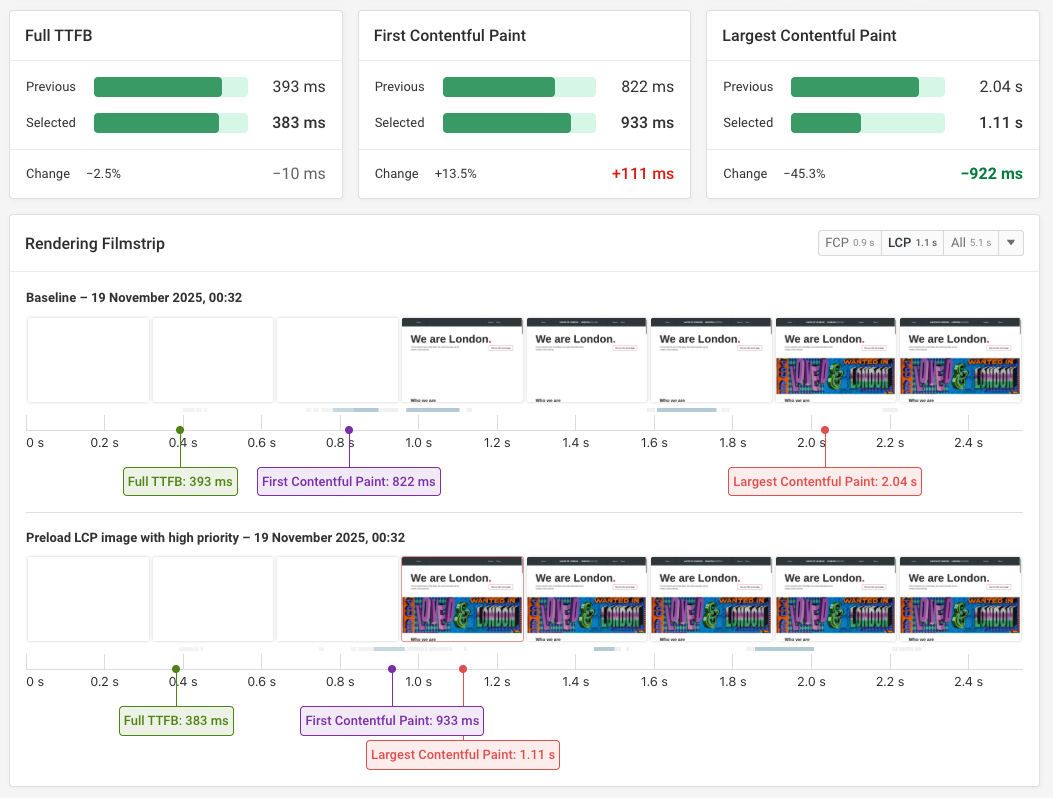
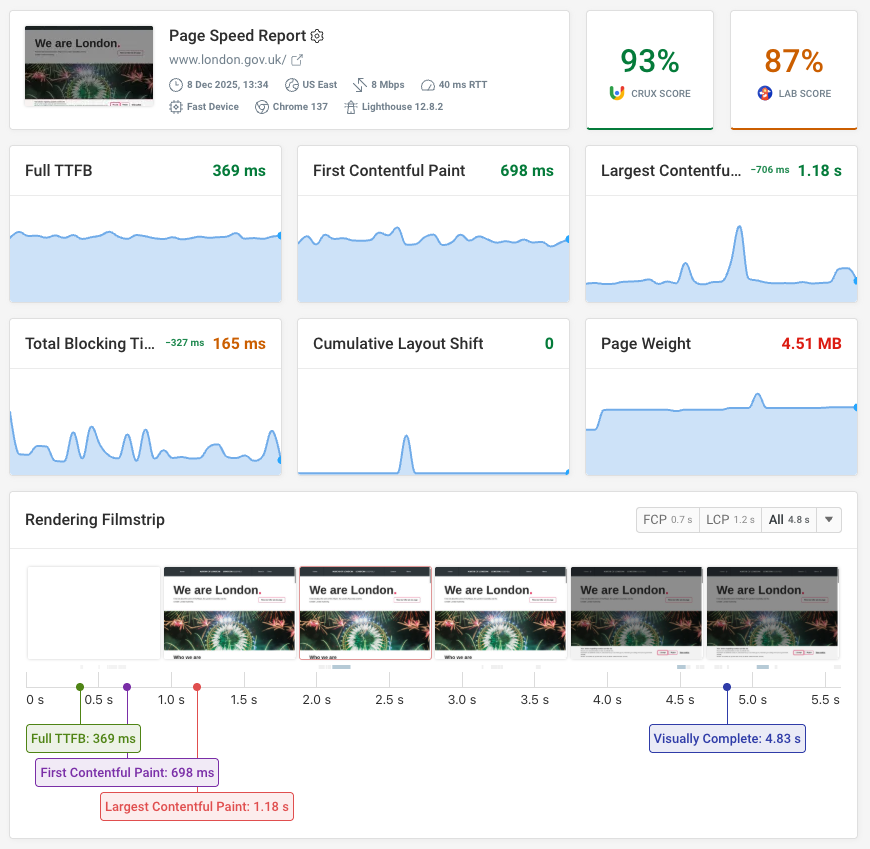
Once the experiment has run you can see how your metrics have improved and what that means for user experience.
Here the Largest Contentful Paint metric improves from 2.0 seconds to just 1.1 seconds. The main image on the page appears much earlier in the page load process.
Testing a Cumulative Layout Shift optimization
Similarly, we can use local overrides to see if CLS fixes are working.
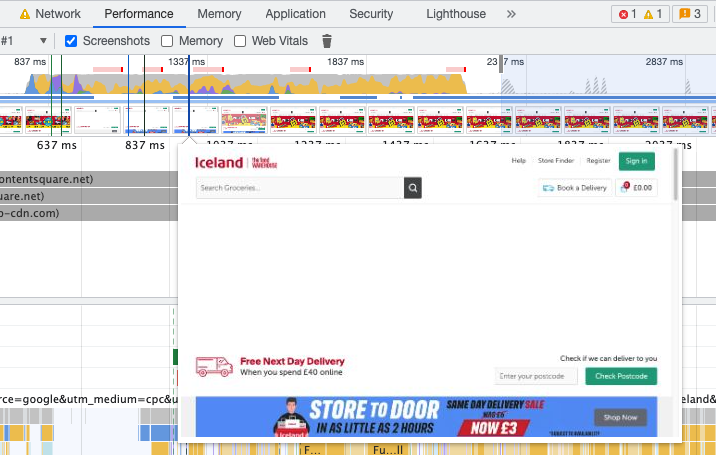
Let’s look at this layout shift on the Iceland homepage. Once the slider appears all other content shifts down on the page.
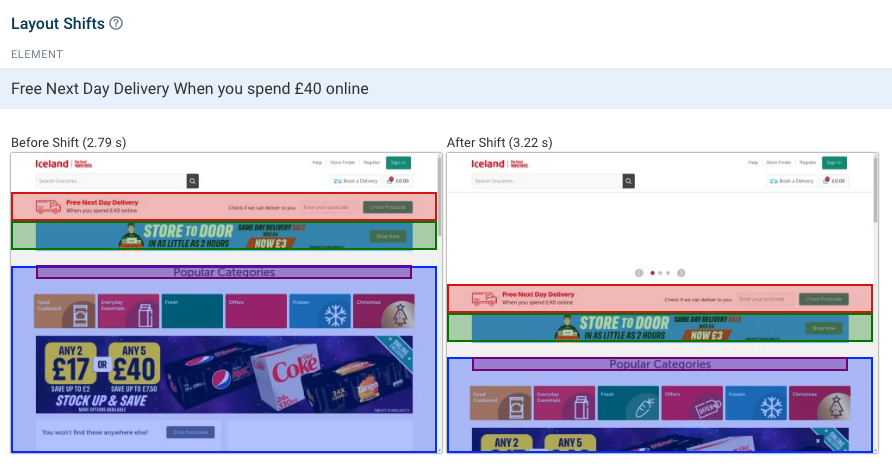
We can fix that by adding a CSS min-height to the slider.
<style>
  .carousel {
    min-height: 288px;
  }
</style>
The carousel now shows an empty area until the slider content loads. When it does load no page elements are pushed down the page and the layout remains stable.
Overriding Response Headers
Response header overrides are an experimental DevTools feature that allows you to substitute response headers in addition to the response body.
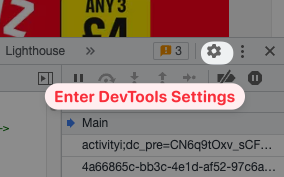
To enable this feature, first enter the DevTools settings.
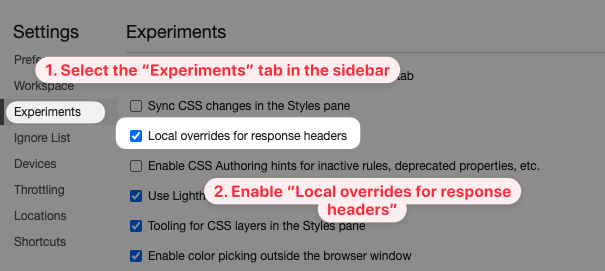
Then select the Experiments tab and check the Local overrides for response headers box.
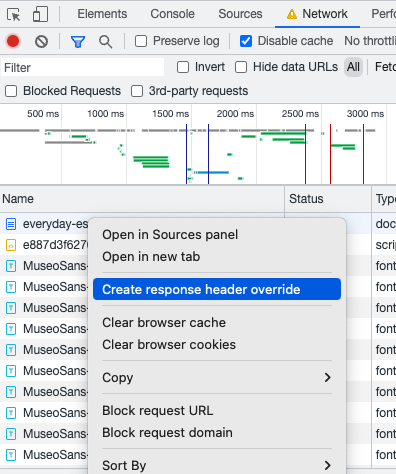
In the DevTools Network tab you can now right click a request and select Create response header override.
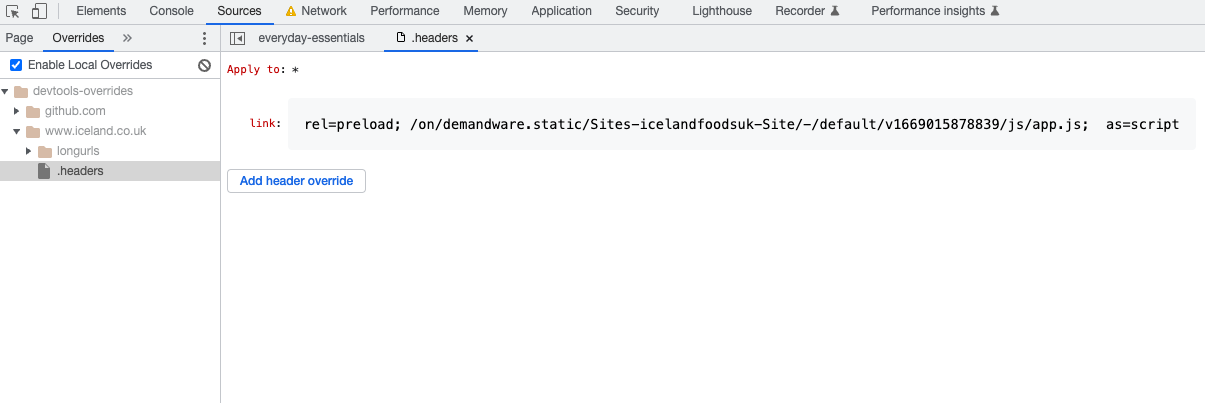
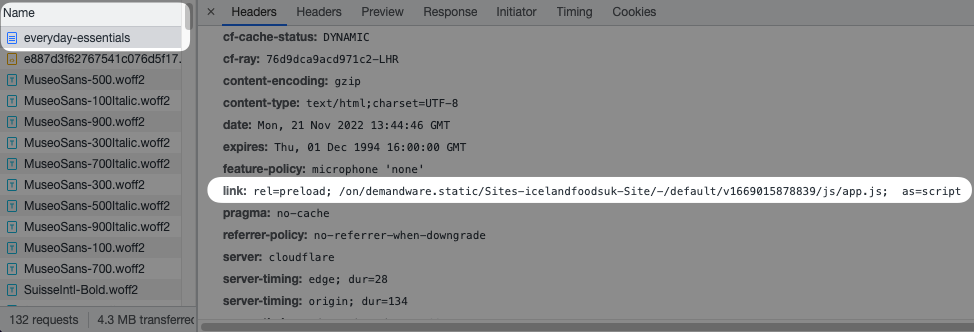
Then you can click Add header override to create your custom header. In this example we add a link preload header to load a specific JavaScript file early.
After reloading the page we can see that this header is returned with the document response and the file is preloaded.
Limitations of local overrides
Local overrides allow you to change server responses locally, but testing in DevTools doesn’t always produce reliable data.
This is because DevTools throttling doesn’t accurately model network connections and resource priorities. So the results you see in DevTools may not always translate directly to the impact of your change on real users.
Monitor website performance
DebugBear lets you track performance, identify optimizations, and try out possible fixes. It's a comprehensive solution for web performance monitoring and optimization.


Monitor Page Speed & Core Web Vitals
DebugBear monitoring includes:
- In-depth Page Speed Reports
- Automated Recommendations
- Real User Analytics Data