
How fast are typical website page load times in 2025? We took a look at data from Google's Chrome User Experience Report (CrUX).
Page load time statistics for the US
We found that an average website takes 1.9 seconds to load the main page content on mobile. On desktop pages load a little faster, within 1.7 seconds.
Visits on tablets were the slowest, with a load time of 2.3 seconds.
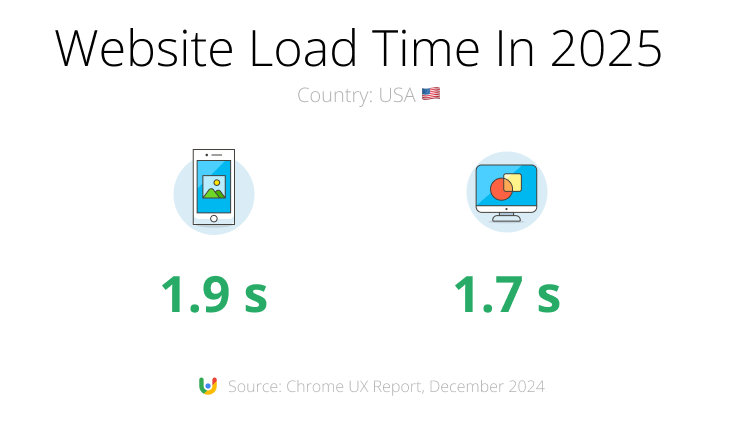
This is looking at the 75th percentile of visitor data, as reported by Google. We use the Largest Contentful Paint metric to measure the load time.
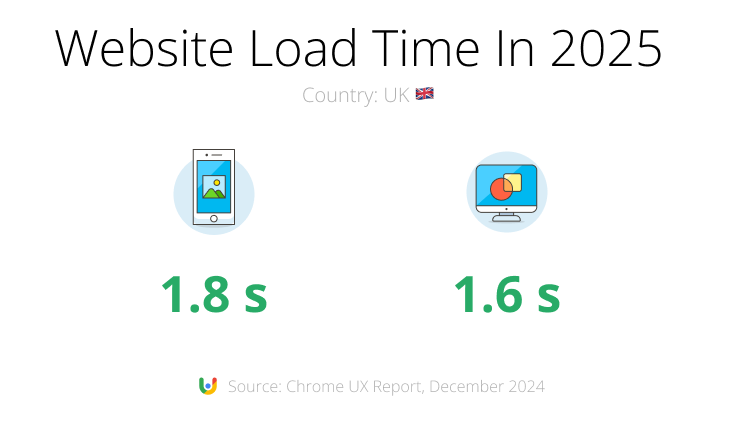
How does the UK compare? Websites load a little bit faster here, within 1.8 seconds on mobile and 1.6 seconds on desktop.
On tablet devices the loading speed is 2.1 seconds.
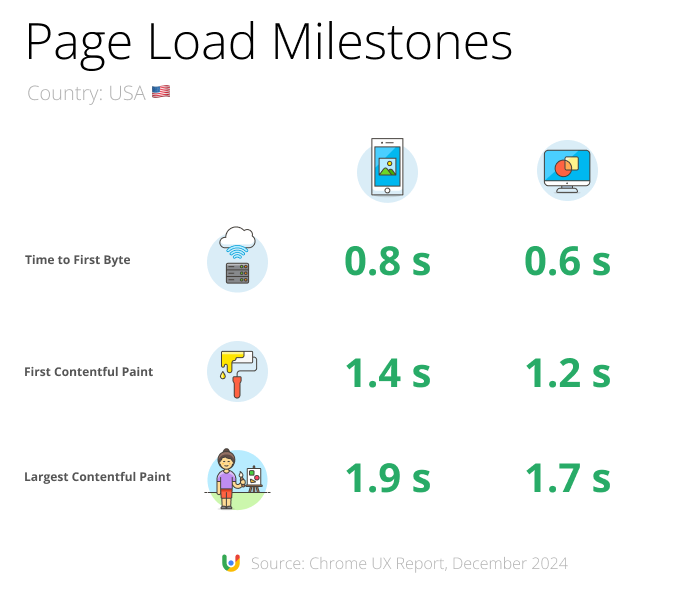
What if we look at other page load stats? Google provides data for two other page load milestones:
- Time to First Byte: how quickly does the website server respond?
- First Contentful Paint: how soon after navigation does any content appear?
A 75th percentile server response for an average website takes 0.8 seconds for a mobile visitor in the US. On desktop the server response is available within 600 milliseconds.
On mobile, page content first becomes visible after 1.4 seconds. On desktop content starts to appear after 1.2 seconds.
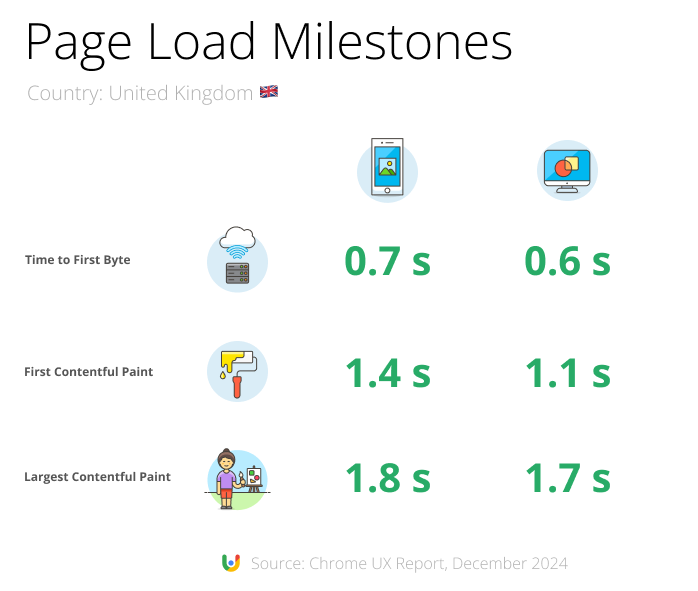
The numbers are similar when we look at the UK.
Mobile visits receive a server response after 800 milliseconds, start rendering after 1.4 seconds, and the largest content element appears after 1.9 seconds.
Like in the US, desktop server responses take 0.6 seconds. The First Contentful Paint happens slightly sooner than in the US, after 1.1 seconds.
How do website speed stats vary globally?
Page load time varies greatly depending on the device and network connection you're using to access the web.
While performance tends to be good in the US and Europe, most websites load more slowly in Africa and the Middle East.
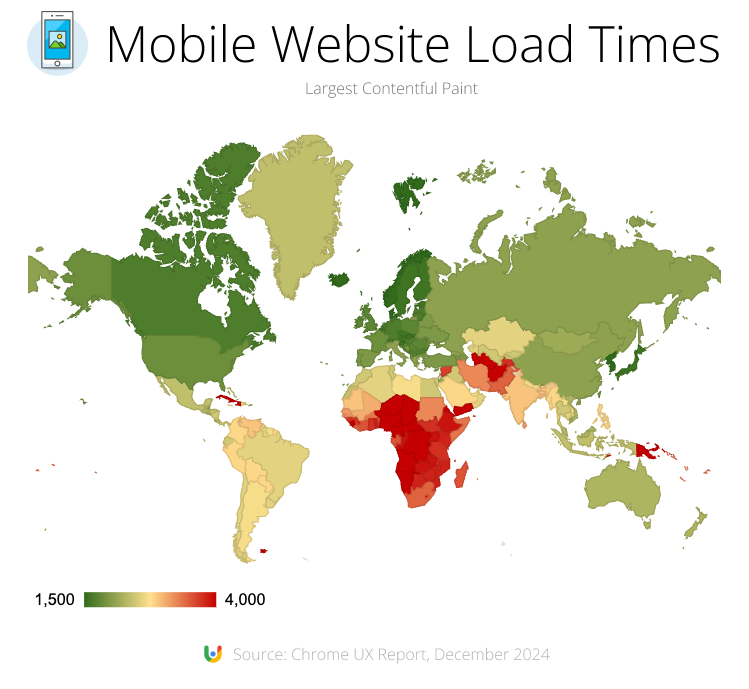
The country with the fastest page load time is... Svalbard? Pages there load in under 600 milliseconds. Other fast outliers include North Korea, Liechtenstein, San Marino, and Monaco.
South Korea, Iceland, Norway, and Denmark are tied for 6th place with a page load time of 1.5 seconds.
The US comes in at number 52 out of 237. Burundi ranks last with a mobile page load time of 7.1 seconds.
| Rank | Country | Speed |
|---|---|---|
| 6 | 🇰🇷 South Korea | 1.5 s |
| 30 | 🇨🇦 Canada | 1.7 s |
| 30 | 🇩🇪 Germany | 1.7 s |
| 52 | 🇺🇸 USA | 1.9 s |
| 73 | 🇨🇳 China | 2.1 s |
| 108 | 🇮🇩 Indonesia | 2.4 s |
| 123 | 🇧🇷 Brazil | 2.6 s |
| 162 | 🇮🇳 India | 2.9 s |
| 202 | 🇰🇪 Kenya | 3.8 s |
| 225 | 🇳🇬 Nigeria | 4.3 s |
| 237 | 🇧🇮 Burundi | 7.1 s |
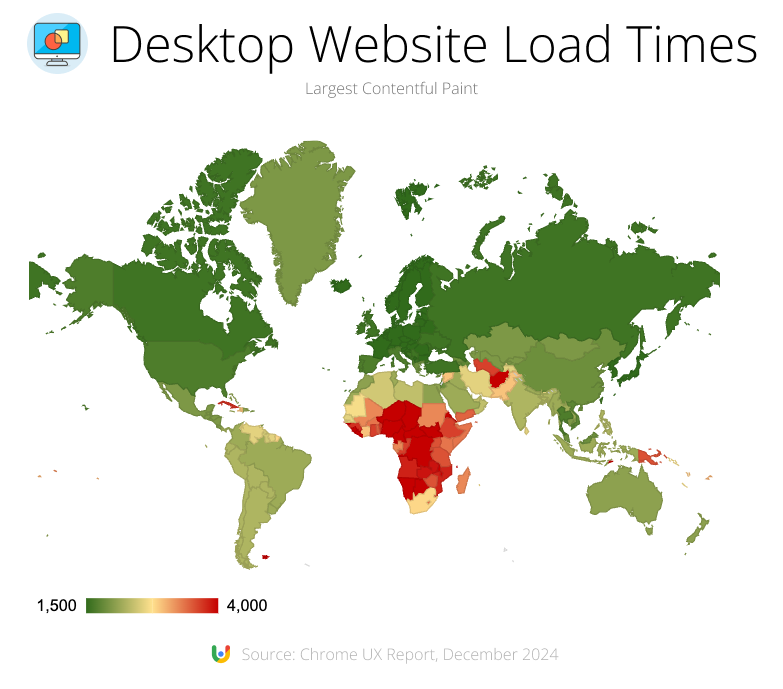
What if we look at desktop website performance instead? We generally see better scores, with a similar global distribution.
South Korea still leads with a page load time of 700 milliseconds.
Interestingly, some countries show worse data on desktop. For example, the Central African Republic has a mobile page speed of 5.5 seconds, but websites take 6.9 seconds to load on desktop. Maybe that's because people access more complex websites on desktop, while mobile content is more optimized for performance?
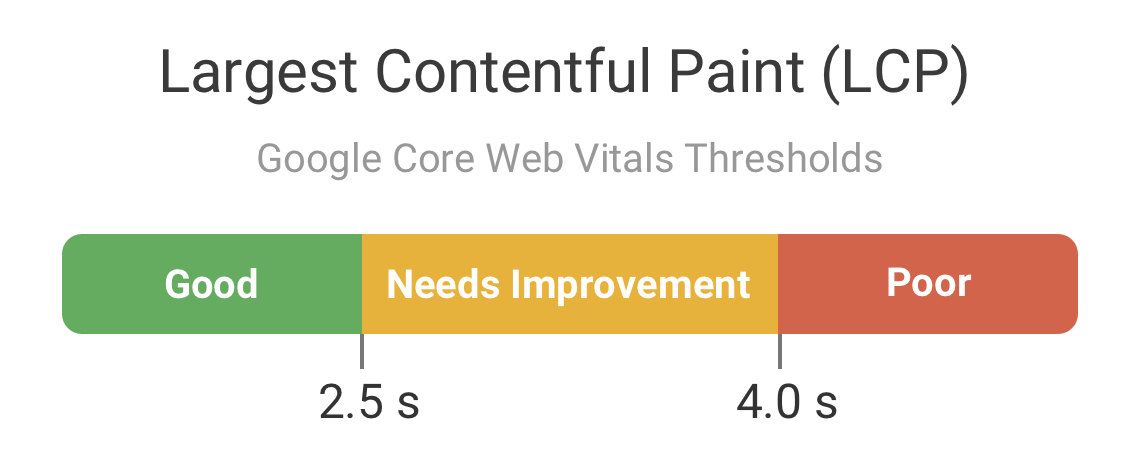
How fast should a website load?
A loading time of 2.5 seconds is considered good in Google's Core Web Vitals assessment. Of course, the less time the user spends the better.
A Google study also found that 53% of mobile visitors leave a website if it takes more than three seconds to load.
According to Nielsen Norman Group, waiting a second for a website to respond allows the user's flow of thought to continue naturally. Wait times over 10 seconds cause users to lose attention and start doing something else.
Of course, every visitor experience is different, depending on the visitor's device, network bandwidth, and network latency. On every website some visitors will have both fast and slow experiences.
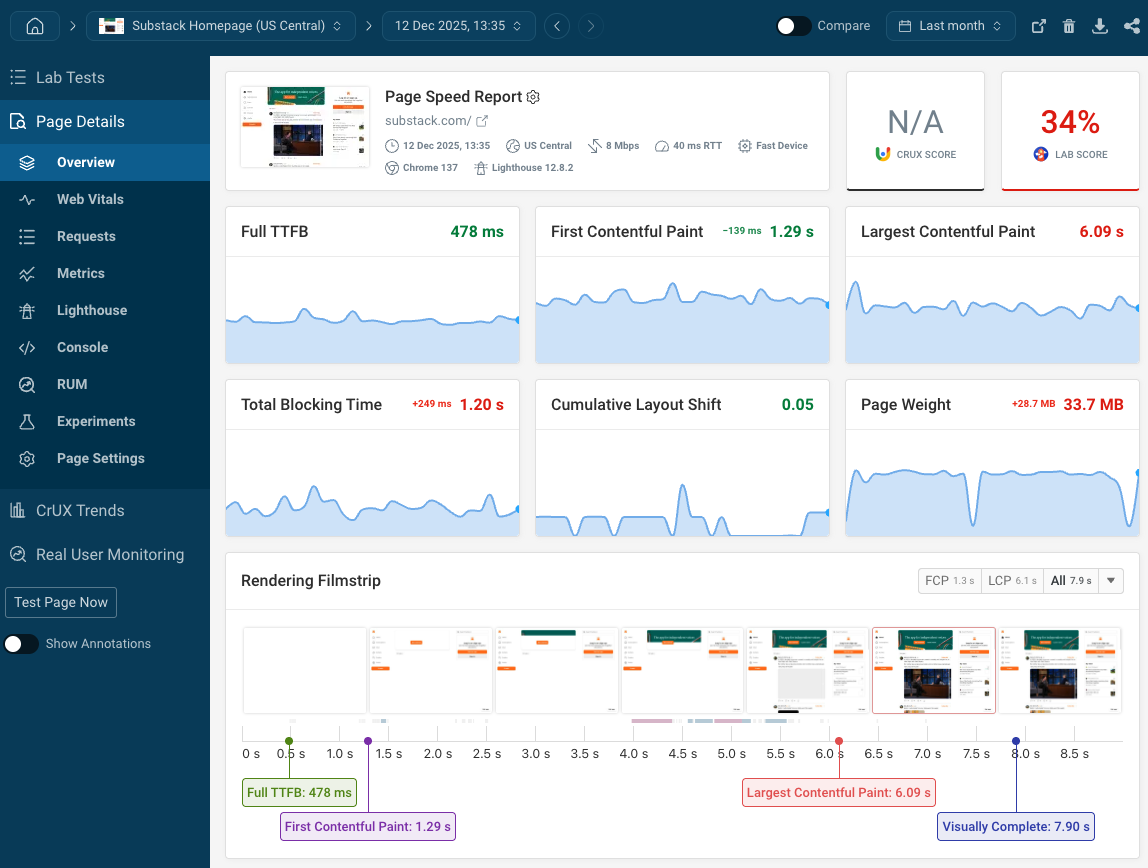
How can website speed be measured?
There are different ways to measure page speed and each data source has its own characteristics:
- Chrome UX Report: High-level metrics provided by Google based on real Chrome user experiences
- Real User Monitoring: collected by website operators using JavaScript
- Synthetic monitoring: one-off tests that open a website and collect measurements
In addition to the Largest Contentful Paint there are also many other website performance metrics that assess different aspects of the loading experience.
How to speed up and monitor your website
If your website is loading slowly you can use a website monitoring tool like DebugBear to keep track of your site speed and identify what optimizations will have the most benefit.
Get detailed insights to improve your website performance and collect real user metrics to optimize visitor experience.


Monitor Page Speed & Core Web Vitals
DebugBear monitoring includes:
- In-depth Page Speed Reports
- Automated Recommendations
- Real User Analytics Data