Synthetic website performance tests measure page load time in a controlled lab environment with a specified network speed.
Since these tests are often run on a computer with a fast network connection, the network needs to be throttled to achieve a consistent result that reflects how visitors with a slower connection would experience the page.
However, there are different ways to throttle the network. This article explains why packet-level throttling is the most reliable option and how it’s different from network throttling in Chrome DevTools or the default settings in Google Lighthouse.
What is packet-level network throttling?
Messages on a computer network are split into individual units called packets. Packet-level throttling applies a delay to each packet as it arrives at or leaves the test environment.
This way applications using the network experience a higher network latency. That includes the browser, so when a page is opened the measurements reflect a slower experience.
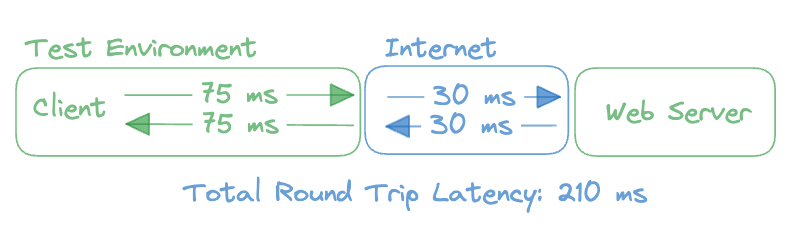
In this example you can see a simulated round trip time of 150 milliseconds. That means a 75 millisecond delay is added to packets leaving the network as well as entering the network.
Any existing latency when connecting to a server on the internet still applies and the extra delay is added on top of that.
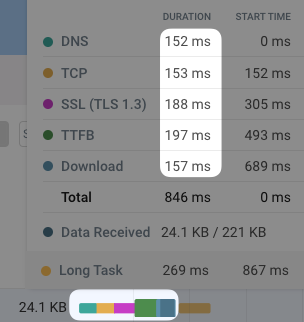
You can see an example of that latency in this request waterfall. Each round trip that’s made as part of the server connection takes at least 150 milliseconds.
Why is packet-level throttling more reliable than DevTools or Lighthouse throttling?
Packet-level throttling is reliable because it realistically applies latency to every packet. That way if extra round trips are needed to establish a connection or because of lost packets this will show up in the results.
Similarly, if fewer round trips are needed, for example because of HTTP/3, this will result in a faster page load time.
In contrast, DevTools throttling just applies a minimum duration to each request. It has no concept of network round trips or server connections so the results will not match what a real user on a high-latency connection would experience.
Lighthouse throttling does consider each round trip on the network, but all data is collected on a fast unthrottled connection. After collecting the data a simulation with higher latency is applied and the collected performance metrics are adjusted accordingly. However, the results of this simulation are not always reliable as Lighthouse can’t fully replicate every network and browser feature.
While simulated throttling is the default for Lighthouse, the throttlingMethod option makes it possible to collect Lighthouse data using packet-level or DevTools throttling as well.
What are the downsides of packet-level throttling?
Packet-level throttling delivers the most accurate page speed data. However, it is more difficult to use than other throttling methods.
First of all, packet-level throttling is applied at the operating system level and applies to your entire computer. In contrast, DevTools throttling can be applied to just a specific Chrome tab.
Making the necessary changes to your computer’s network setup also requires administrative rights and is harder to configure.
The easiest way to test your website with packet-level throttling is to use a free page speed testing tool like DebugBear. PageSpeed Insights does not use packet-level throttling (it uses the Lighthouse simulation).
How to apply packet level throttling
On Mac and Linux you can use the throttle CLI tool to enable system-level throttling.
Open a terminal window and install the tool using npm:
npm install @sitespeed.io/throttle -g
Then enable throttling by passing in a round trip time (RTT) value in milliseconds and upload and download bandwidth limits in kilobits per second.
throttle --rtt 150 --up 1600 --down 1600
Use throttle stop to disable throttling once you're done testing.
Get reliable page speed monitoring data
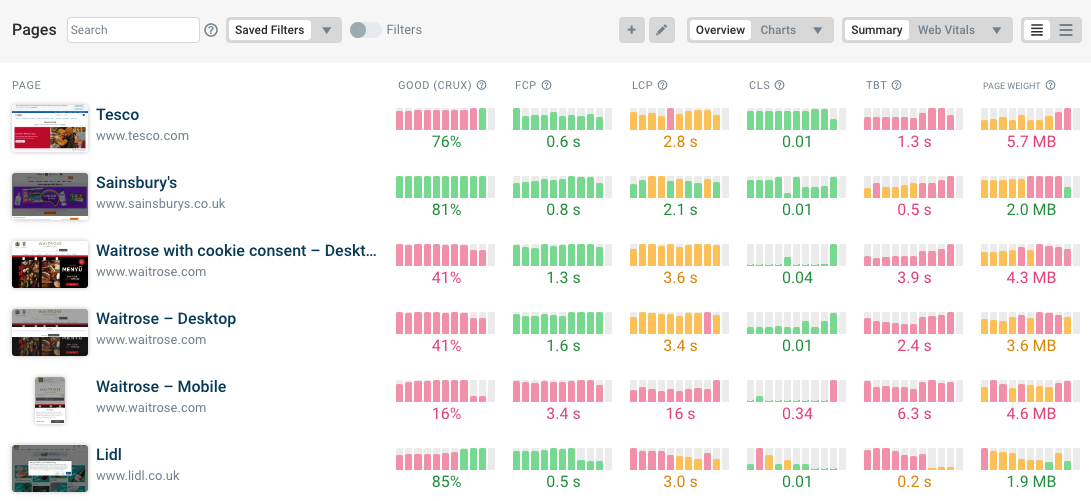
Creating a high-quality environment for page speed tests isn't easy. DebugBear provides a reliable page speed monitoring service that continuously checks your website.
Get detailed performance reports for your website and keep track of page load time, page weight, Google CrUX data, and more.