
Railway companies need to deliver websites that make it easy for travelers to plan their journeys and book tickets. Users may be using a wide range of devices, often on a mobile data connection.
To better understand how these sites perform, we analyzed 25 national train service websites from countries across Europe. We wanted to find out which website delivers the fastest experience and see what separates the fastest train websites from the slowest.
What we analyzed
We checked the Core Web Vitals metrics for each railway company's homepage:
- Largest Contentful Paint (LCP) for page load time
- Interaction to Next Paint (INP) for UI responsiveness
- Cumulative Layout Shift (CLS) for visual stability
Our analysis is based on real-user data collected by Google from Chrome users visiting these sites. This data, known as the Chrome User Experience Report (CrUX), reflects what actual visitors experience.
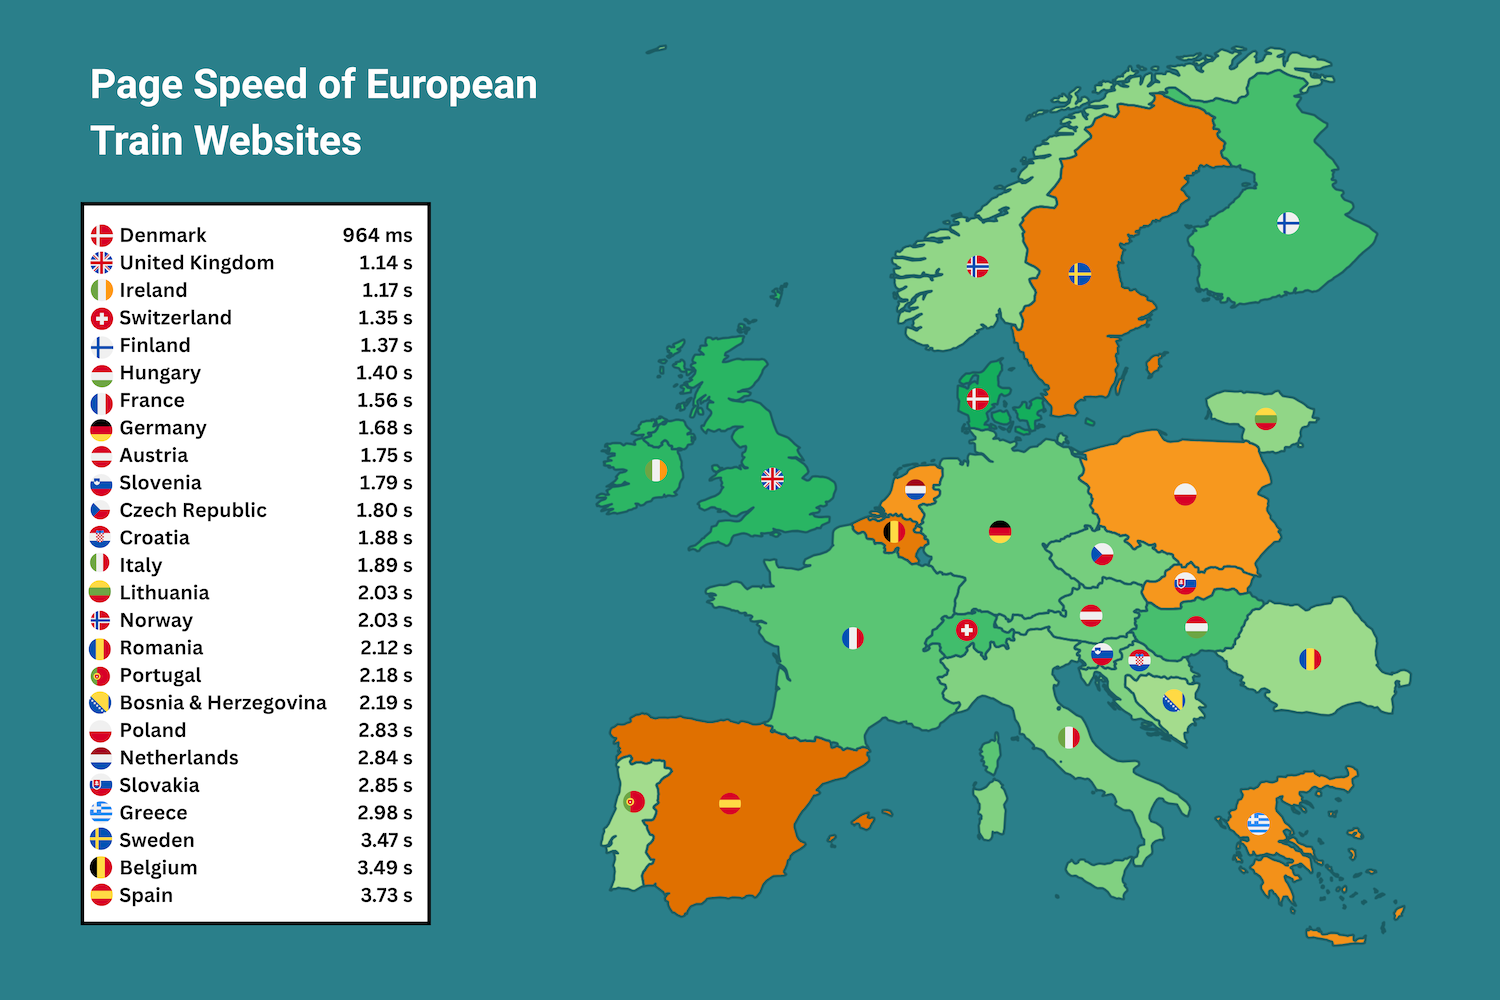
European Railway Website Page Speed Rankings
We ranked all 25 homepages from best performing to worst performing based on their Largest Contentful Paint score. This tells us how fast each website loads.
Denmark's website dsb.dk tops the list and is the only website with an LCP score under 1 second. The UK's nationalrail.co.uk and Ireland's irishrail.ie place just behind to make a respectable top three.
Out of the 25 websites we tested, 18 of the websites placed in the good LCP range of under 2.5 seconds. The remaining 7 websites placed in the needs improvement range of 2.5 to 4 seconds. Spain's renfe.es is in last place, with an LCP score of 3.73 seconds.
Why are Interaction to Next Paint and Cumulative Layout Shift important for these websites?
Although LCP is a good indicator of page load time, the metric doesn’t tell the entire story. That's especially the case when considering the interactions needed to book train journeys or check specific travel information. If we take a look at the CrUX data for all of the Core Web Vitals, including INP and CLS, some of the best performing websites in this ranking have underlying issues which could impact user experience.
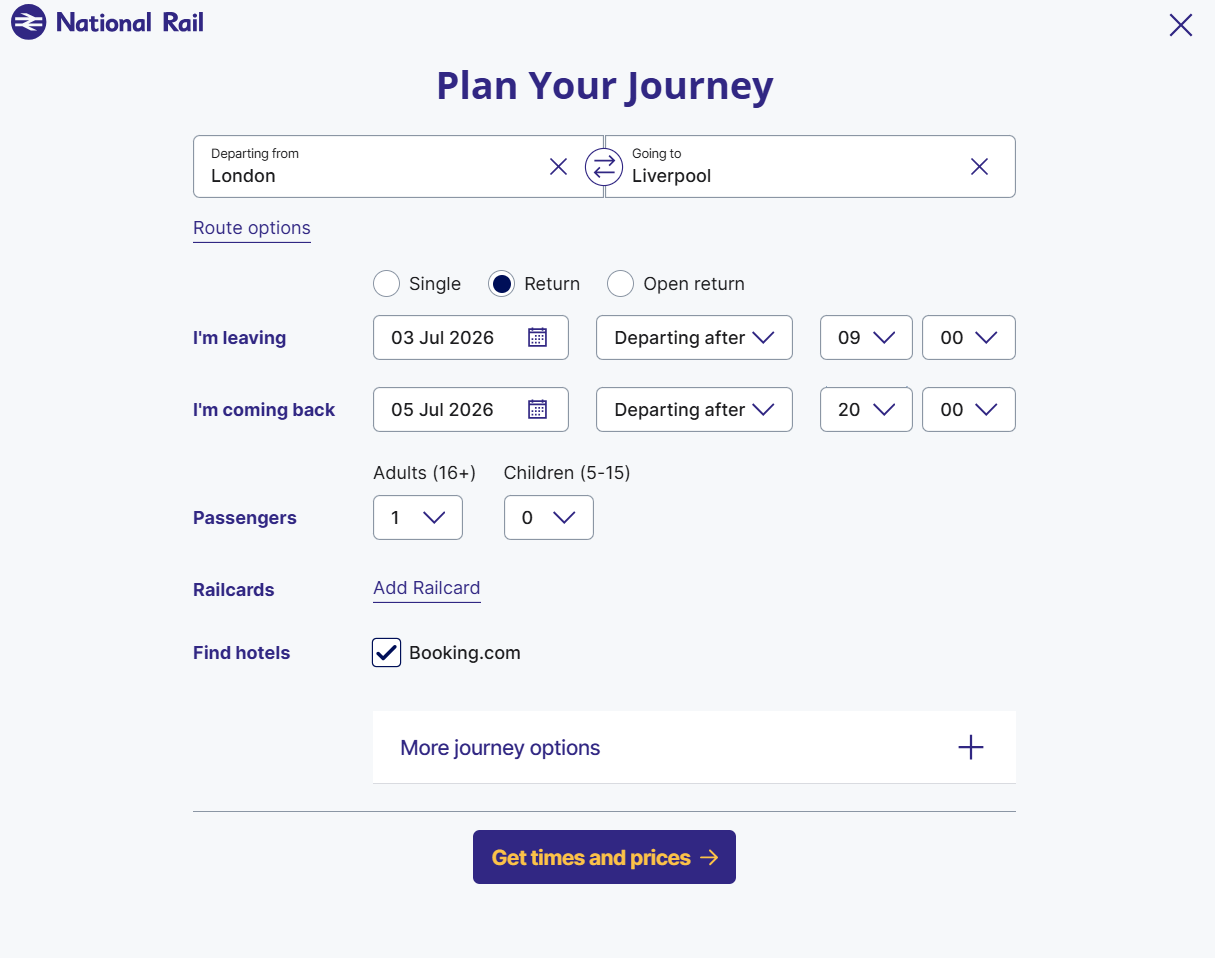
Both INP and CLS are key, as booking a train journey usually requires a lot of steps, including typing in departure and return locations. Selecting journey dates and ticket classes is also typically required.
When testing a user journey with nationalrail.co.uk, 18 interactions were required to reach the final purchase step.
A poor INP score can make these interactions feel sluggish. With so many steps required, it's important to make each interaction as seamless as possible.
In user journeys such as these, CLS also plays a role, as unexpected layout shifts can be equally disruptive. If search results, promotional banners or fare options move while a passenger is entering information or attempting to select a ticket, users may click the wrong element, causing further delays.
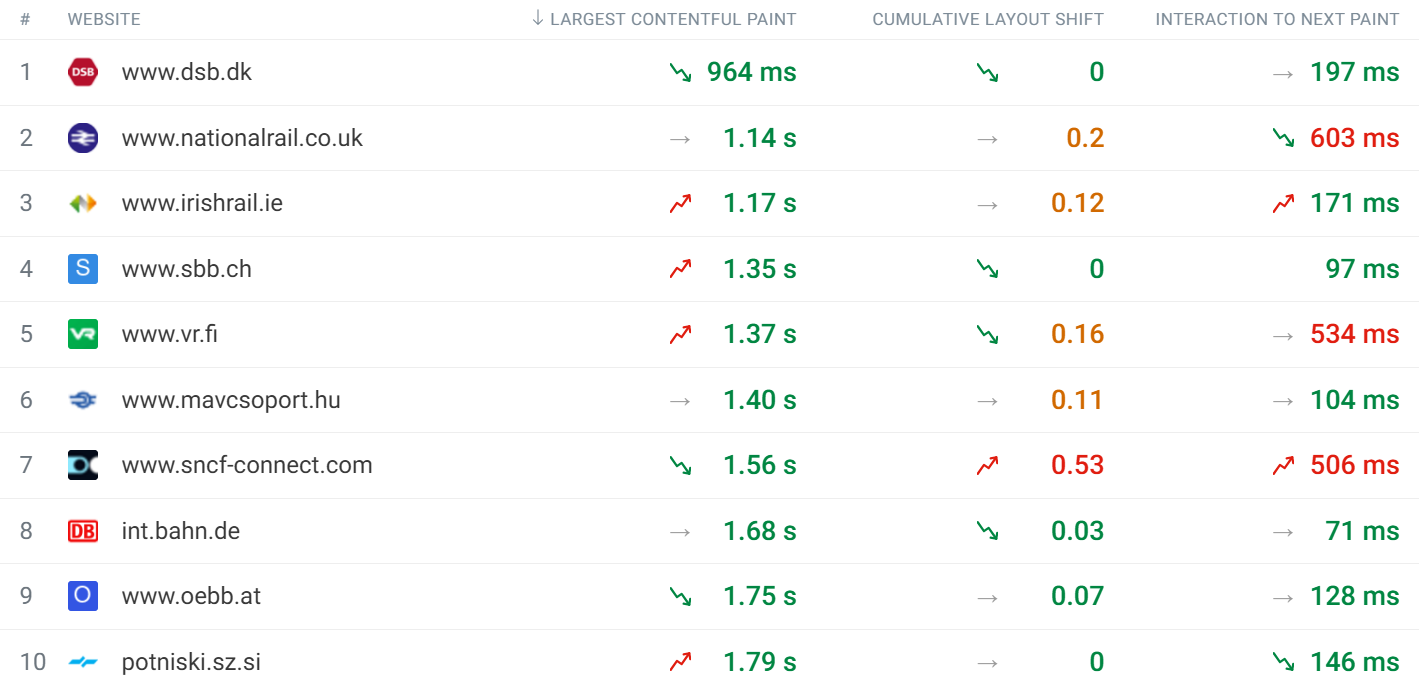
Top 10 European Train Websites
Denmark's dsb.dk continues its LCP success with both CLS and INP scores in the good range. However, some of the other well-performing websites do not have good scores across all of the Core Web Vitals.
Most notably, the UK's nationalrail.co.uk struggles despite placing second in the LCP ranking. It currently has a CLS score of 0.2, which puts it in the needs improvement range. Even more concerning is the INP score of 603 ms. This is one of three websites with INP scores in the poor range of over 500 ms.
Another takeaway from the top 10 chart is Finland's vr.fi, which also has a poor INP score and a severe CLS issue of 0.53, putting it in the poor range for two of the three Core Web Vitals.
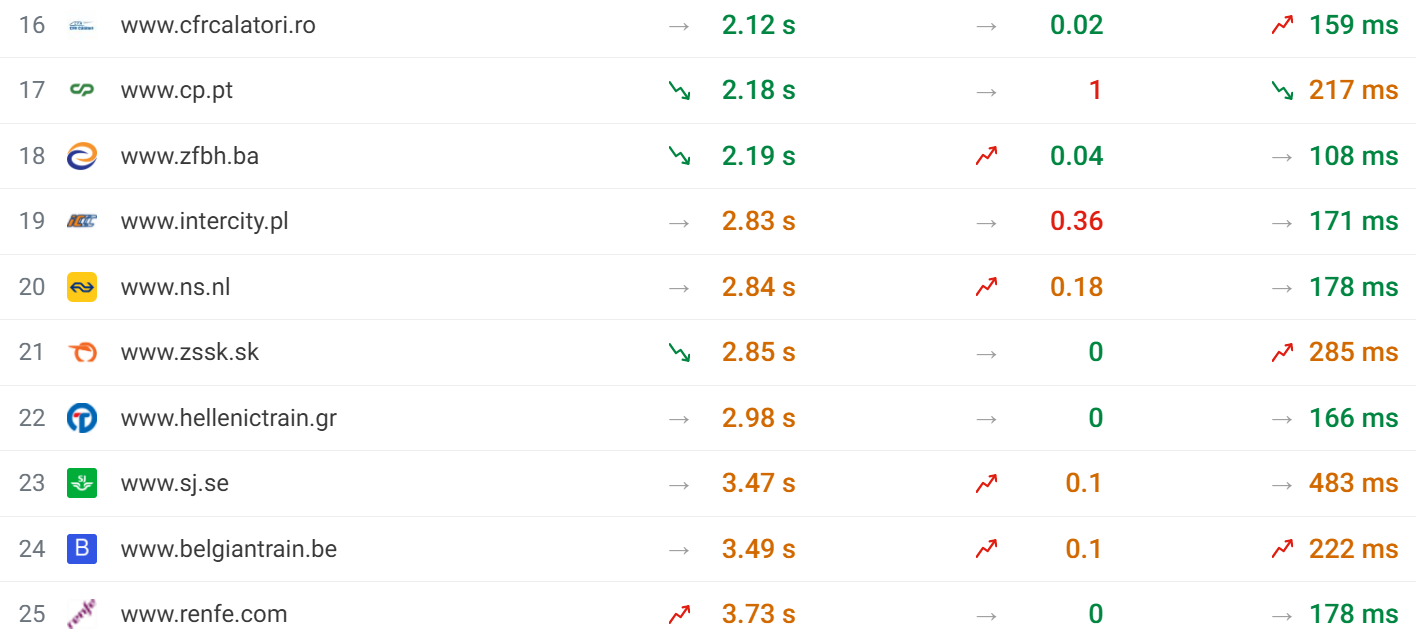
Bottom 10 European Train Websites
The bottom ten websites tell a different story, as expected. Only three websites are in the good range, while the remaining seven land in the needs improvement range. Spain's renfe.es places last with an LCP score of 3.73 seconds.
We can see some CLS issues in the bottom ten, which is a common theme throughout our rankings. Interestingly, none of these websites have very slow user interactions. The worst in this section of the ranking is Sweden's sj.se with an INP score of 483 ms, just below the threshold for poor performance.
Why does Denmark have the fastest website?
Denmark's dsb.dk landed first in our ranking with an LCP score of 964 ms. This easily places the website inside the good range.
This huge buffer comes down to their CrUX Time To First Byte (TTFB) score of 349 ms. TTFB measures how quickly the server responds to a request, and a fast TTFB gives the browser a head start on loading the rest of the page.
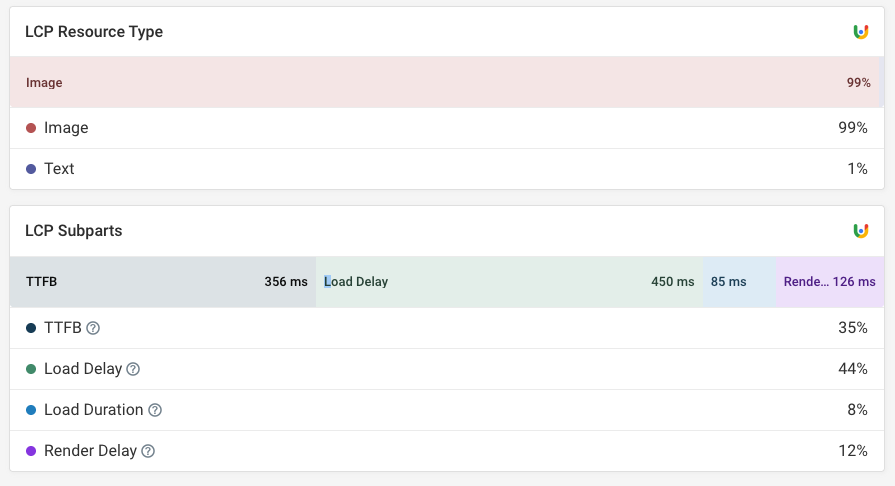
For 99% of visitors, the LCP element is an image, making their LCP score even more impressive. Pages optimized for a good LCP score typically prioritize text above the fold instead, like we saw with gov.uk in our Government Benchmarks analysis.
You can find this data for your own website by running a free website speed test.
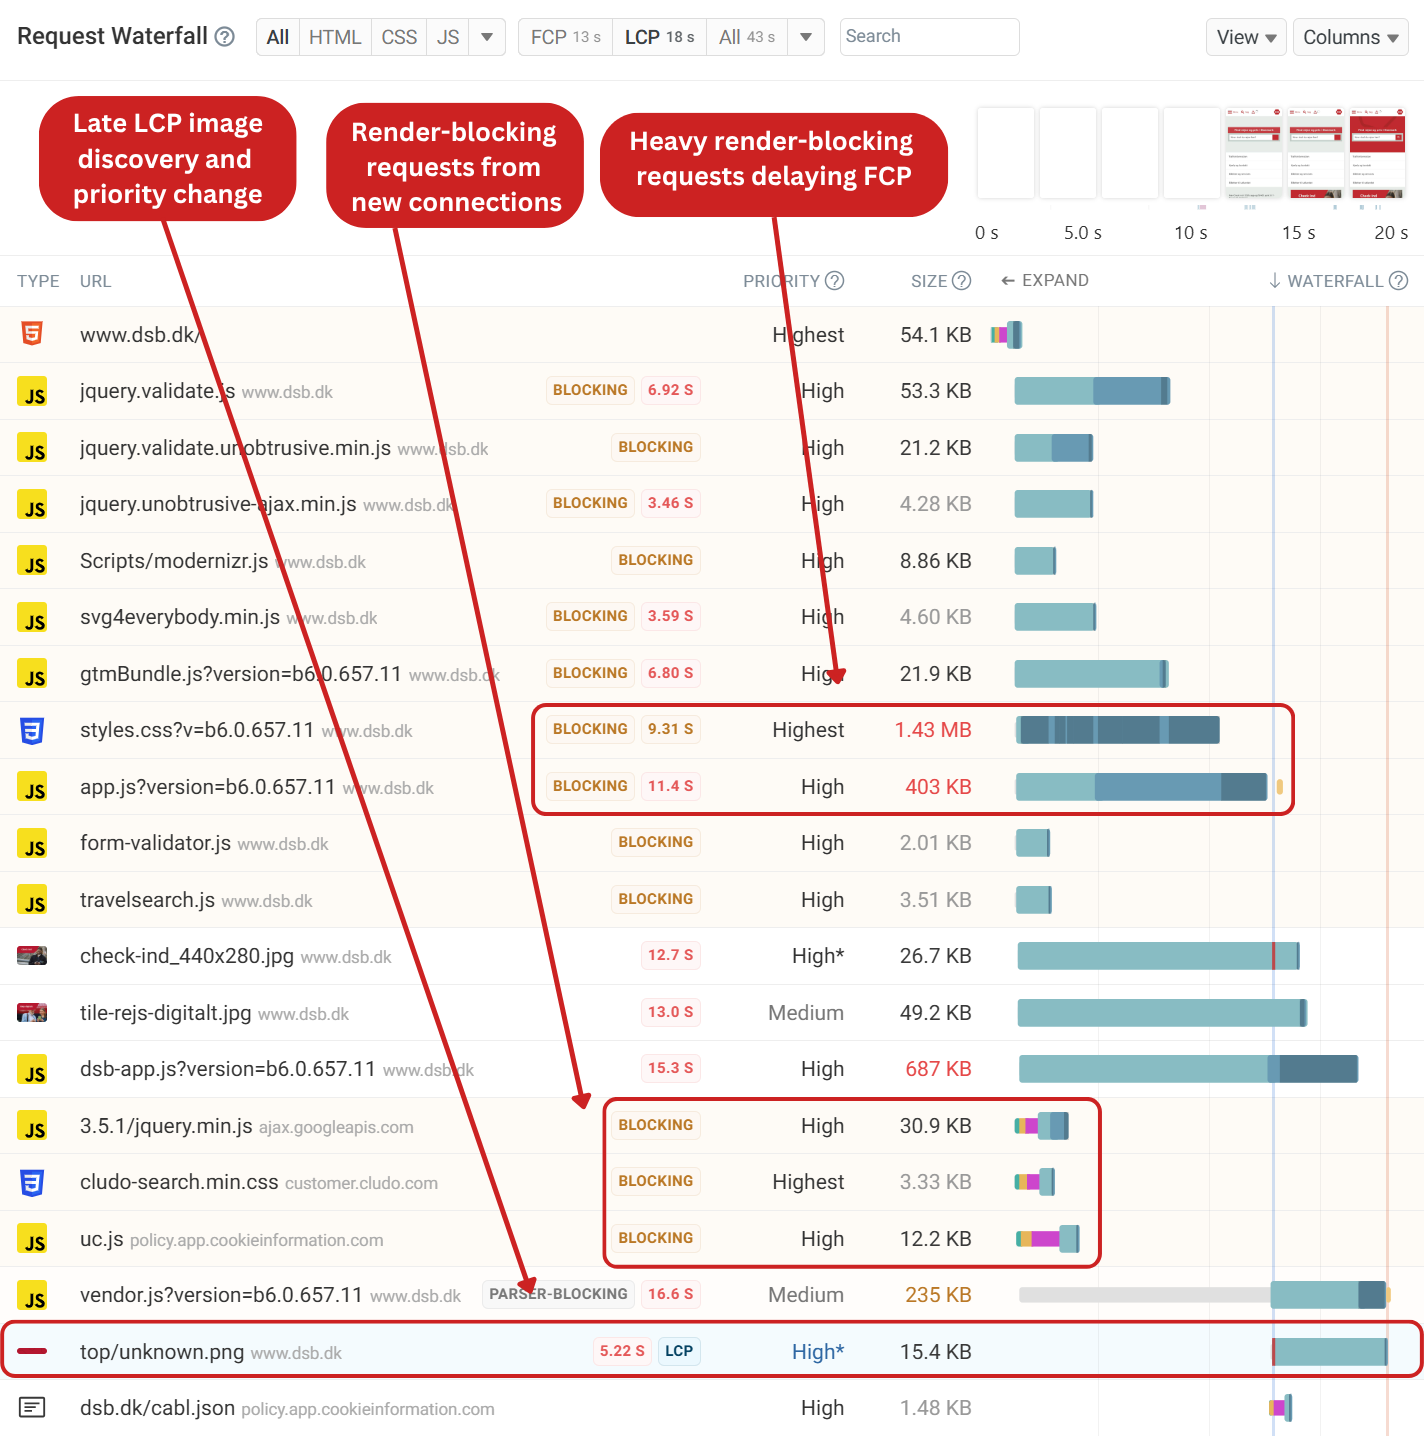
Surprisingly, when inspecting the request waterfall in our lab test, the page itself is not well optimized. A large render-blocking CSS file and a heavy render-blocking script delay the First Contentful Paint (FCP).
Because the LCP element is a background image the browser only starts loading it once the page has started rendering. This causes a relatively large load delay component.
Reducing the render-blocking script sizes and deferring non-critical scripts would allow the browser to render content sooner while still loading the scripts in the background. The LCP image could be preloaded with fetchpriority="high" to ensure that the request completes much sooner and can be rendered as soon as the render-blocking requests have completed.
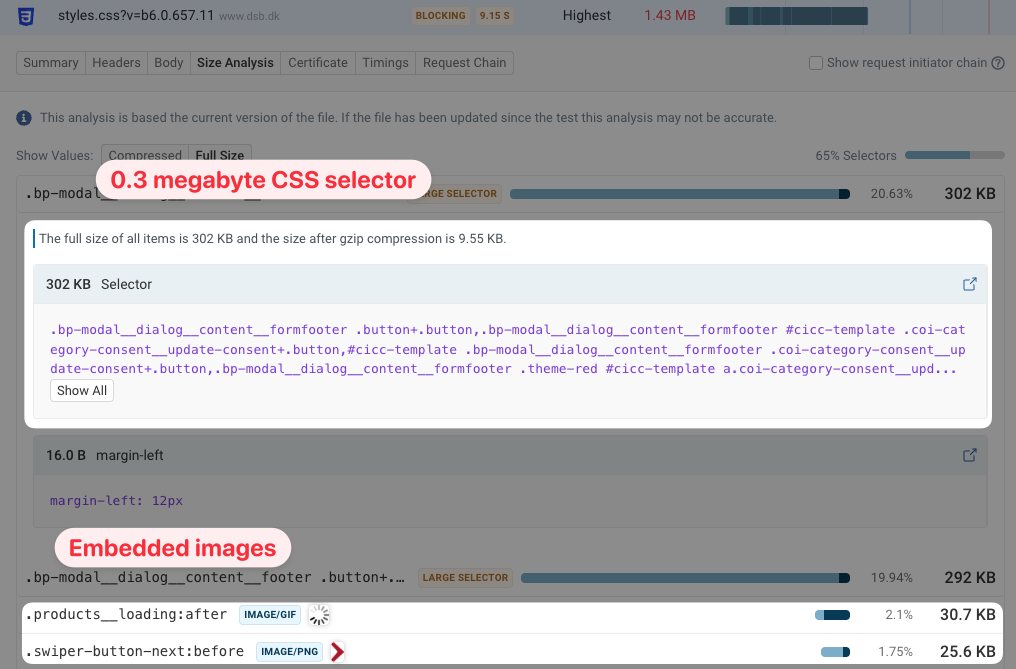
We were also curious about the 1.4 megabyte CSS file. What makes it so large? There are three factors:
- The server does not use HTTP compression
- Two CSS selectors are several hundred thousand characters long
- The CSS file contains embedded Base64 images
Why is the site fast despite the poor test result?
While our test showed that the page isn't well-optimized, real users mostly don't seem to be impacted. Visitors only wait more than 4 seconds for the page to load 3% of the time. What causes the difference in the data?
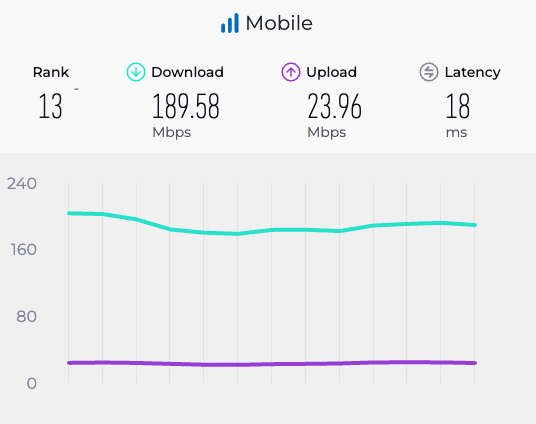
When testing a website with Lighthouse, a throttled network connection is used to simulate a mobile device. Lighthouse tests the site with 1.6 Mbps of bandwidth, which is much slower than the average mobile connection in Denmark.
However, Speedtest reports a mobile download speed of 189 Mbps in Denmark, 118 times faster than the Lighthouse test. So while the synthetic test is impacted by the large render-blocking downloads, real users are much less impacted.
Visitors may also have cached some of the website resources already, again leading to better performance.
Why does Spain have the slowest website?
Spain's renfe.es places at the bottom of our LCP CrUX ranking with a score of 3.73 seconds. There are several reasons why this is the case according to the data.
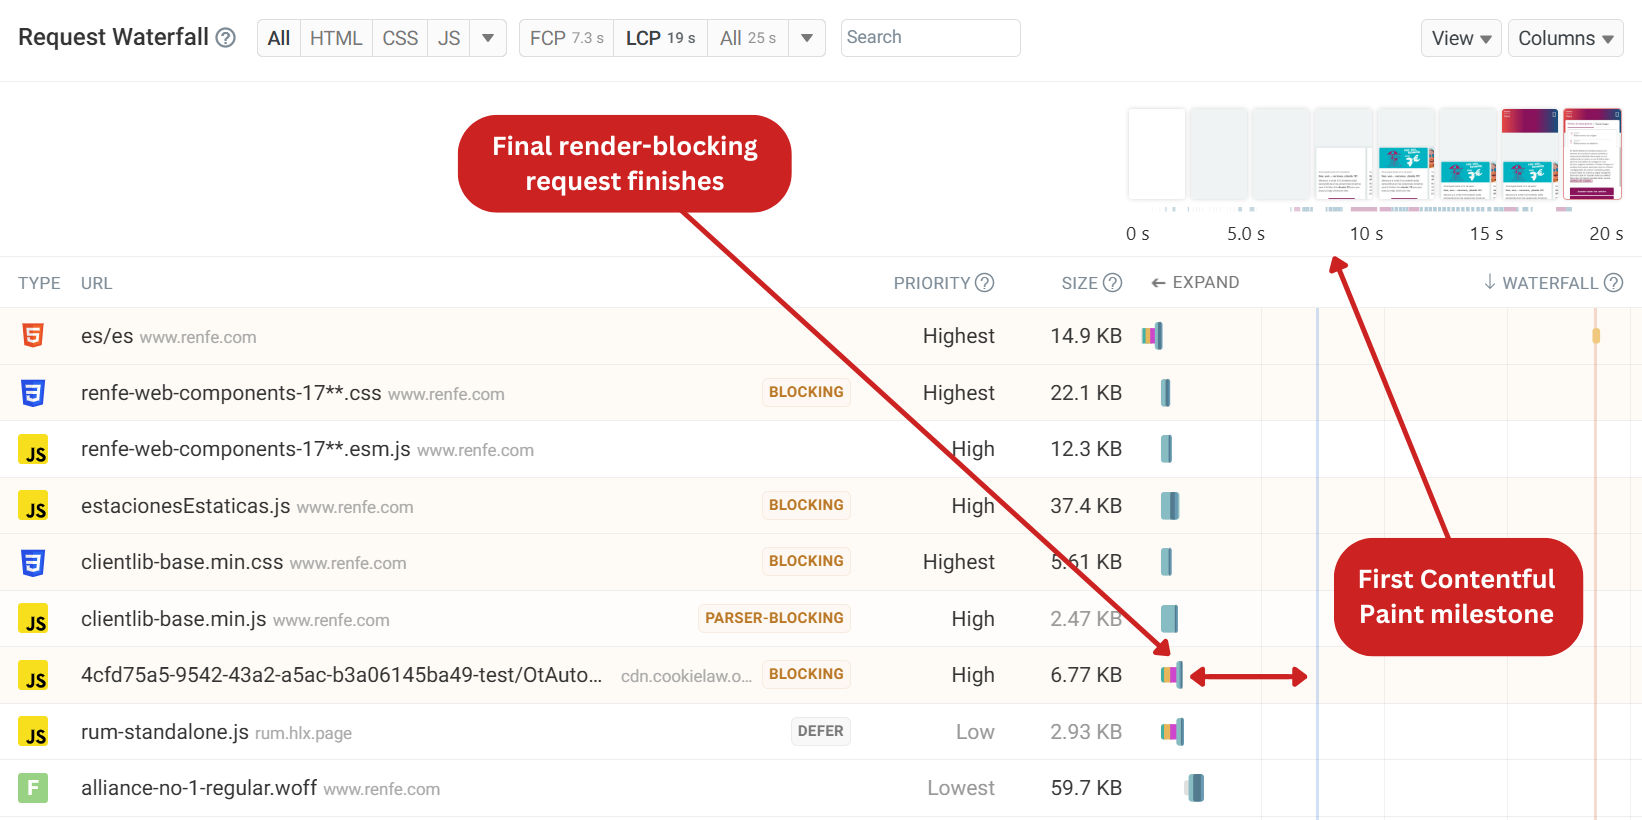
The initial server response takes just 505 ms, setting up the page for success. However, the first setback is that the site purposely hides content through CSS until later in the page load.
Looking at the request waterfall, we can see there are a few render-blocking scripts which finish at 1.6 seconds. Usually this would result in a good FCP score of 1.75 seconds. Content on the page is then hidden until 4.53 seconds, and is further delayed by long CPU tasks.
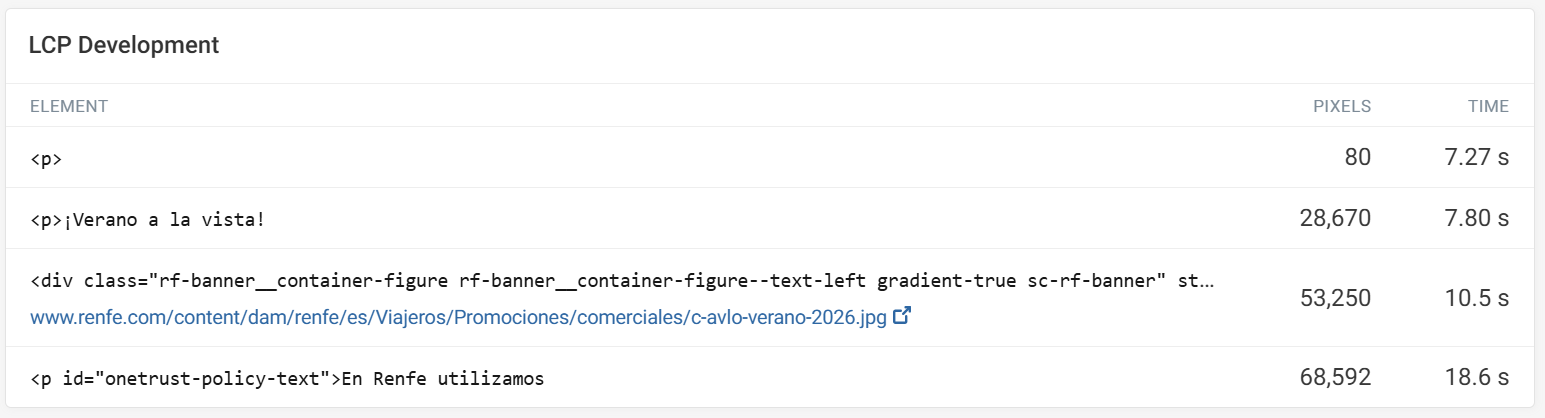
In our lab test, we can see the LCP development which tells us another story. As larger elements render on the page, new LCP elements are identified. The issue in this specific test is the OneTrust cookie banner which renders at 18.6 seconds. This script is loaded asynchronously, delaying the LCP milestone. The CrUX data shows an 80/20 split between the LCP element being an image or text. We can assume that the late appearance of the banner is inflating the LCP CrUX score on average.
These issues can be easily fixed. Since TTFB is already in the good range and there are only a few render-blocking requests, renfe.es should rethink hiding the page's content with CSS, then remove the async attribute from the cookie banner so that the banner renders on the page sooner.
Why do some of the best performing websites have poor INP?
Previously, we picked out three websites in our top ten ranking that suffered poor INP. Let's take a look at nationalrail.co.uk and vr.fi to see what's causing slow interactions for these websites specifically.
National Rail (UK)
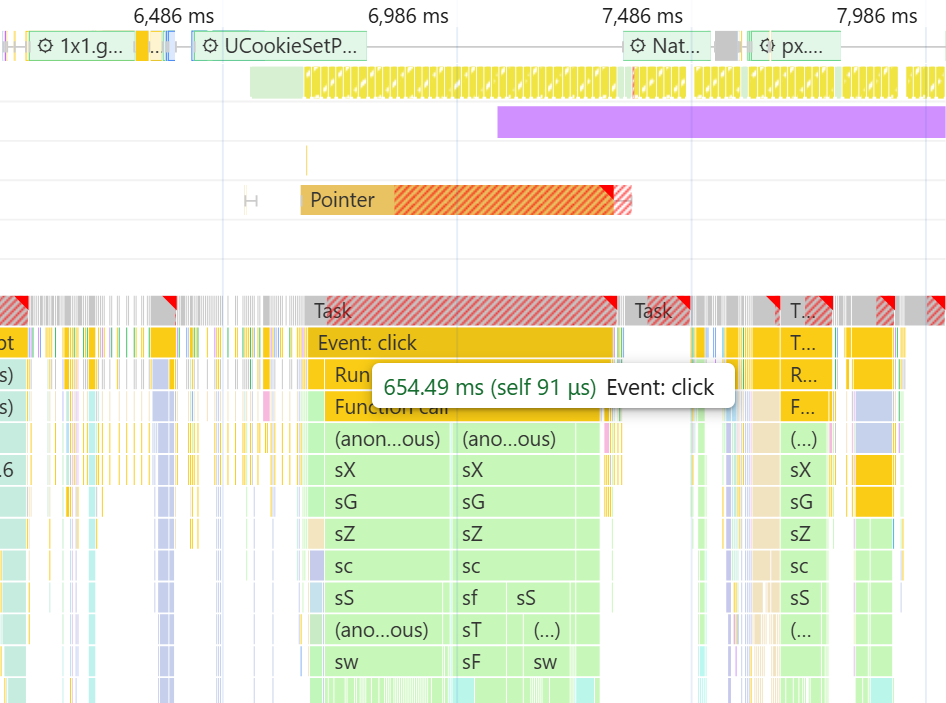
National Rail had an INP score of 603 ms in our ranking, despite having the second-best LCP score.
When testing an interaction, there was minimal Input Delay of 17 ms. The issue mainly comes from a Processing Time of 654 ms. A single click causes React to re-render a large part of the application. This creates a noticeable delay, especially on slower mobile devices. To improve responsiveness, National Rail should avoid these unnecessary re-renders.
VR (Finland)
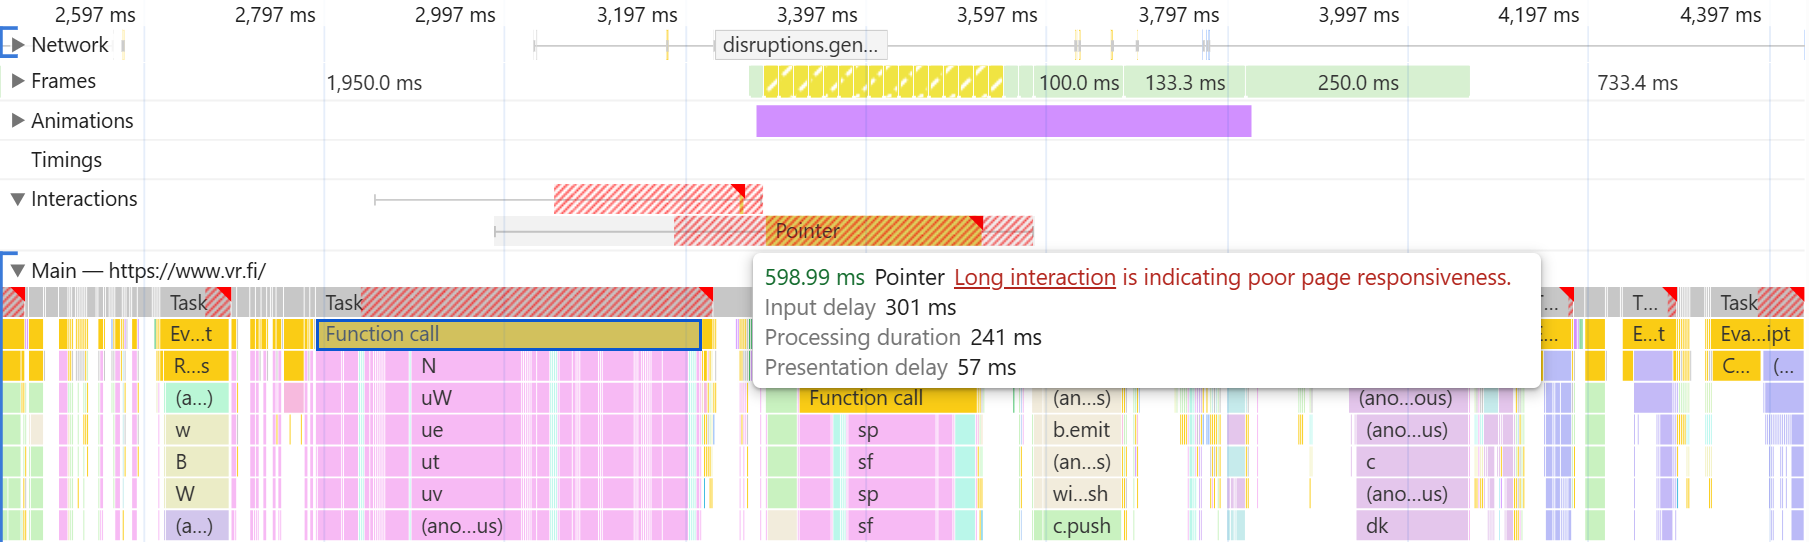
VR had the second-worst INP CrUX score in our ranking, at 534 ms. When investigating the issue, we found significant Input Delay of 304 ms due to a long task already running before the interaction took place. Processing the interaction then took 241 milliseconds, which was due to React re-rendering components of the page. There was also a Google Tag Manager script which caused further delays.
The most significant improvement would be to tackle the Input Delay by breaking up long tasks that could occur when the visitor interacts with the page.
Conclusion
Denmark's dsb.dk stands out as the clear winner, delivering strong performance across all three Core Web Vitals. However, our list shows that fast load times alone don't guarantee a good user experience. Many of the websites struggle with INP and CLS issues, which could frustrate visitors as they are booking tickets.
The good news is that most of these issues are fixable. Often a few requests have a big impact on overall page speed. JavaScript apps can be optimized to avoid unnecessary rendering work following an interaction.
To test your website, try our free website speed test or start monitoring your Core Web Vitals with a 14-day free trial.


Monitor Page Speed & Core Web Vitals
DebugBear monitoring includes:
- In-depth Page Speed Reports
- Automated Recommendations
- Real User Analytics Data