We've launched a free INP debugger, added a RUM Core Web Vitals map, and added website favicons to make it easier to find your projects.
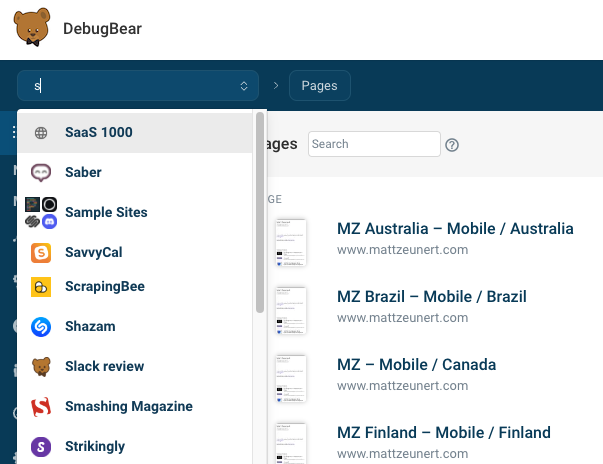
Icons for the project dropdown
We've updated the project selector to make it easier to find the right project for the different sites you're monitoring.
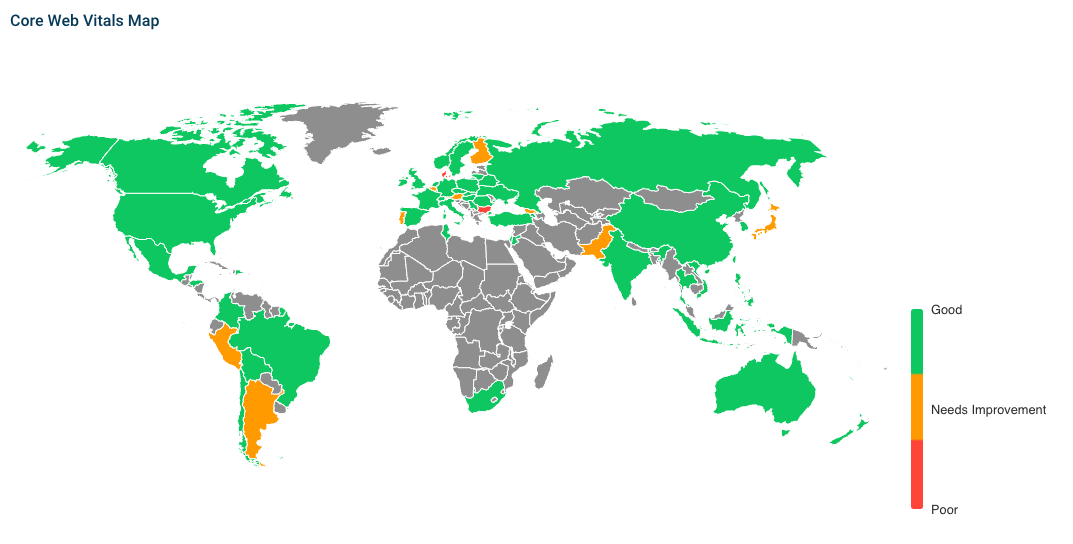
RUM Core Web Vitals map
Our real user monitoring feature now shows what countries you meet the Core Web Vitals in and where you need to optimize.
Updates to the Good (CrUX) metric
The Good (CrUX) metric tells you what percentage of user experiences are good across all three Core Web Vitals metrics. Google has announced that Interaction to Next Paint (INP) will replace First Input Delay as a Core Web Vitals metric next year.
We've updated the Good (CrUX) metric to consider INP instead of FID. To view the old score, check out the Good (CrUX, Legacy) metric.
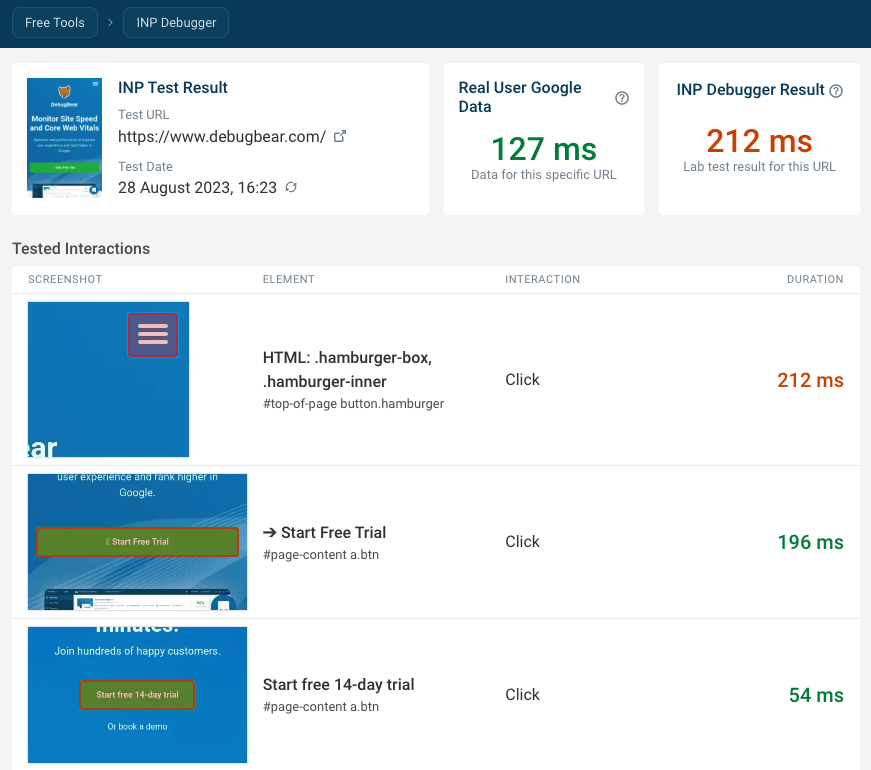
Free Tool: Debug Interaction to Next Paint
INP is hard to measure as it relies on user interactions on the page. To help you identify INP issues we've published the INP Debugger which automatically interacts with page elements and measures the interaction delay.
New articles and videos
- DebugBear Real User Monitoring (RUM) demo – learn more about collecting field data with DebugBear
- How To Use A CDN To Improve Web Performance – learn how CDNs can help speed up your website and how to set up Cloudflare
- What Are Google Page Experience Signals? – a look at the group of Google ranking signals that includes the Core Web Vitals metrics