Compare metrics across date ranges, re-run experiments, and save frequently used page and RUM filters.
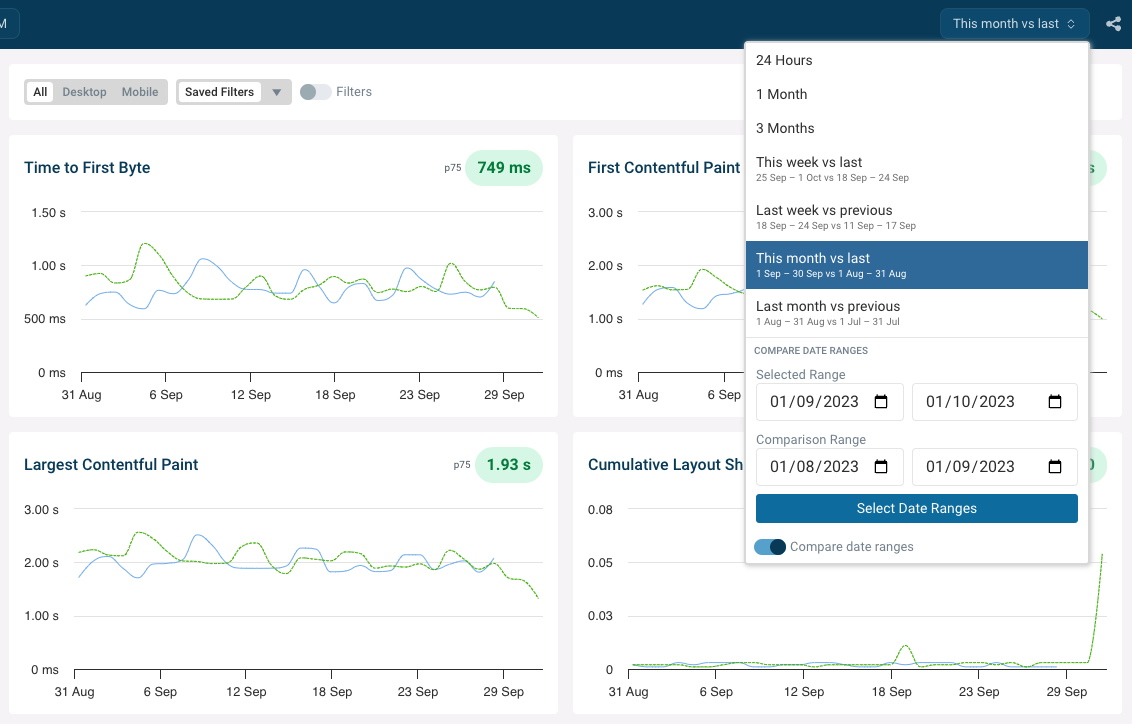
Compare RUM trends across time ranges
You can now select two date ranges and compare then when viewing your RUM metrics.
Over the coming months we're planning to add this functionality across all of our charts.
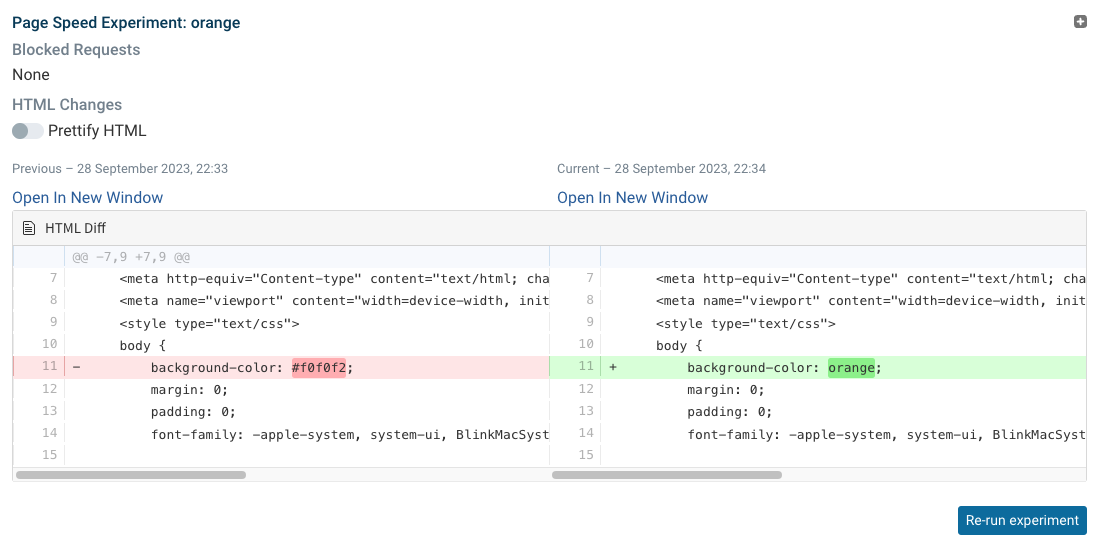
Re-run experiments
Experiments let you try out page speed optimizations before deploying any changes to your website. You can now re-run experiments or tweak the optimizations you've made.
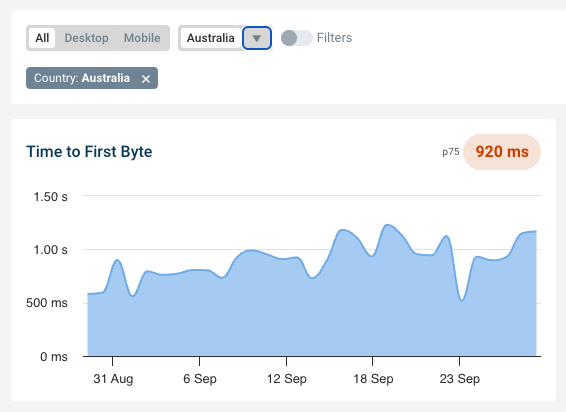
Saved filters
The saved filters feature makes it easy to create groups for of RUM page views or lab pages. Unlike when using tags any newly added pages are automatically included.
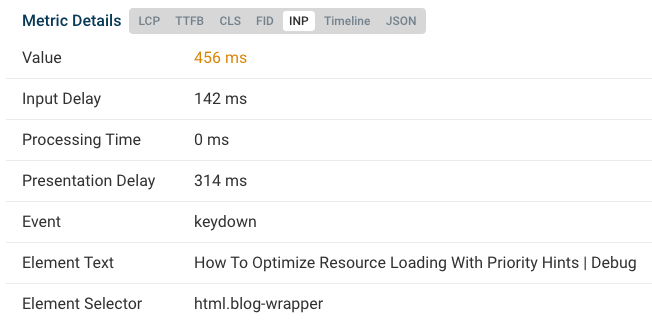
Interaction to Next Paint breakdown
DebugBear RUM now reports the three components of the Interaction to Next Paint metric:
- Input Delay
- Processing Time
- Presentation Delay
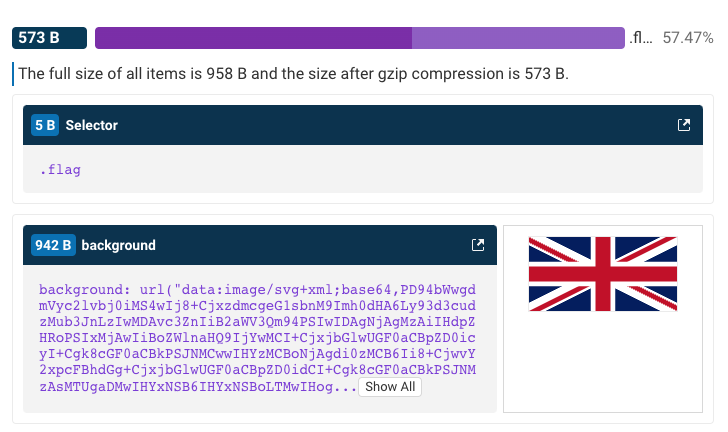
Analyze CSS Size
We've launched a new free tool, the [CSS Size Analyzer]. It lets you breakdown large CSS downloads and identify bloat like long selectors or embedded images.
New articles
We've published two new Lighthouse-related articles:
- How To Test Page Speed With Google Lighthouse – learn how to run Lighthouse in various contexts and how the results are different
- Improving Your Lighthouse SEO Score – a look at the different audits making up the Lighthouse SEO score
We've also uploads a new Youtube shorts video on lab vs field data!