How To Track CPU Processing Time With RUM
CPU processing time has a big impact on web performance, in particular the Largest Contentful Paint and Interaction to Next Paint metrics.
DebugBear real user monitoring data can help you identify what CPU tasks impact visitor experience on your website.
View how CPU tasks impact Largest Contentful Paint
Long JavaScript tasks that run before the Largest Contentful Paint rendering milestone delay rendering important page content or loading additional page resources required to display the main content element.
This example from a lab test result shows CPU tasks along with the rendering filmstrip:
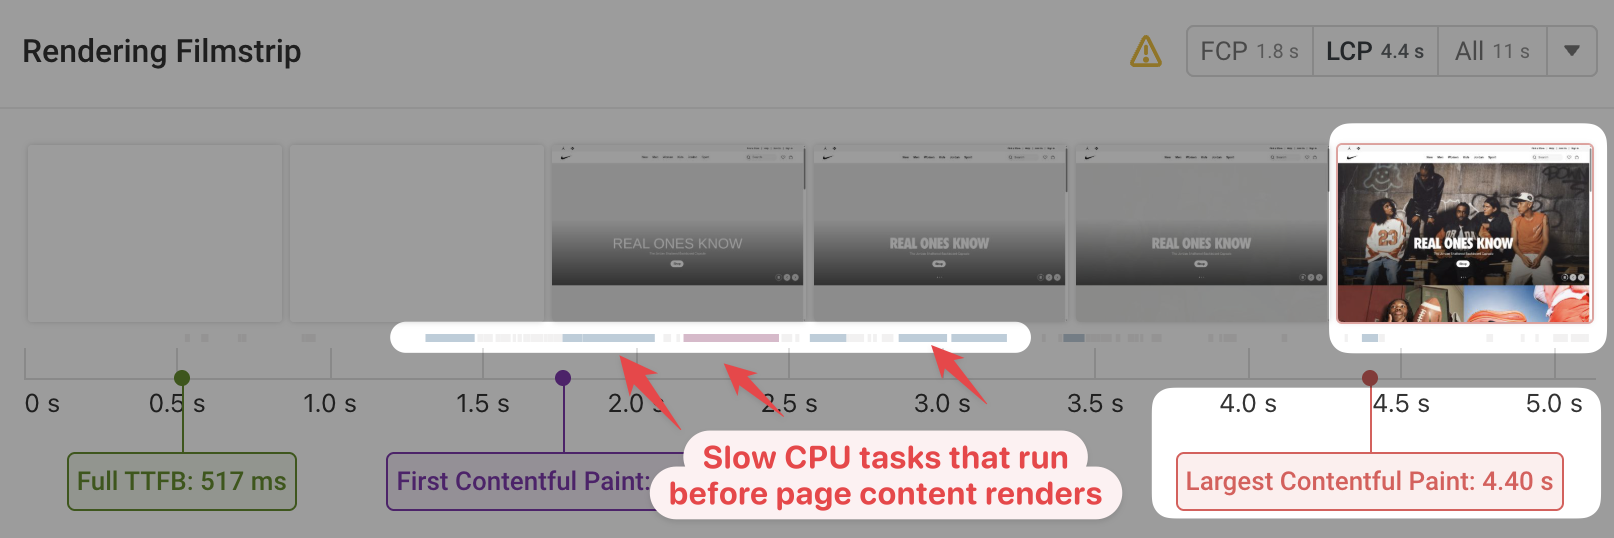
We can't collect rendering snapshots for real user visits, but it is possible to collect CPU task data with the Long Animation Frames API.
When you view visit details on DebugBear you can switch to the LCP tab to get a list of scripts that ran on the page. On top of the request waterfall you can also see indicators of long scripting or rendering tasks running at each point.
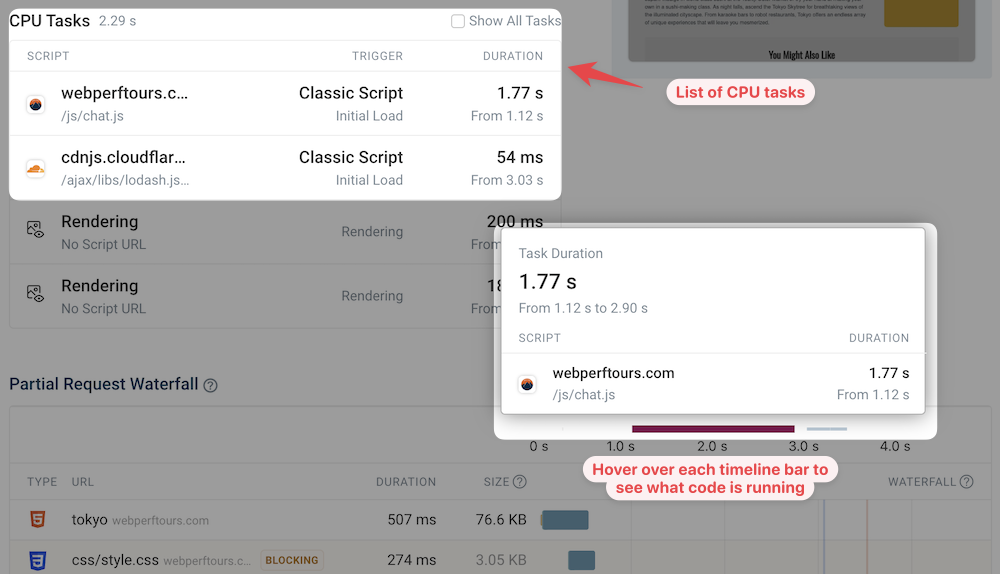
DebugBear collects CPU tasks that run prior to the Largest Contentful Paint. When there are many CPU tasks, only the longest ones are collected.
Aggregated LCP Script data
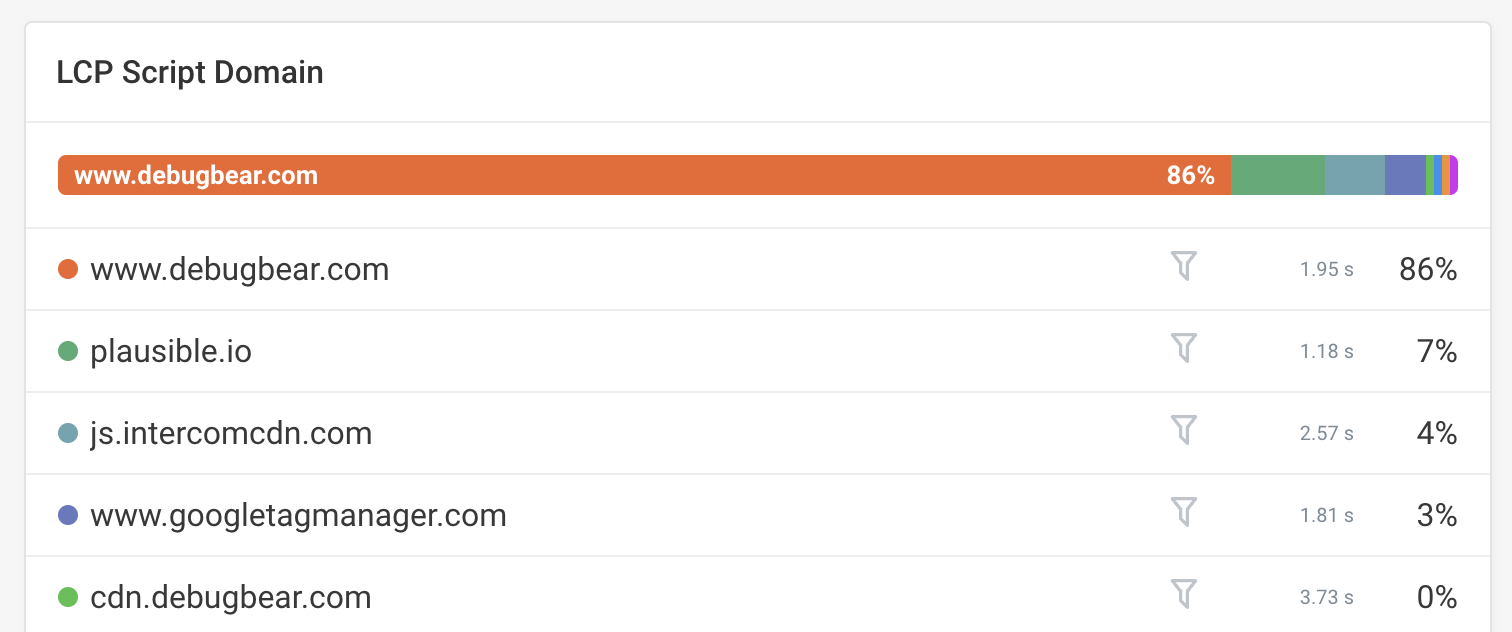
On top of viewing all tasks for an individual page view you can also view how often different scripts have the largest overall contribution to LCP CPU delays.
You can see a breakdown of this data on the LCP Overview tab.
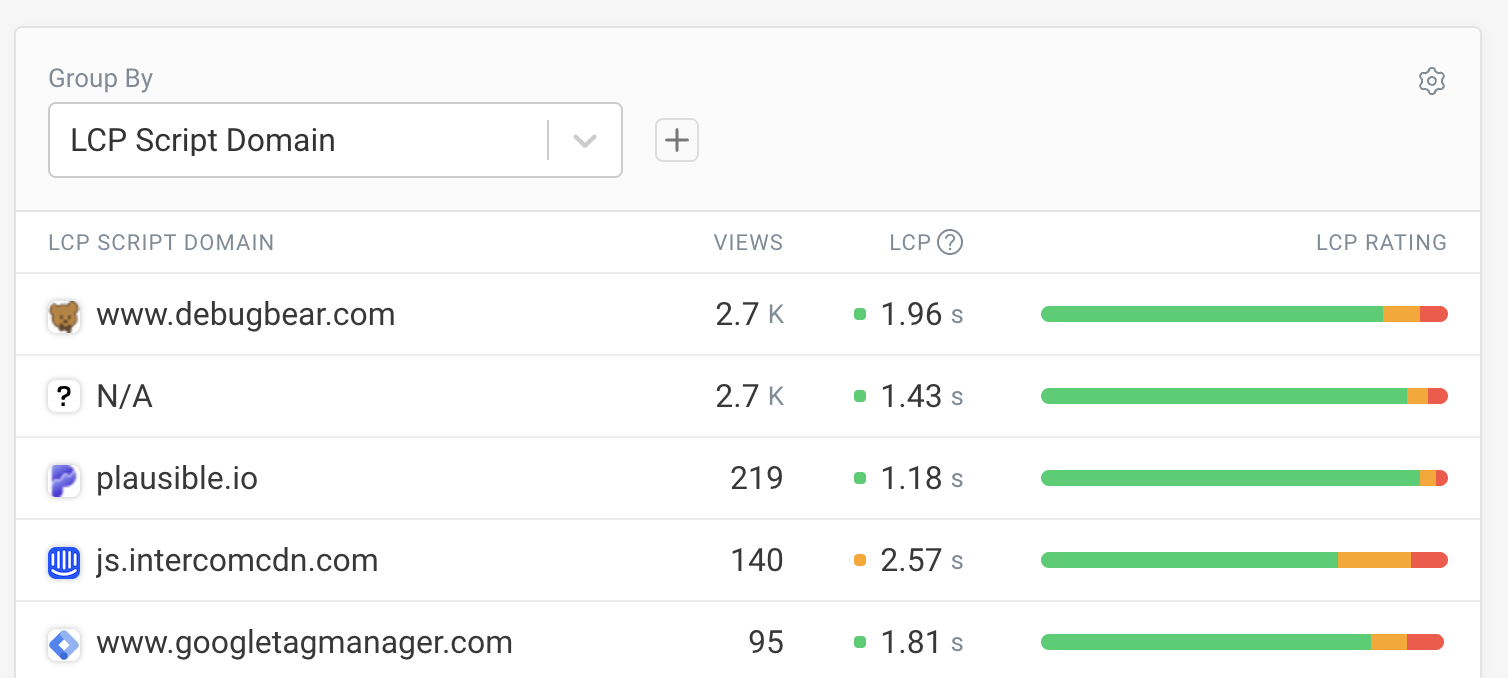
There are also two page view properties you can group by in the Table tab:
- LCP Script: the full URL of the longest script
- LCP Script Domain: the domain name of the longest script
LCP Processing Time
DebugBear also provides a dashboard showing an estimate of main thread task time before the LCP. You can find this metric on the LCP dashboard or view the dedicated LCP Processing Time dashboard.
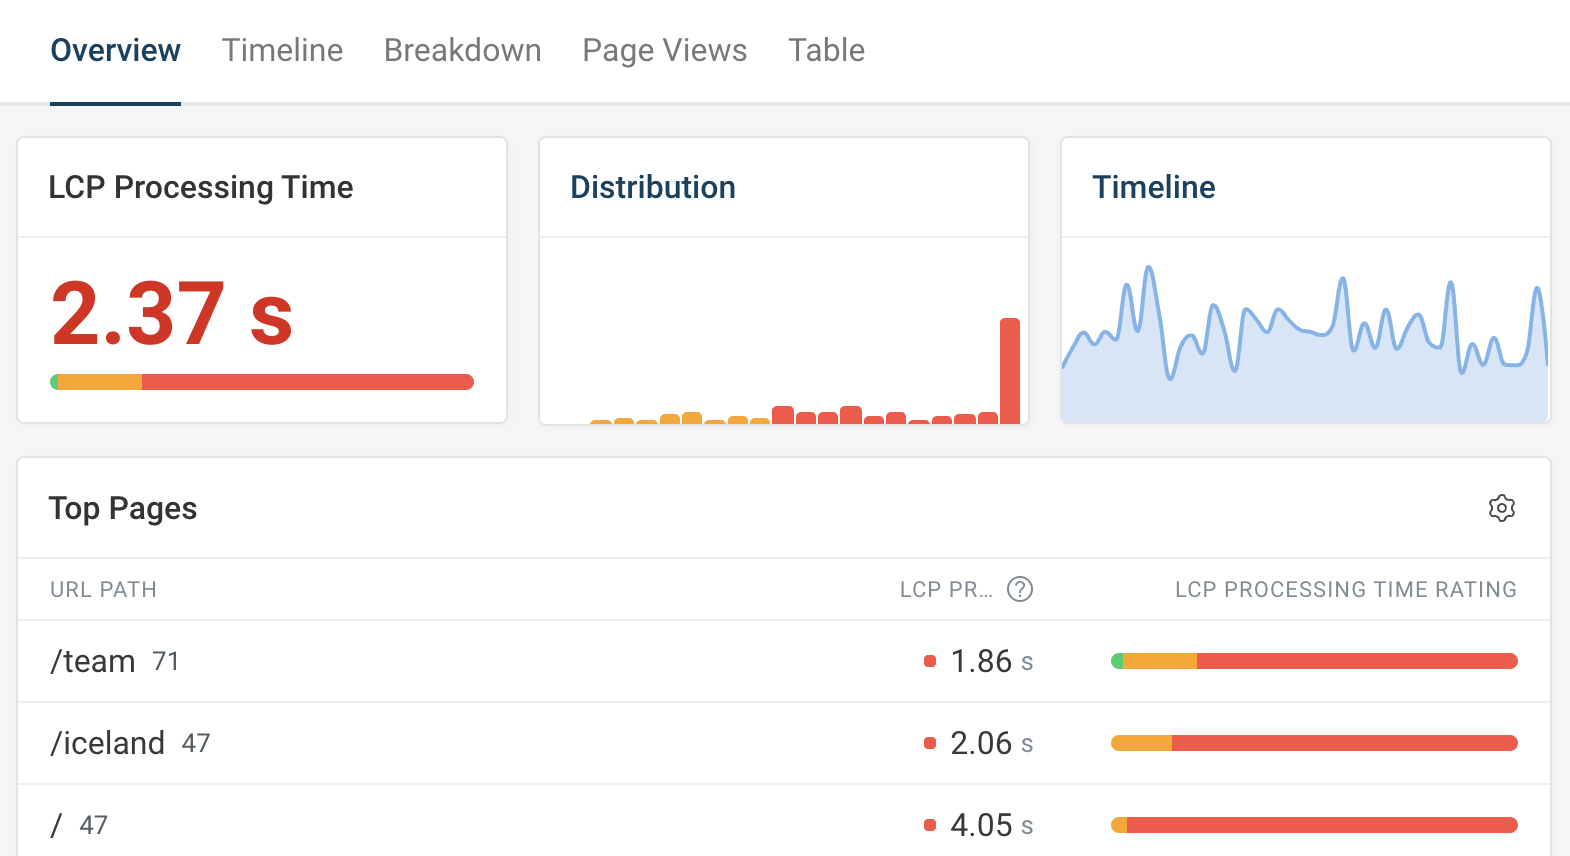
How this value is calculated
Browser APIs don't provide full main thread task reporting. The LCP Processing time provides a lower bound on CPU task time, counting reported scripts and rendering tasks.
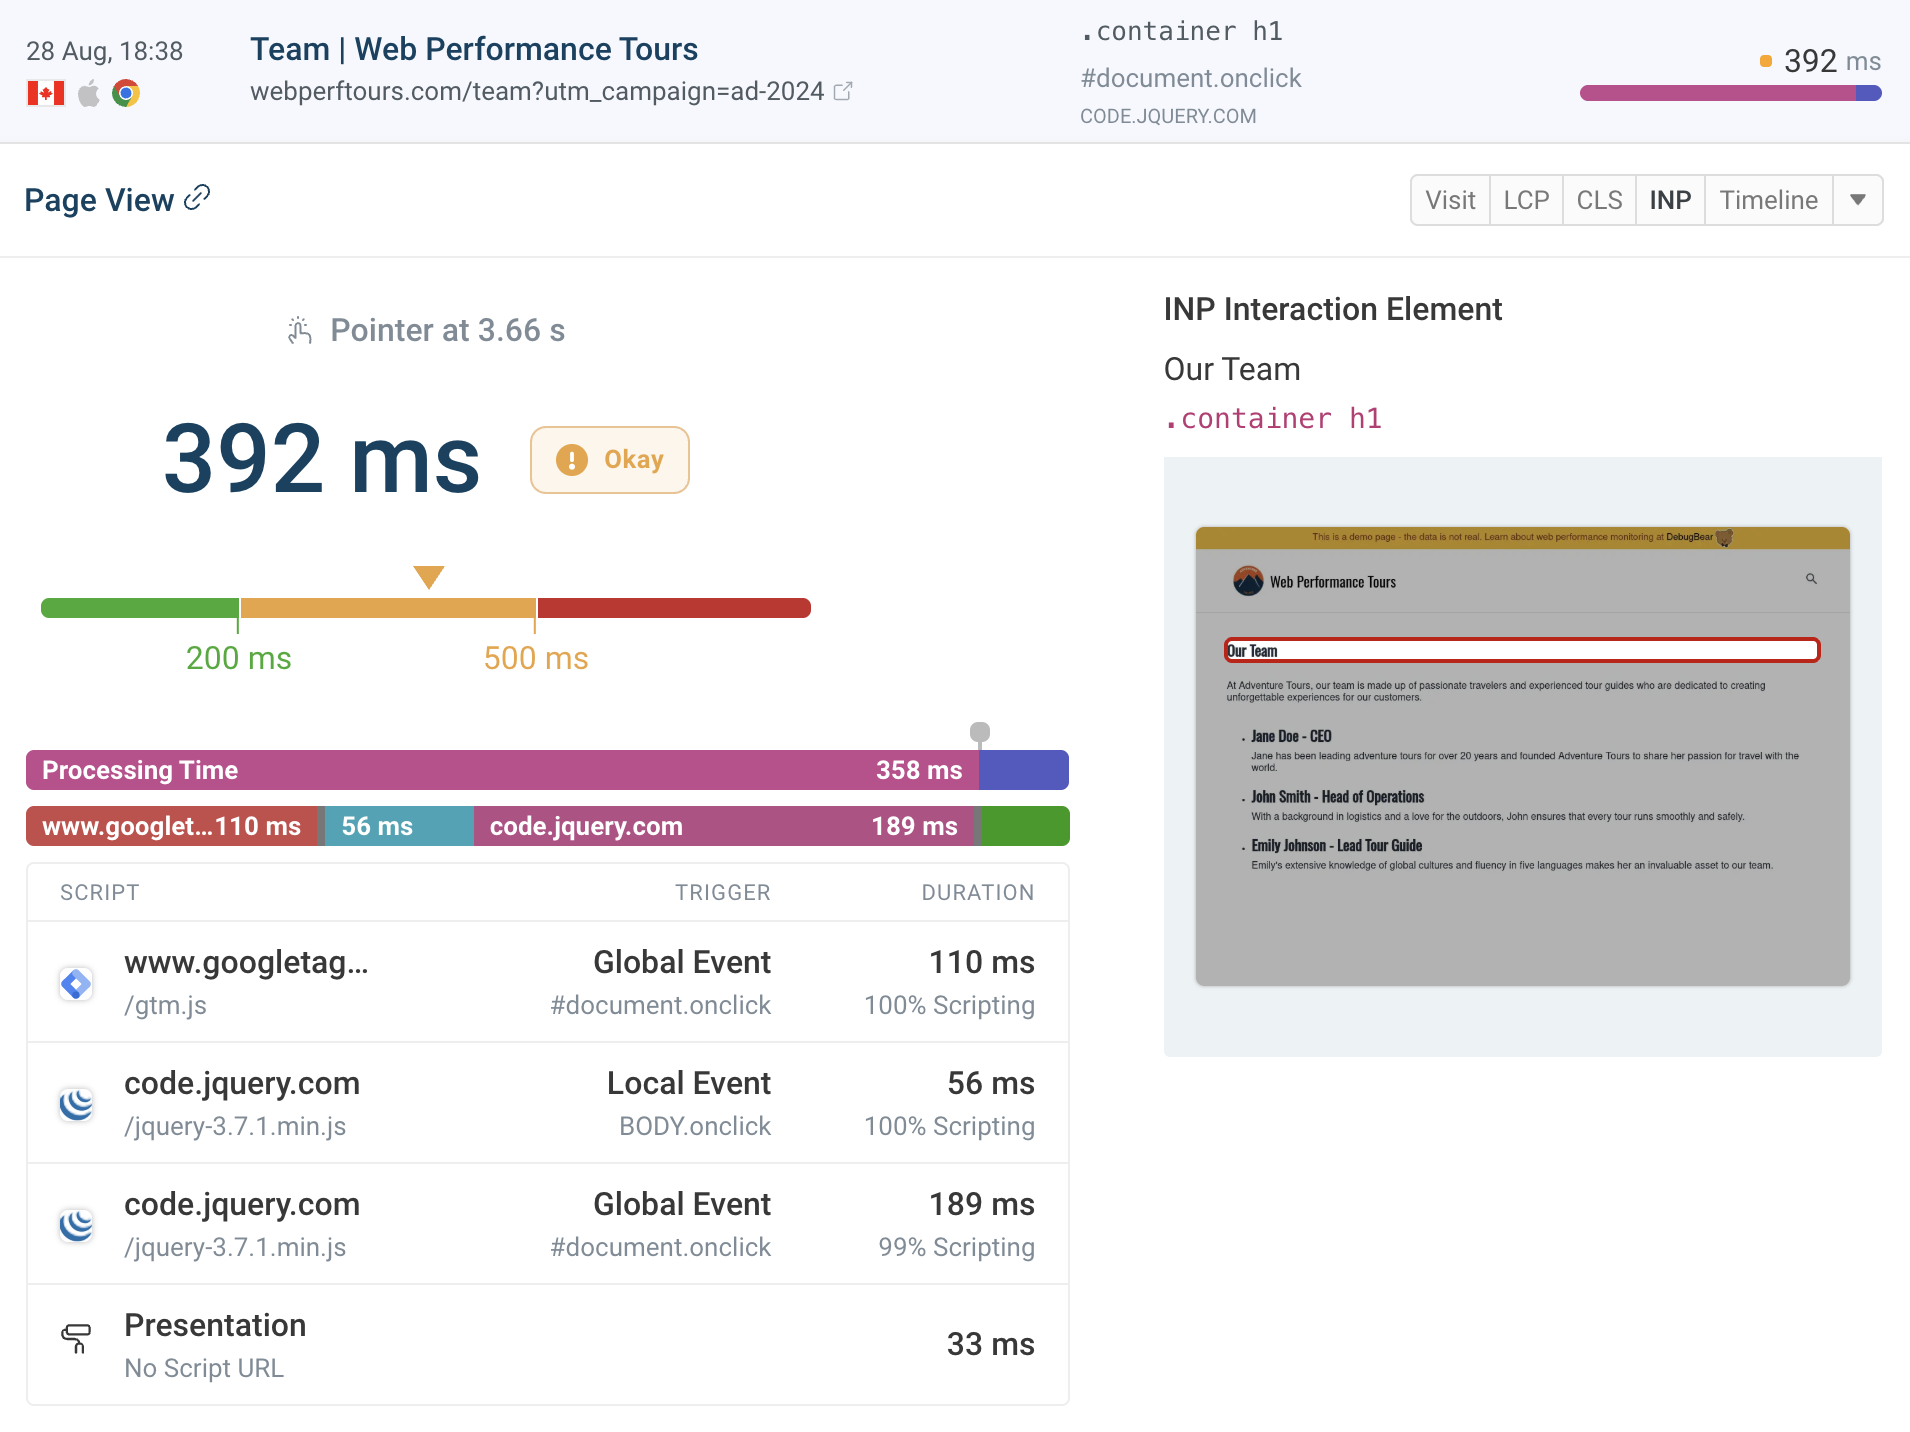
Identify scripts that run during INP interactions
The INP tab for each visit shows you any scripts that ran during the interaction.
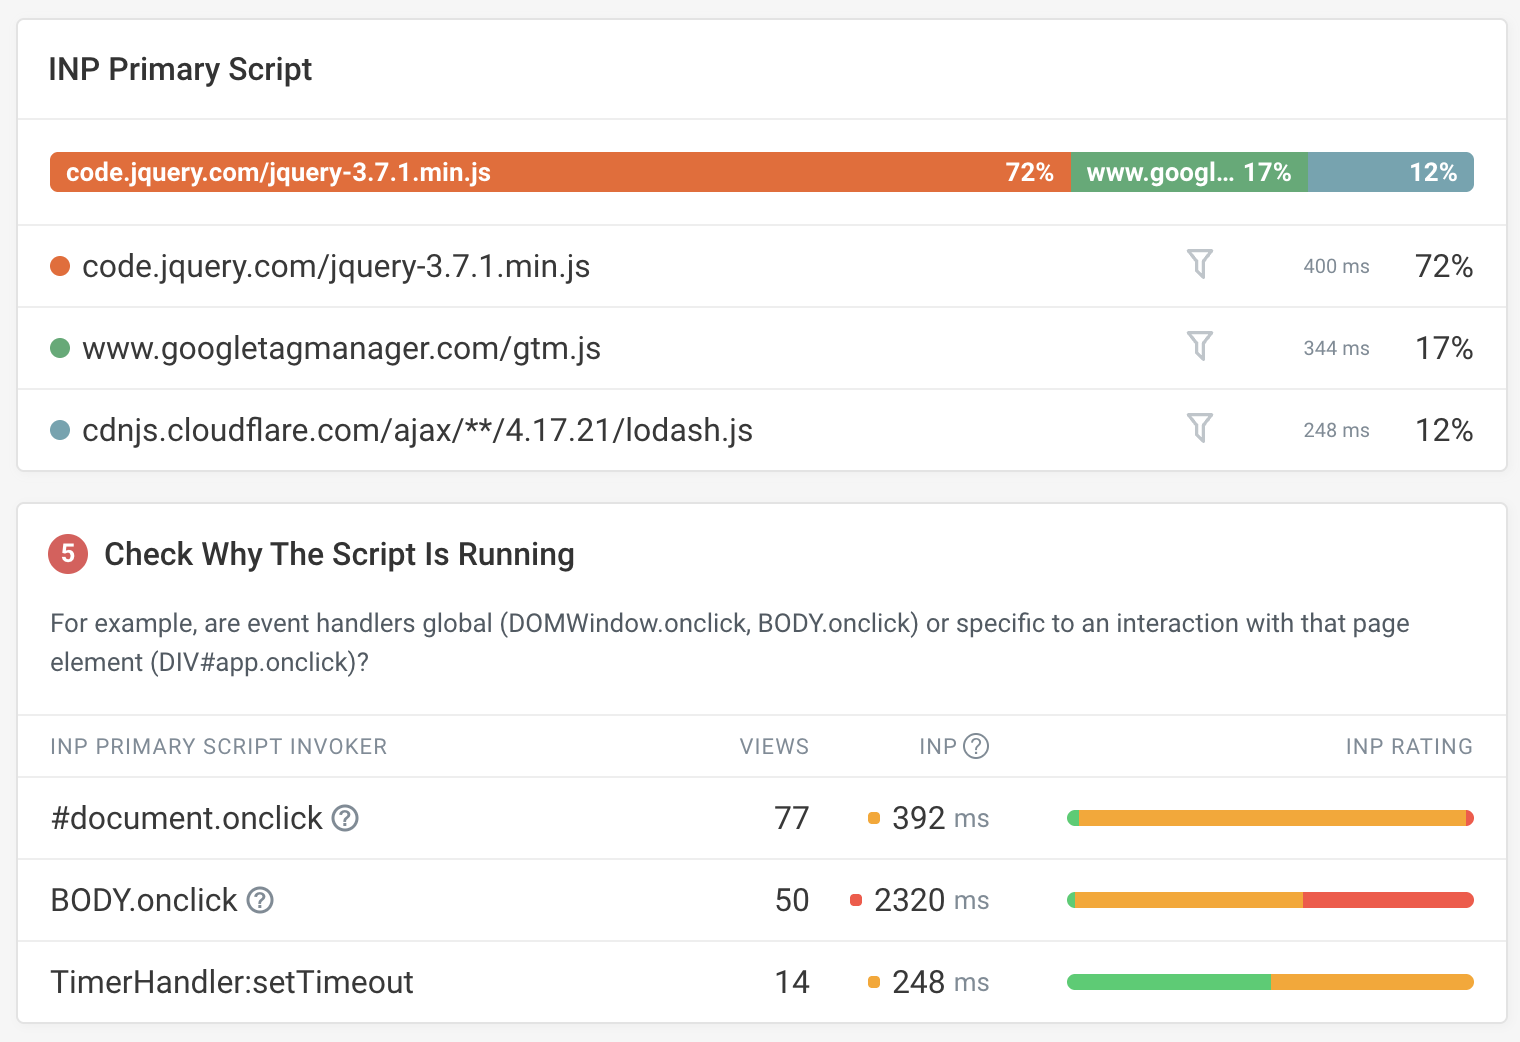
You can also view data broken down by various categories based on the INP attribution data, like the primary script URL or the invoker that triggered the task to run.
Check out our guide to fixing INP issues with real user data.