Debug each performance metric, view a video recording of the page load process, better Lighthouse audit comparisons, and more on SSL certificates.
Contextual debug data
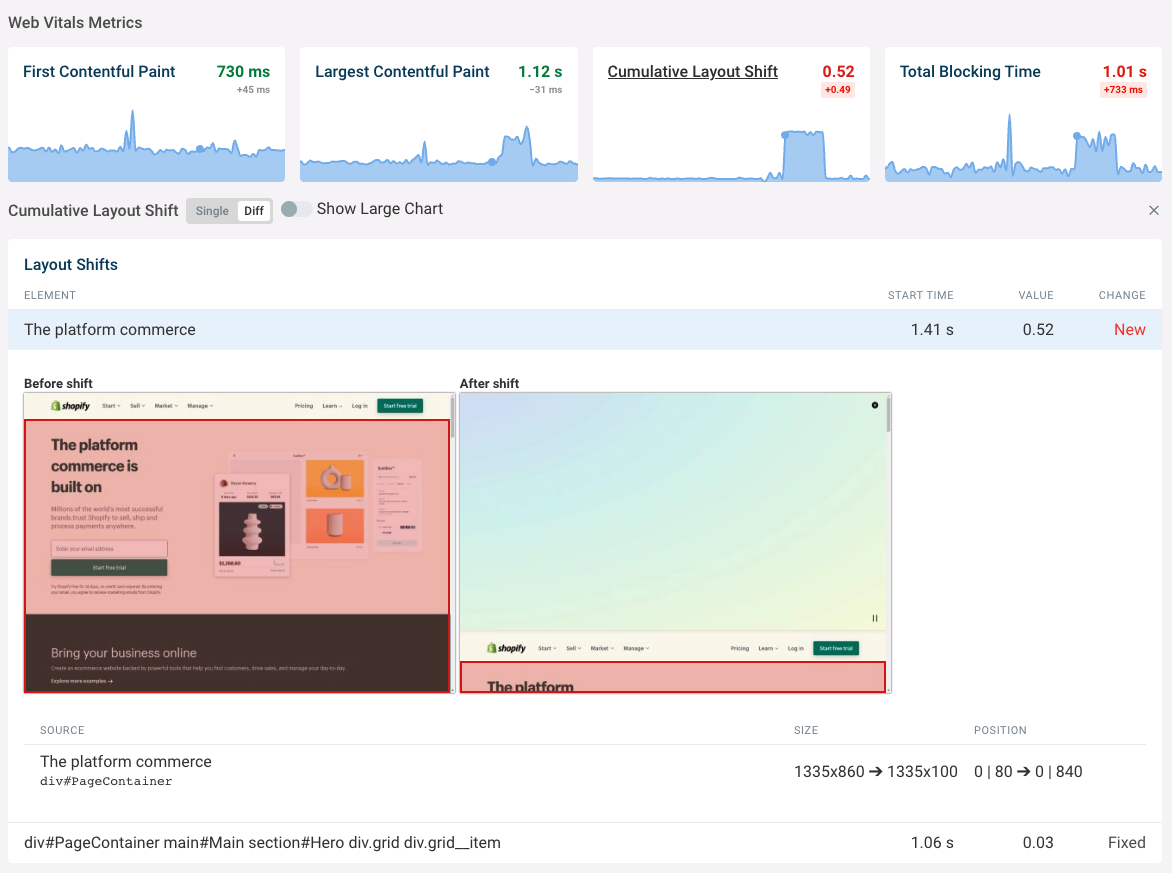
You can now click on most metric charts to get debug data related to that specific metric. Here's an example CLS regression on the Shopify homepage:
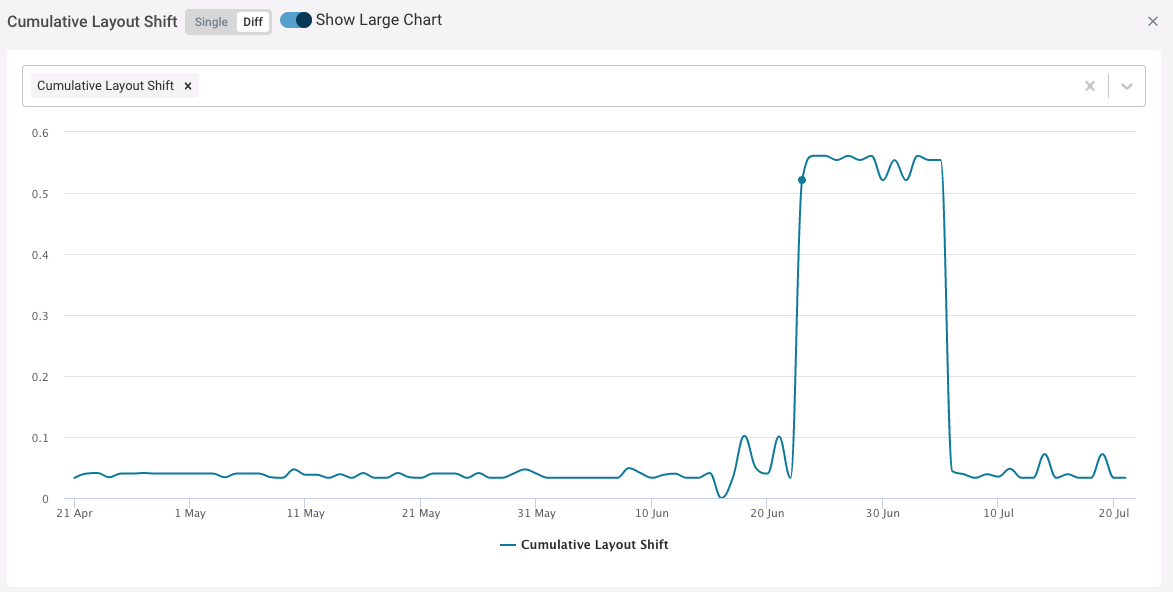
You can also easily view a large version of the metric chart.
Single/Diff view toggle
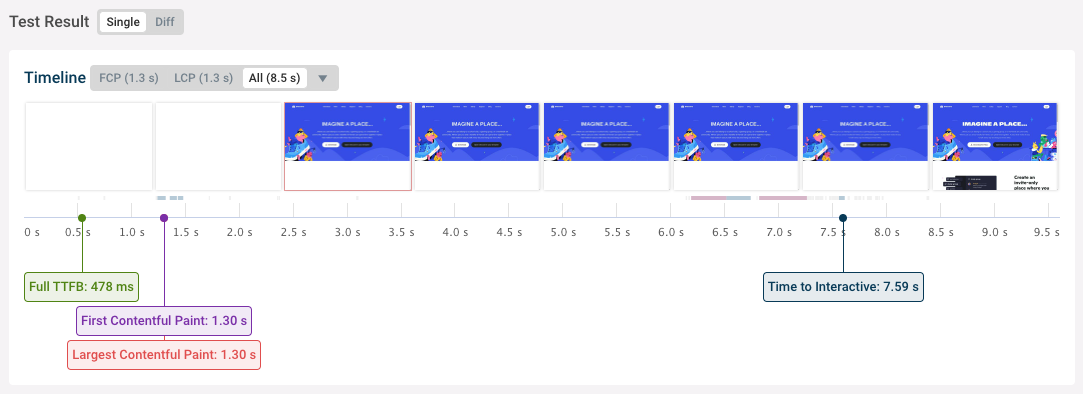
By default we now always show a single test result that you can use to analyze site performance and optimize your website.
(You may notice that we've also updated our timeline view!)
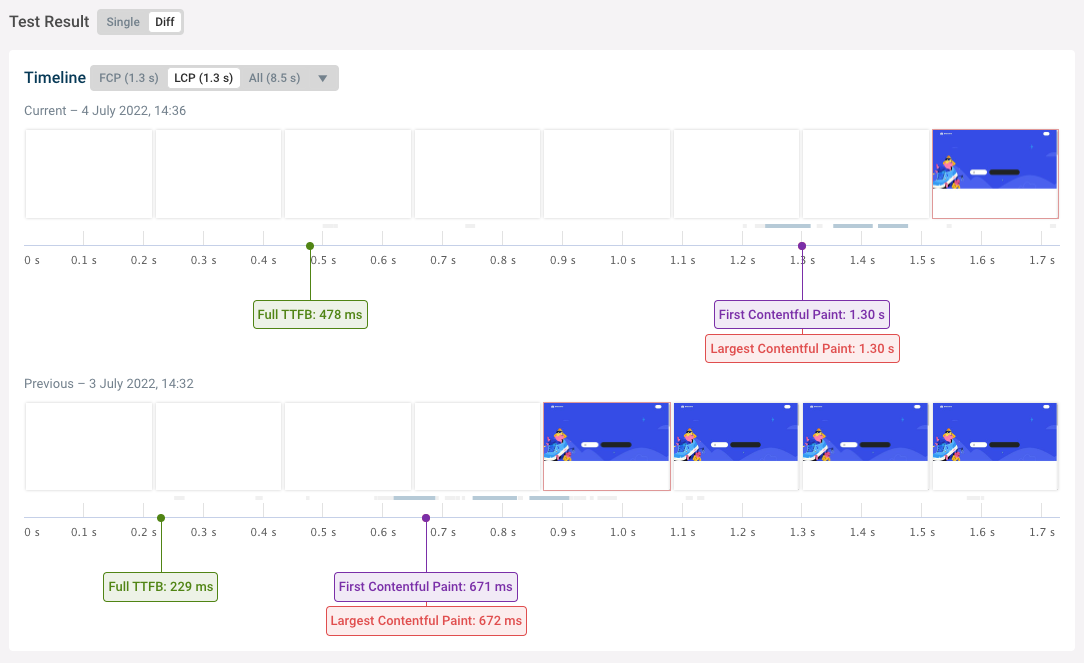
But if you need to investigate a regression you can use the Diff view to compare the two test results in detail and see what changed.
If you click on a metric change in the charts the Diff view opens automatically.
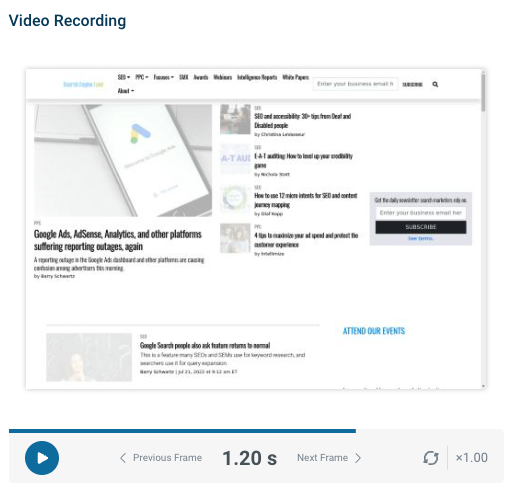
Video recording view
Use the video recording view to see how users experience your website. Or demonstrate the impact of your performance optimizations to clients and the rest of your team.
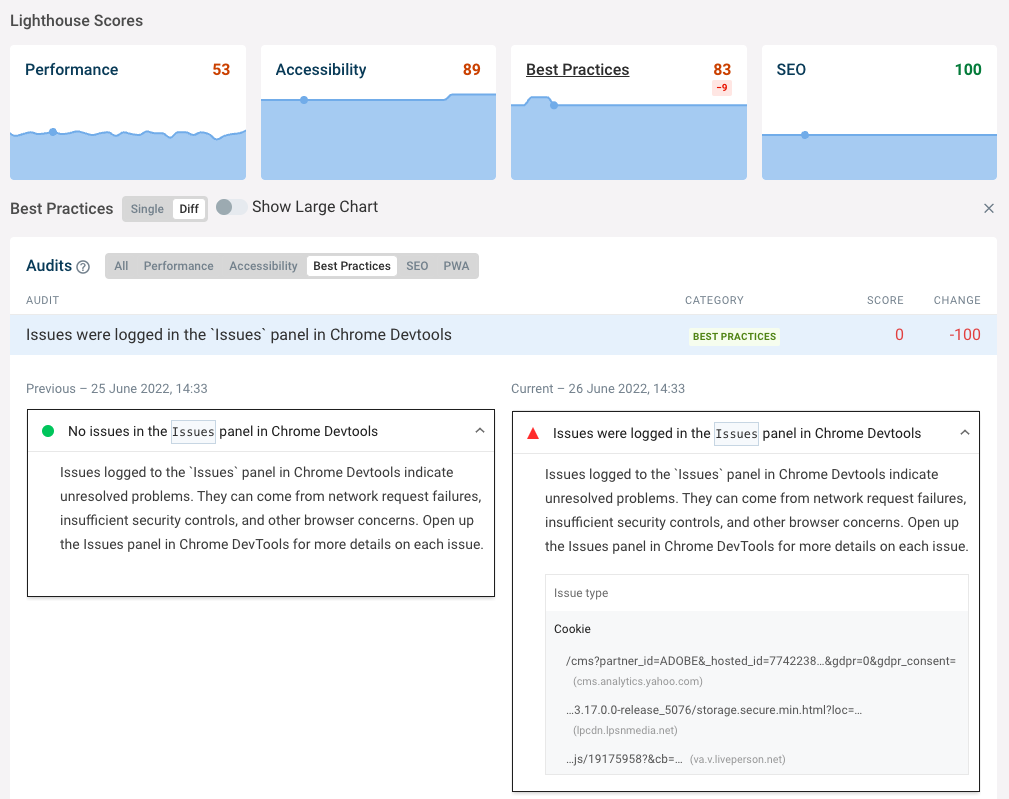
Investigate Lighthouse score changes more easily
You can now view Lighthouse audits for the current and previous test result side by side.
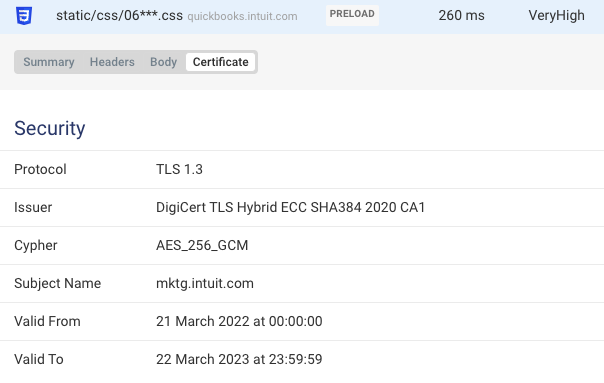
Certificate info
The request details view now includes a Certificate tab that shows more information for secure connections.
Manage newsletter subscription in settings
You can now manage your subscription to the DebugBear newsletter in your account settings.

Chrome upgrade
We now use Chrome 104 to run performance tests.
Updated web performance documentation
We've updated our articles on Largest Contentful Paint and Time to First Byte.
The LCP article now contains an in-depth guide showing you how to optimize rendering on your website. For example, we discuss LCP images, LCP text elements, anti-flicker snippets, and progressive JPEGs.
The TTFB article better explains the difference between HTTP request TTFB and the page load milestone used by Google's CrUX data. We now consistently refer to the latter as "Full TTFB", as includes time spent on redirects or establishing a server connection.
New blog posts
What is Google's Chrome User Experience Report? – an in-depth look at how Google collects real-user performance data and the different reporting options that are available.
How to select a device configuration for site speed tests – find out when it makes sense to use a slow test configuration and when it's better to test something closer to what most of your users experience.