Tracking Google's New Interaction to Next Paint metric, an updated request waterfall, and monthly trends data.
New request waterfall view
We've integrated our requests table and the waterfall view to make it easier to analyze page load behavior.
You can also filter by FCP and LCP to only view early requests.

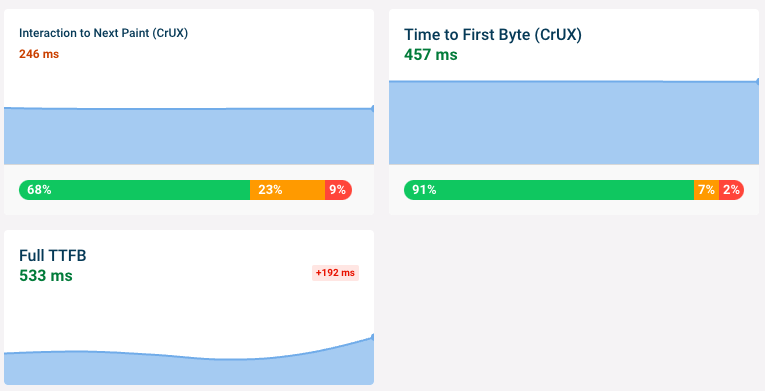
CrUX Interaction to Next Paint and Time to First Byte
Google released a new metric called Interaction to Next Paint, which you can now see in the DebugBear Web Vitals tab.
You can also see TTFB values for both real users and in DebugBear lab data.
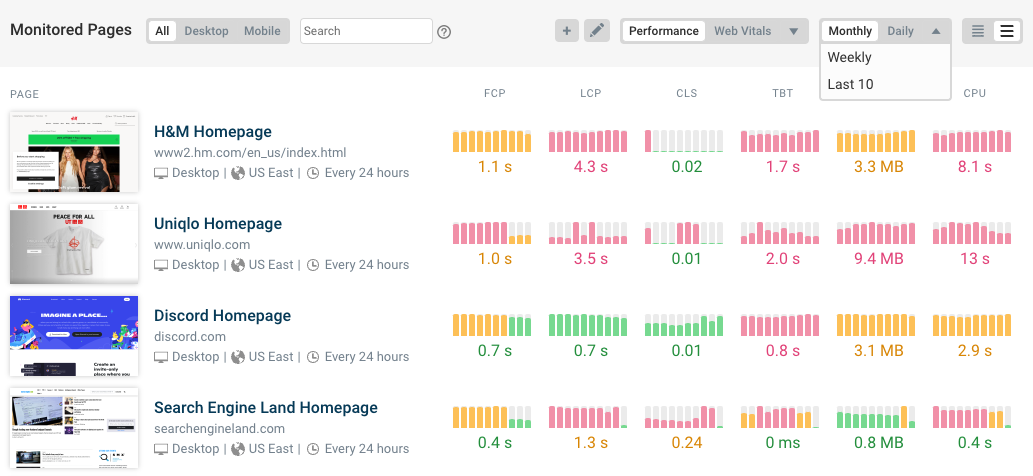
Monthly trends
See data for the last 10 months in the project trends view. We also added an option to view the last 10 test results – useful if you run tests infrequently.
Other updates
- We now show budget breaches in the
oneLineSummaryand in GitHub statuses - We've redesigned the Teams UI
New articles
What is the Chrome User Experience Report – An in-depth look at how CrUX data is collected and what you can do with it.
Server-side rendering – What is server-side rendering and how does it improve site speed?
Speed test configuration – How to select a device configuration for site speed tests
Interaction to Next Paint – An explanation of Google's new INP metric