Google is standardizing some of its performance advice between Lighthouse and Chrome DevTools. Find out how you can see these new performance insights in both tools.
What are Lighthouse insights audits?
When you run a Lighthouse test, Lighthouse collects information about your page called artifacts. This information is then processed by the performance audits and turned into a series of recommendations to improve your website.
Since the new DevTools performance panel also provides performance suggestions, Google is now working on sharing the code that provides that analysis between Lighthouse and DevTools. Those audits are called Insights audits.
Insights audits on PageSpeed Insights
Since PageSpeed Insights is powered by Lighthouse, that means these new insights are available there as well.
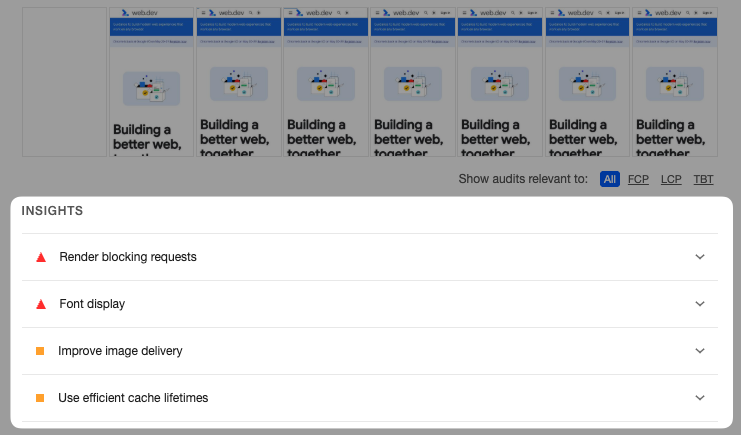
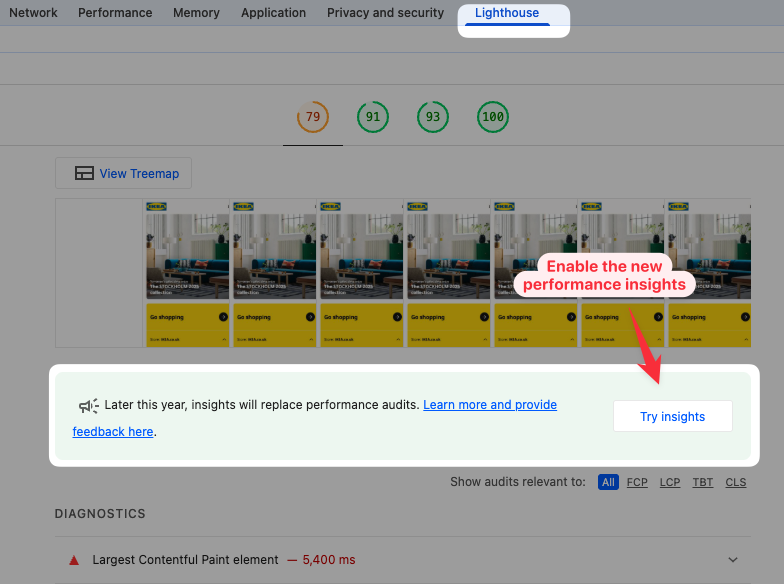
For now the traditional performance audits are shown, but you can click Try Insights to switch over to the new audit types. We're expecting Google to show them by default from June 2025.
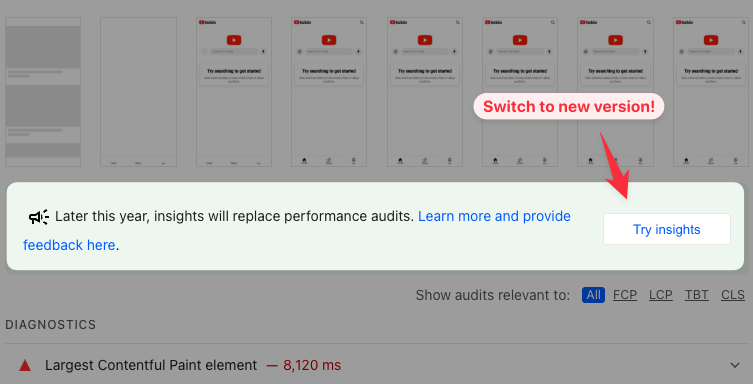
Once enabled you can use the new insights to identify ways to speed up your website, or switch back to the traditional audits.
How to view performance insights in Chrome DevTools
To view these recommendations in DevTools, collect a profile in the Performance tab and then expand the Performance Insights sidebar on the left.
Unlike Lighthouse, which mostly just provides a list of issues and recommendations, DevTools can annotate the performance trace and provide more visual reporting. For example, after expanding the insight on render-blocking requests, Chrome highlights these requests in the performance trace.
You can also view insights for specific metrics. For example, if I click on the LCP metric marker in the timeline, Chrome shows me buttons to view two insights:
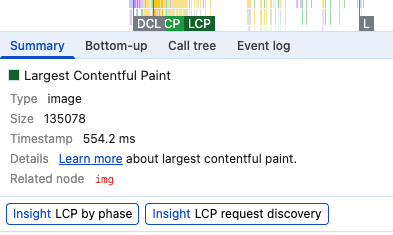
If I click on the LCP by phase insight, Chrome shows a subparts breakdown for the Largest Contentful Paint metric. That can help me better understand what's delaying the LCP the most and where I should optimize.
How to view performance insights in Lighthouse
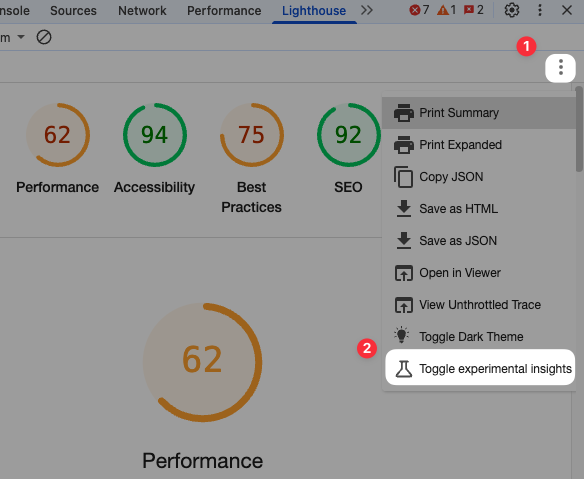
If you run Lighthouse in the DevTools Lighthouse tab you can click the three dots to open the menu and then select Toggle experimental insights.
Consider using Chrome Canary to get the full list of performance insights for your website. (See below for more.)
When using the CLI you can pass the --preset=experimental flag, for example like this:
lighthouse --preset=experimental https://web.dev/
You can then see the insights after enabling them through the toggle mentioned above.
Toggle insights and audits in Chrome Canary
Chrome Canary offers a "Try Insights" button if you run a Lighthouse test in Chrome DevTools.
What performance insights are available?
Let's take a look at the specific insights audit that Google is adding to DevTools and Lighthouse. Many of them are similar to existing Lighthouse performance audits.
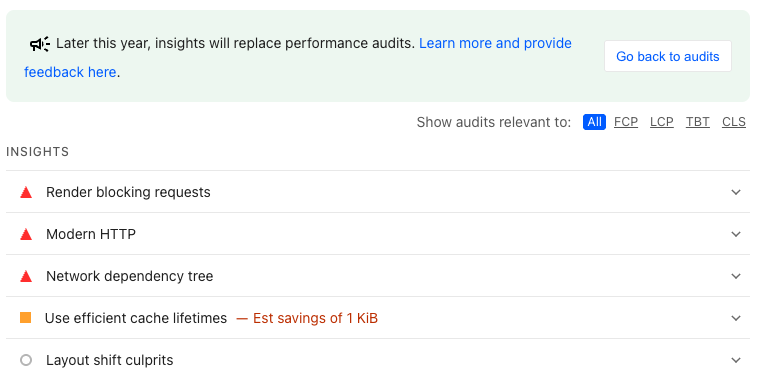
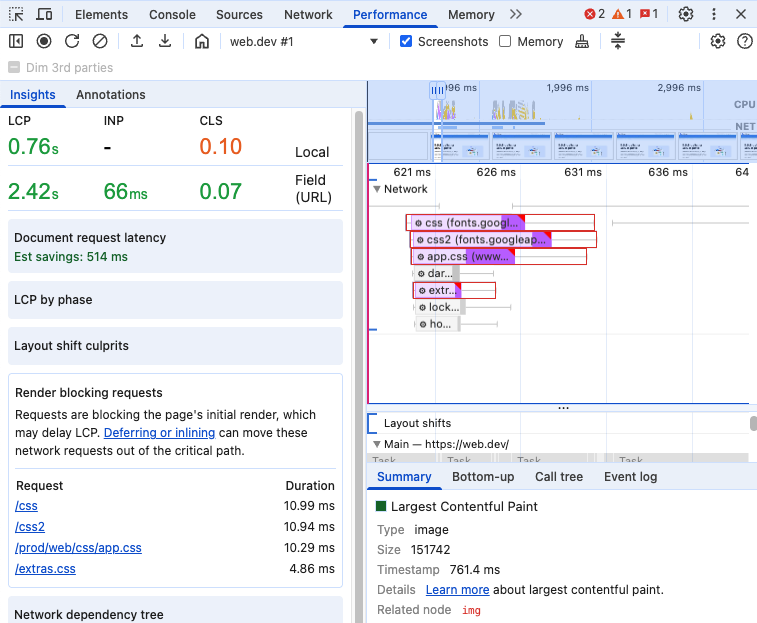
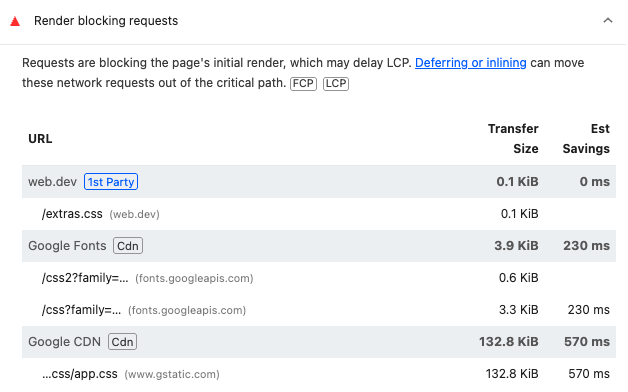
Render blocking requests
Render-blocking requests are resources that the browser needs to load before it can start displaying any page content.
This audit tells you what requests delay rendering and provide a savings estimate if the request was removed or changed to not block rendering (for example with the async or defer script attributes).
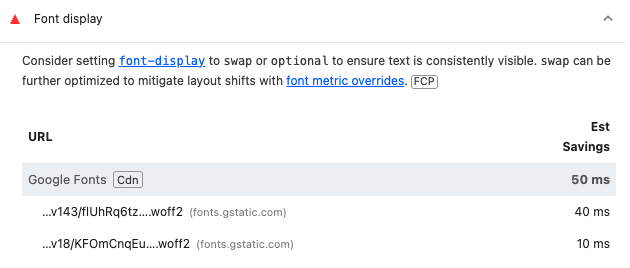
Font display
If a page waits for web fonts to load before text renders that can be bad for performance.
You can set the font-display CSS property to swap to tell the browser it should initially show a fallback font instead of hiding the text.
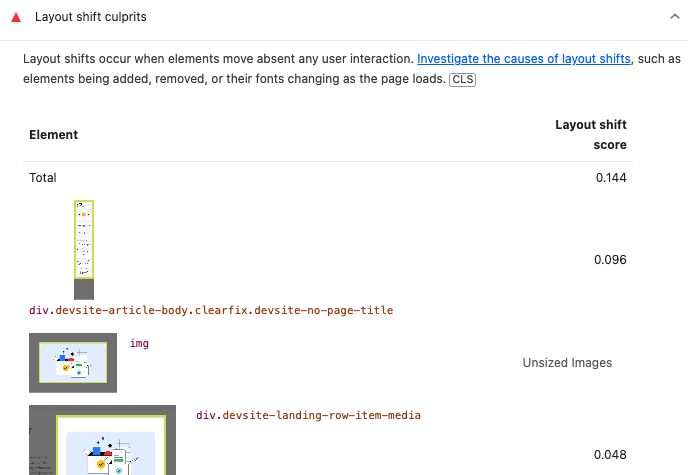
Layout shift culprits
The layout shift culprits audit tells you what page elements move around after rendering and cause a high Cumulative Layout Shift score.
This audit also identifies potential causes for some of the layout shifts, for example unsized images or webfont requests finishing.
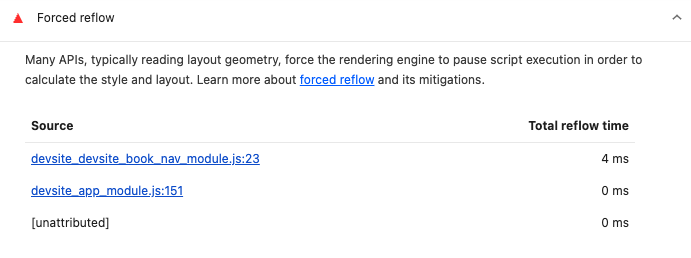
Forced reflow
Forced reflows are layout calculation that are triggered by JavaScript execution on the page. For example, they happen if JavaScript code changes the contents of the page and then tries to read the size of a UI element.
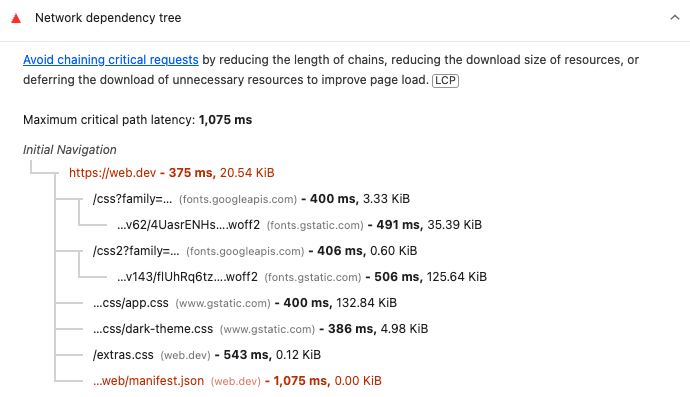
Network dependency tree
The network dependency tree audit tells you how different network requests are chained together.
In some cases page content can only be displayed once the full request chain has loaded, which is why it's useful to look at the maximum critical path latency.
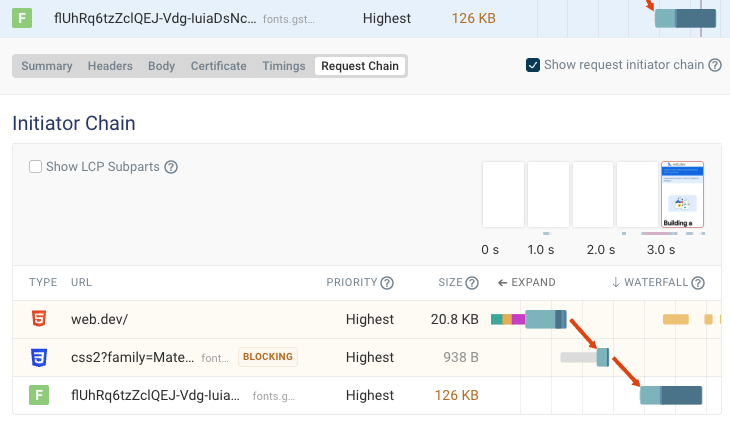
You can also view these request chains by running a website speed test with DebugBear.
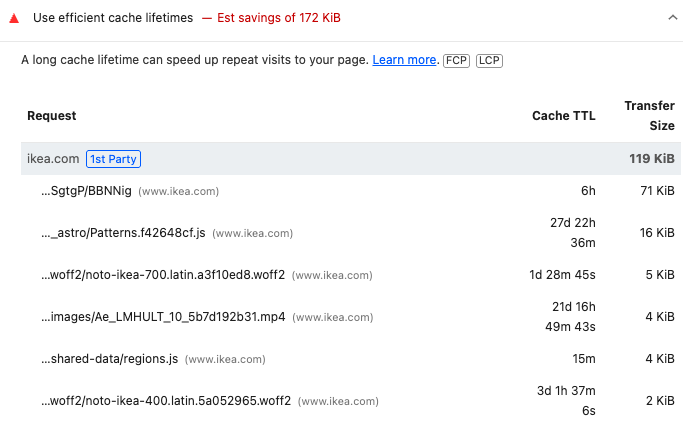
Use efficient cache lifetimes
Browser caching speeds up page views after the initial visit to your website by re-using files that have already been downloading.
By enabling caching and making sure the cache lifetime is long enough, you can make your website faster when visitors navigate through your site or return to it a second time.
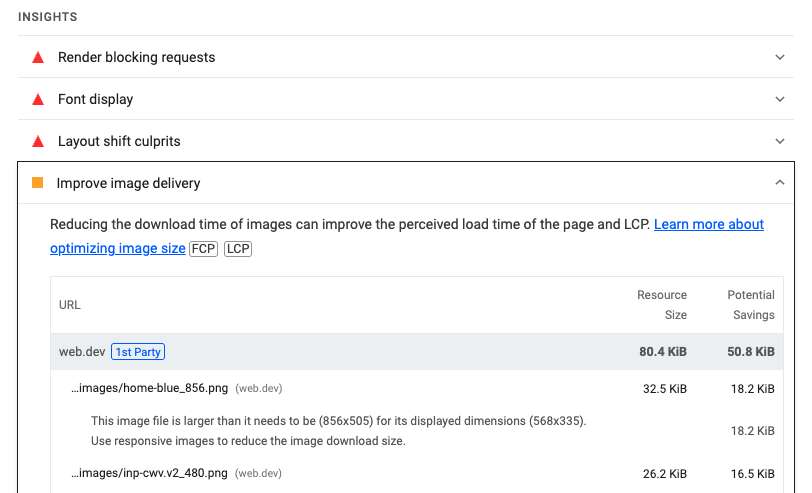
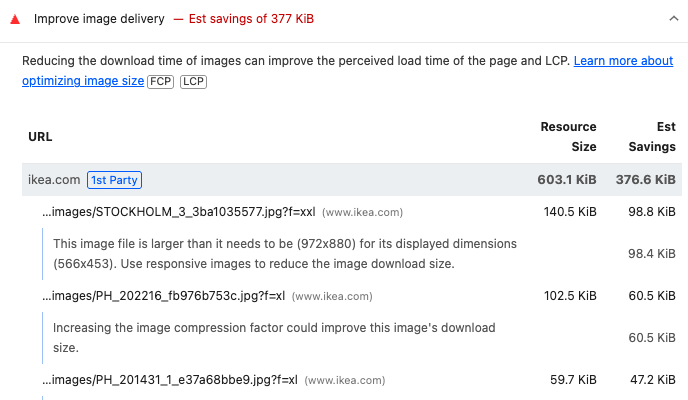
Improve image delivery
How you serve images on your website has a big impact on its overall loading speed.
This insights audit highlights a few potential optimizations to improve image delivery, for example:
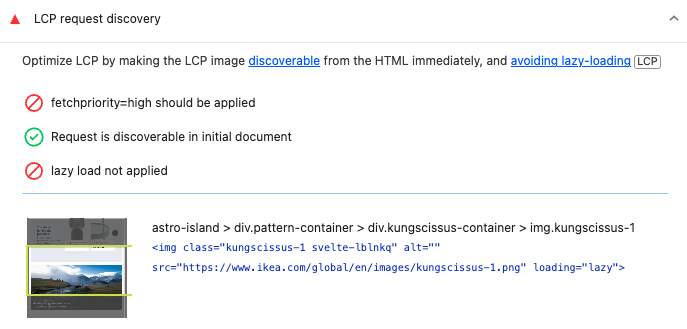
LCP request discovery
To ensure the main image appears as early as possible, the browser first has to identify the LCP image and start loading it. The LCP request discovery audit performs several checks to ensure the LCP image request happens as soon as possible.
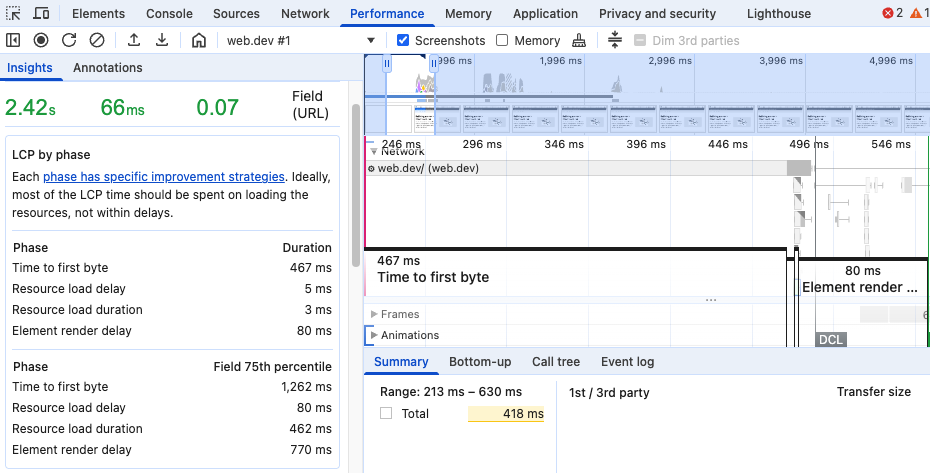
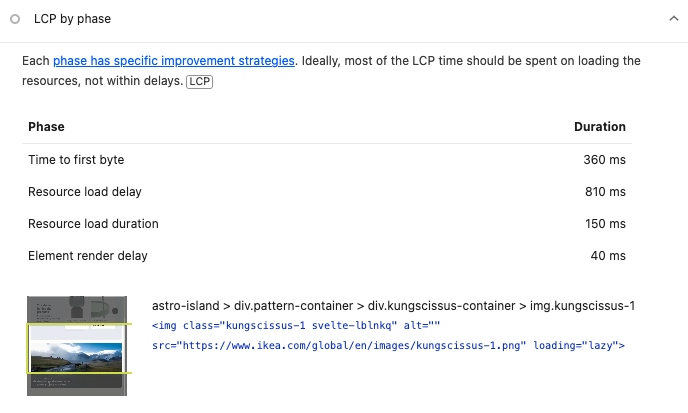
LCP breakdown
The LCP metric can be split into several LCP subparts that tell you what's causing most of the delay. The LCP by phase insight provides a breakdown of each phase as part of the Lighthouse report.
For example, a poor Time to First Byte score indicates a slow HTML response from the server, or high resource load duration could indicate an oversized LCP image file.
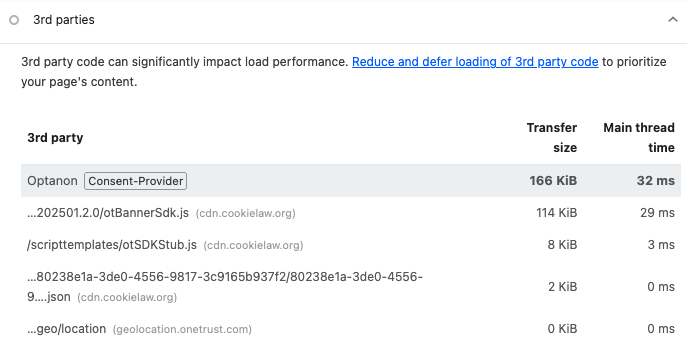
3rd parties
Sometimes to make your website faster you don't have to optimize your own code but instead reduce the impact of third-party code.
The 3rd parties insights audit tells you what third parties load on your website, how large the files are that they download, and how much CPU main thread work they cause.
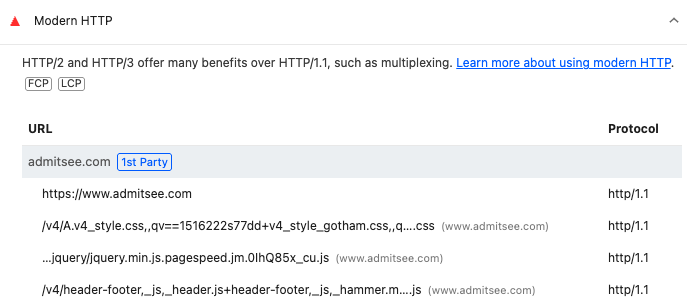
Modern HTTP
When loading many files from the same server, the newer HTTP/2 protocol is much faster than HTTP/1.1.
This audit will tell you if your website is still using HTTP/1.1 to load some resources on your website.
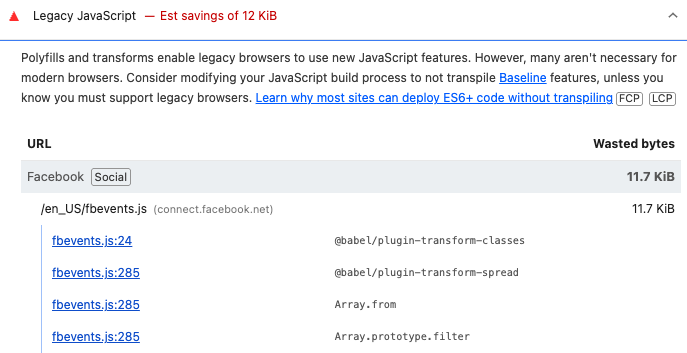
Legacy JavaScript
Older browsers don't support all modern features of the JavaScript programming language. To address that, websites often use techniques like polyfills and code transforms to write modern code that runs in all browsers.
However, this increase JavaScript file size which means slower downloads and code execution time. That's why you should avoid serving legacy JavaScript to browsers that don't require it.
The Legacy JavaScript audit identifies unnecessary polyfills and code transforms in your code.
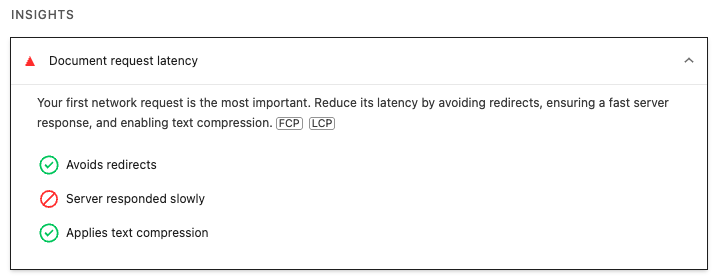
Document request latency
Before the HTML document is loaded browsers can't do much to load the rest of the web page. That's why reducing document request load time is important.
This insights audit checks that server response time is low, text content is compressed, and that there are no HTTP redirects before the HTML response.
Duplicated JavaScript
Sometimes websites load the same JavaScript libraries multiple times across different code bundles. This audit detects duplicated code that would be quicker to load just once.
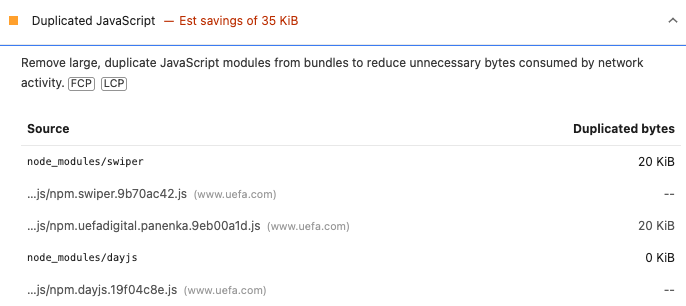
The Lighthouse treemap view can help you identify what libraries are contributing the most to your overall JavaScript page weight.
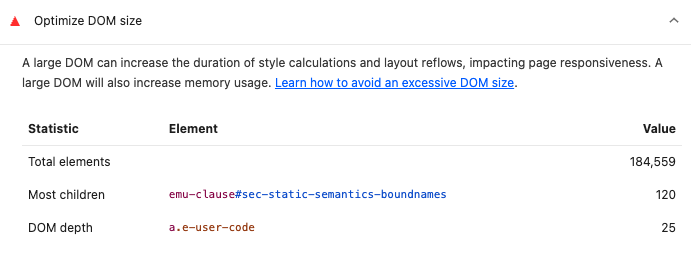
Optimize DOM size
An excessive DOM size means you have a large number of elements on your page. That slows down layout and style calculations on the page.
The Optimize DOM Size audit tells you how many page elements there are in total and also provides some information on how they are nested and what DOM nodes are the largest.
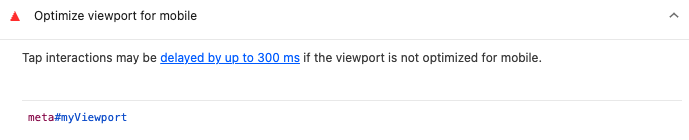
Optimize viewport for mobile
When a touch interaction happens it's not always obvious if the user is trying to double-tap to zoom in or trying to single tap an element. That's why, by default, mobile browsers wait about 300 milliseconds before handling the interaction.
Most sites today use a meta viewport tag with a content value of width=device-width to avoid this issue. However, if that's not the case for your site then the optimize viewport for mobile audit will tell you.