Web Vitals Report
The Web Vitals tab shows data on the Core Web Vitals metrics that Google uses as a ranking signal.
Data is collected from Google's Chrome User Experience Report (CrUX) and from lab tests run on DebugBear servers.
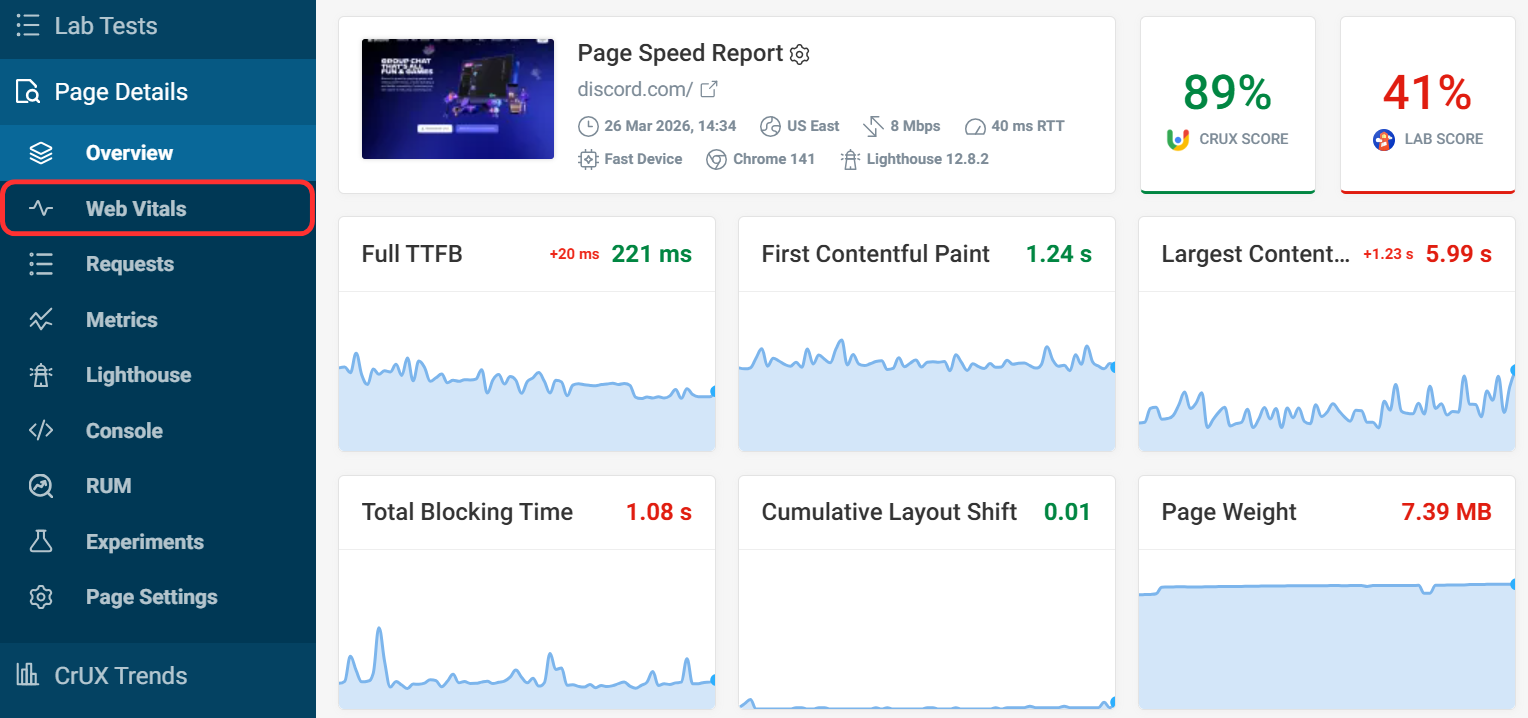
To view the web vitals report for a page, click Web Vitals in the sidebar.
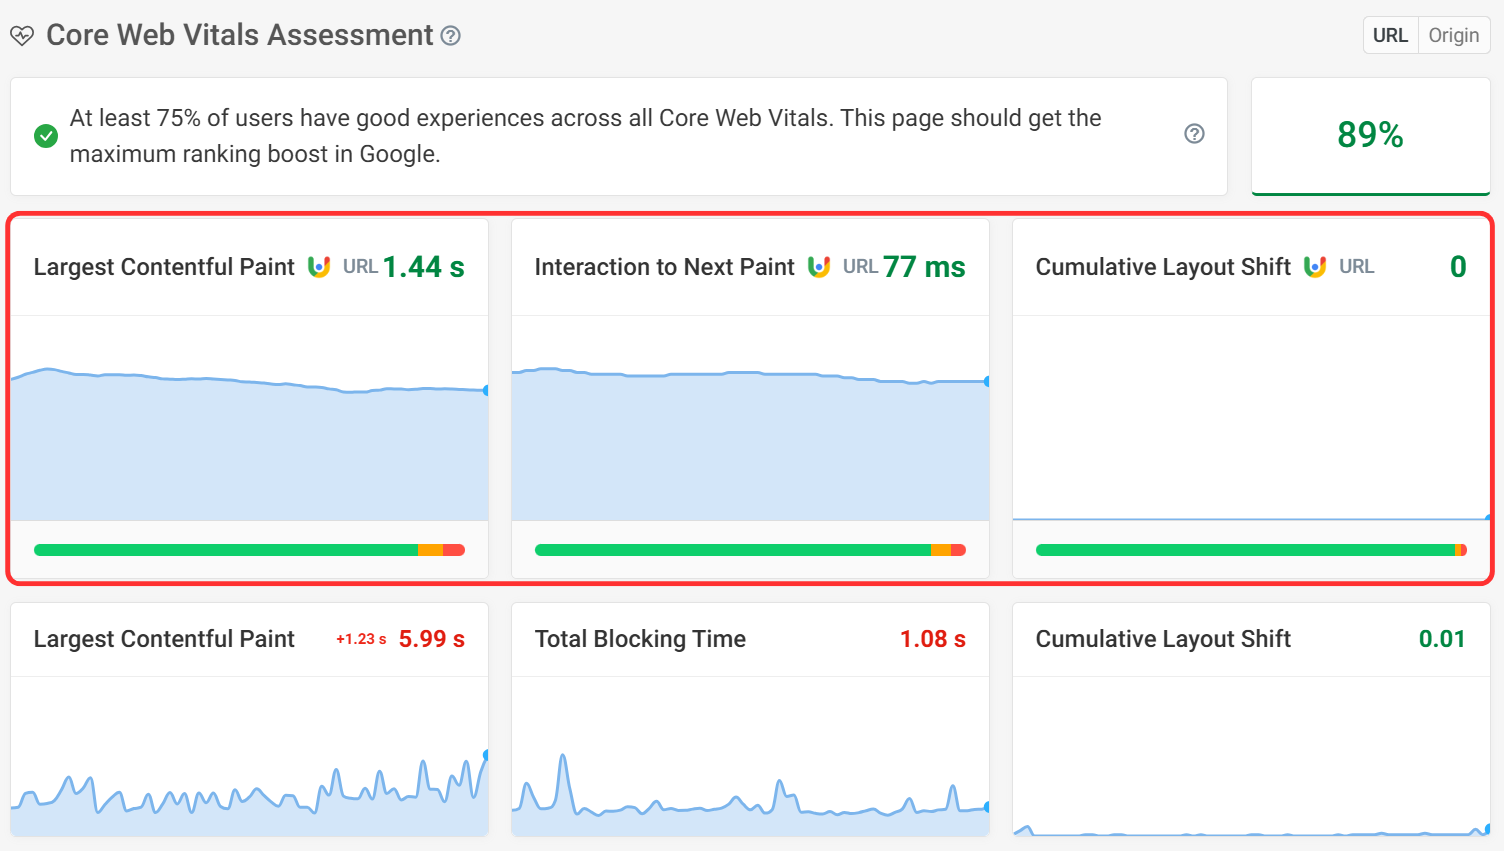
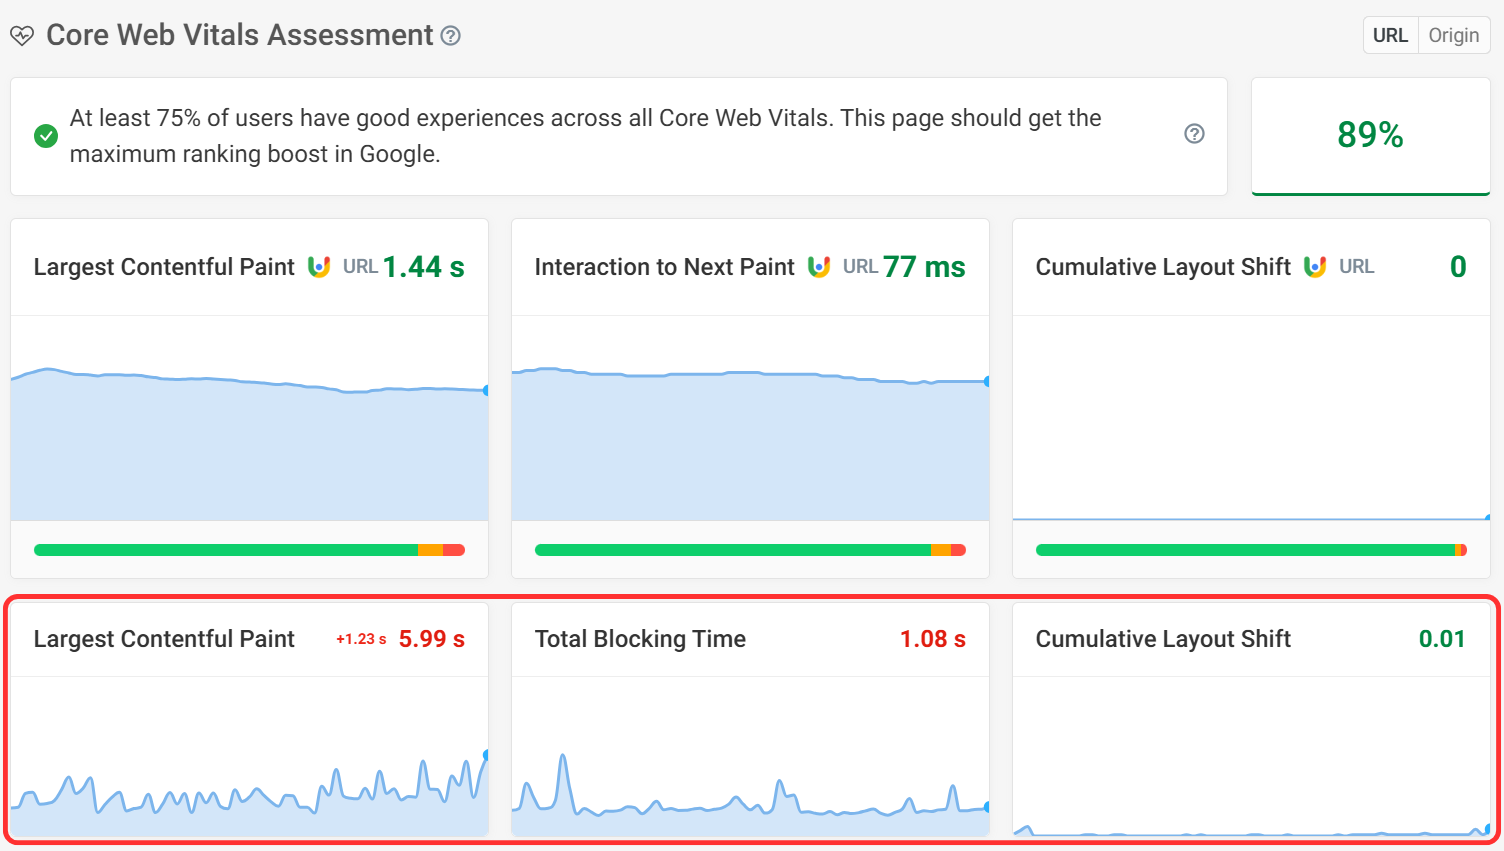
Core Web Vitals Assessment
This section shows the score for each Core Web Vital: Largest Contentful Paint (LCP), Interaction to Next Paint (INP), and Cumulative Layout Shift (CLS). The numbers represent the 75th percentile, which means 25% of user experiences were worse and 75% were better than what's shown in the report.
The data is aggregated over a 28-day period, so it may take a while for optimizations to your page speed to become visible.
The bar below the metric chart shows what percentage of experiences were good, okay, or poor. To get a ranking boost in Google, you should aim for at least 75% good experiences.
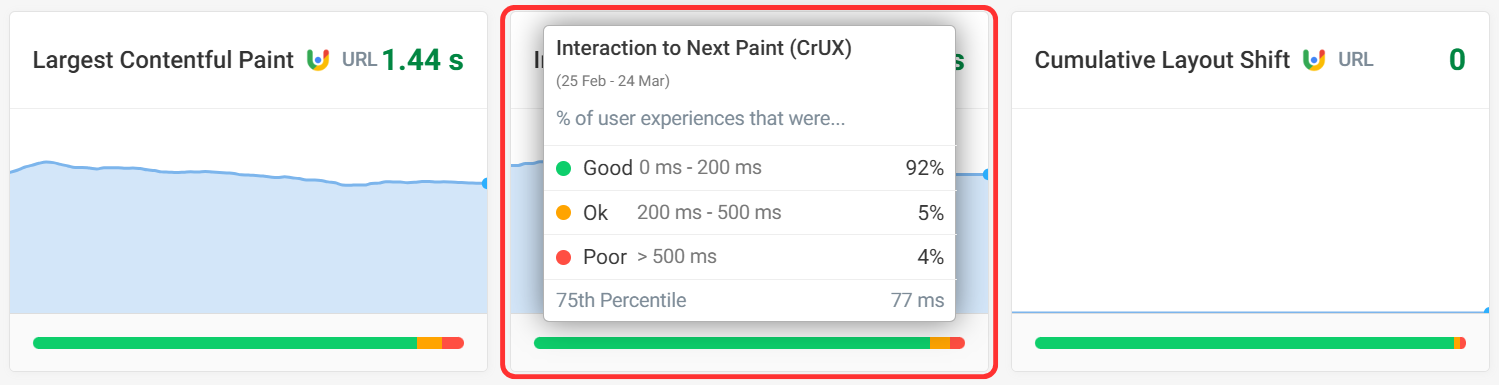
Hover over the bar with the rating breakdown to see the rating thresholds Google uses for each metric.
Below the CrUX values are the lab test metrics which correlate with each CrUX metric for comparison.
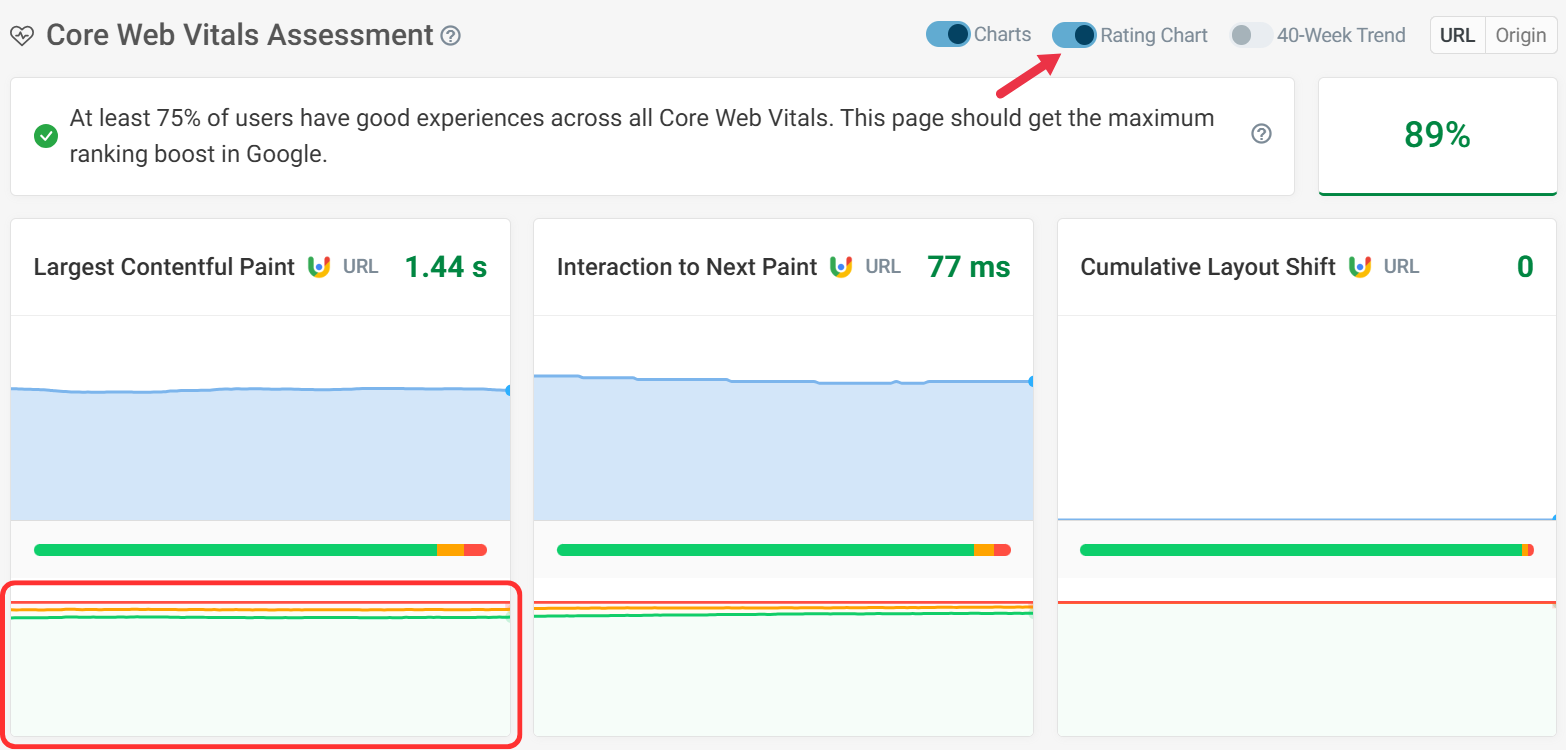
To view rating trends over time, click on the rating bar or toggle the Show Rating Chart checkbox.
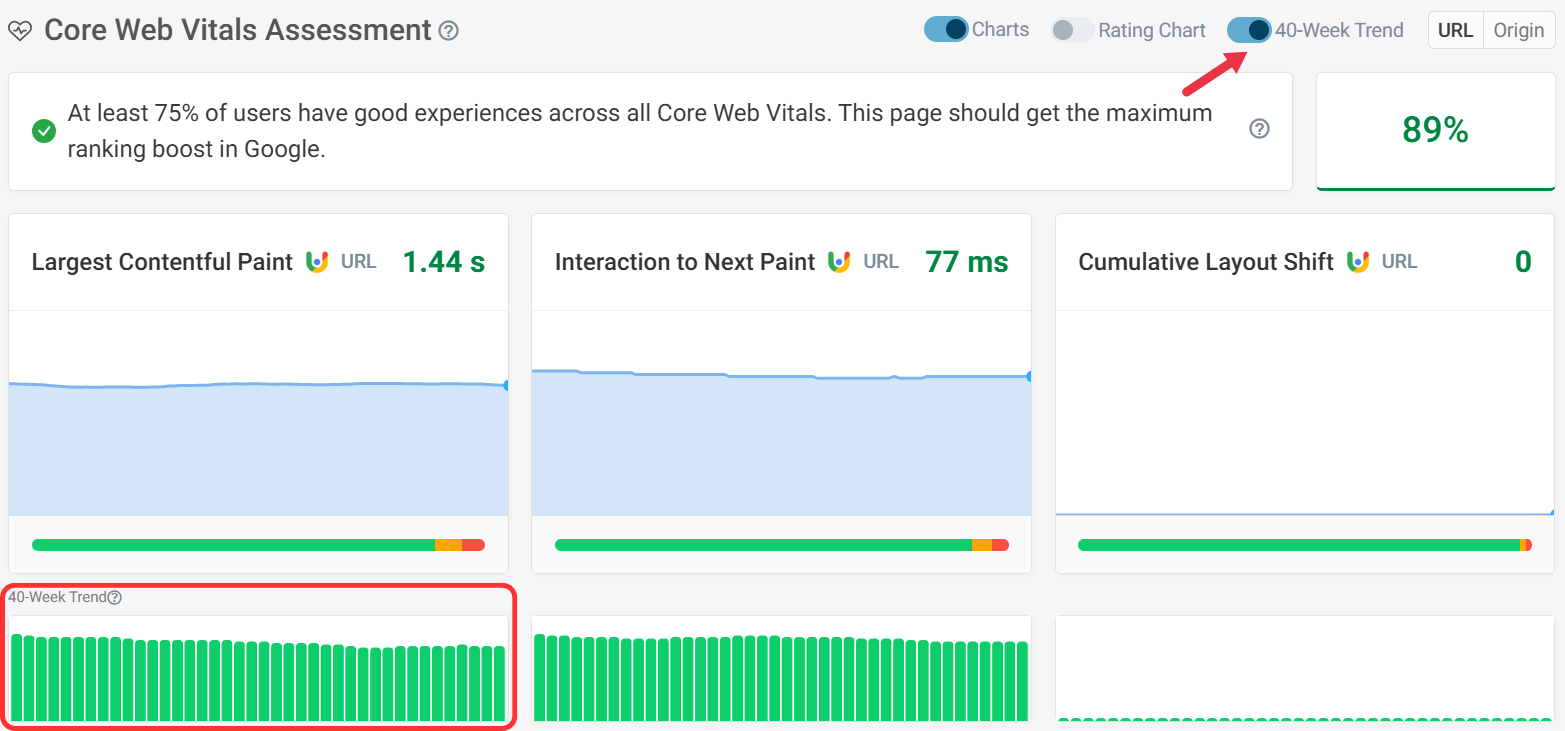
To view the trend line, click 40-Week Trend.
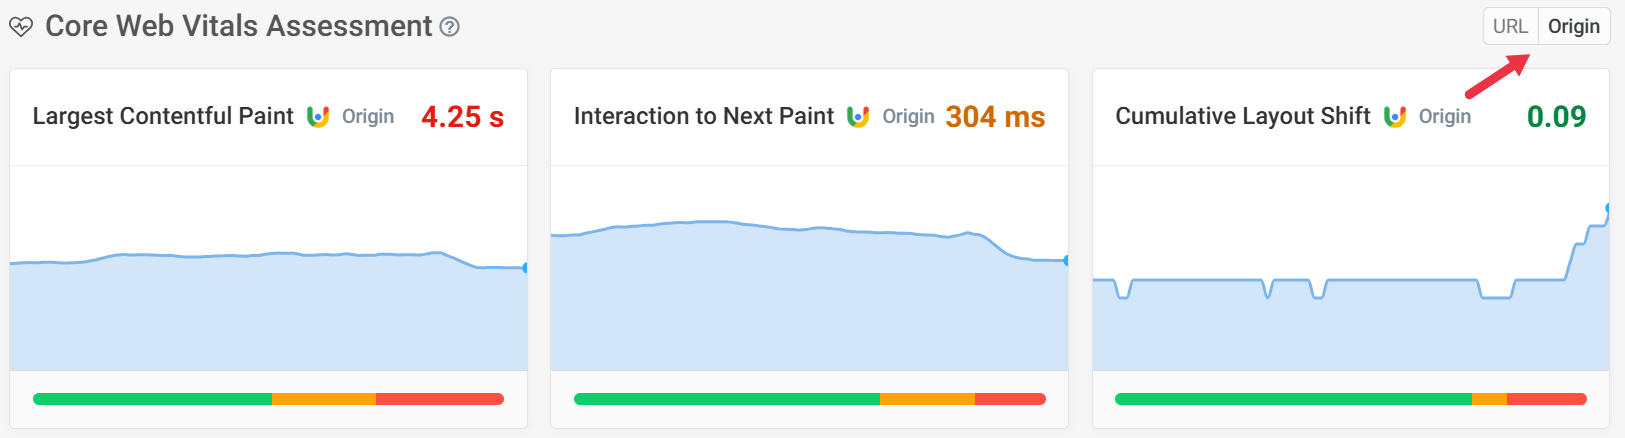
The URL/Origin toggle lets you choose whether to show data for the specific page or for the entire website domain. If a page doesn't get enough traffic, only origin-level data may be available. For small websites, no CrUX data may be available at all.
Largest Contentful Paint Analysis
The Largest Contentful Paint Analysis includes both Lab and CrUX data for Time to First Byte (TTFB), First Contentful Paint (FCP), and LCP.
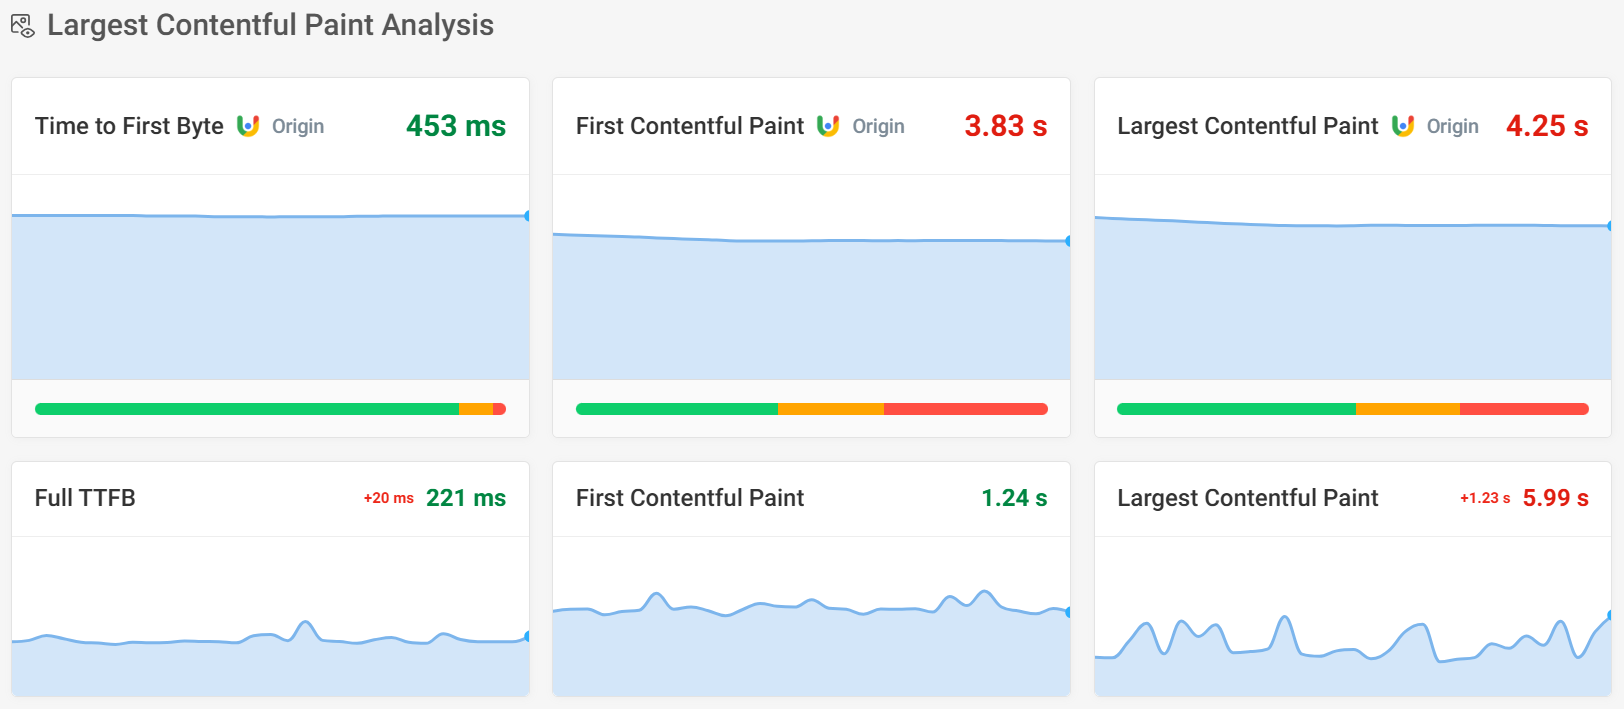
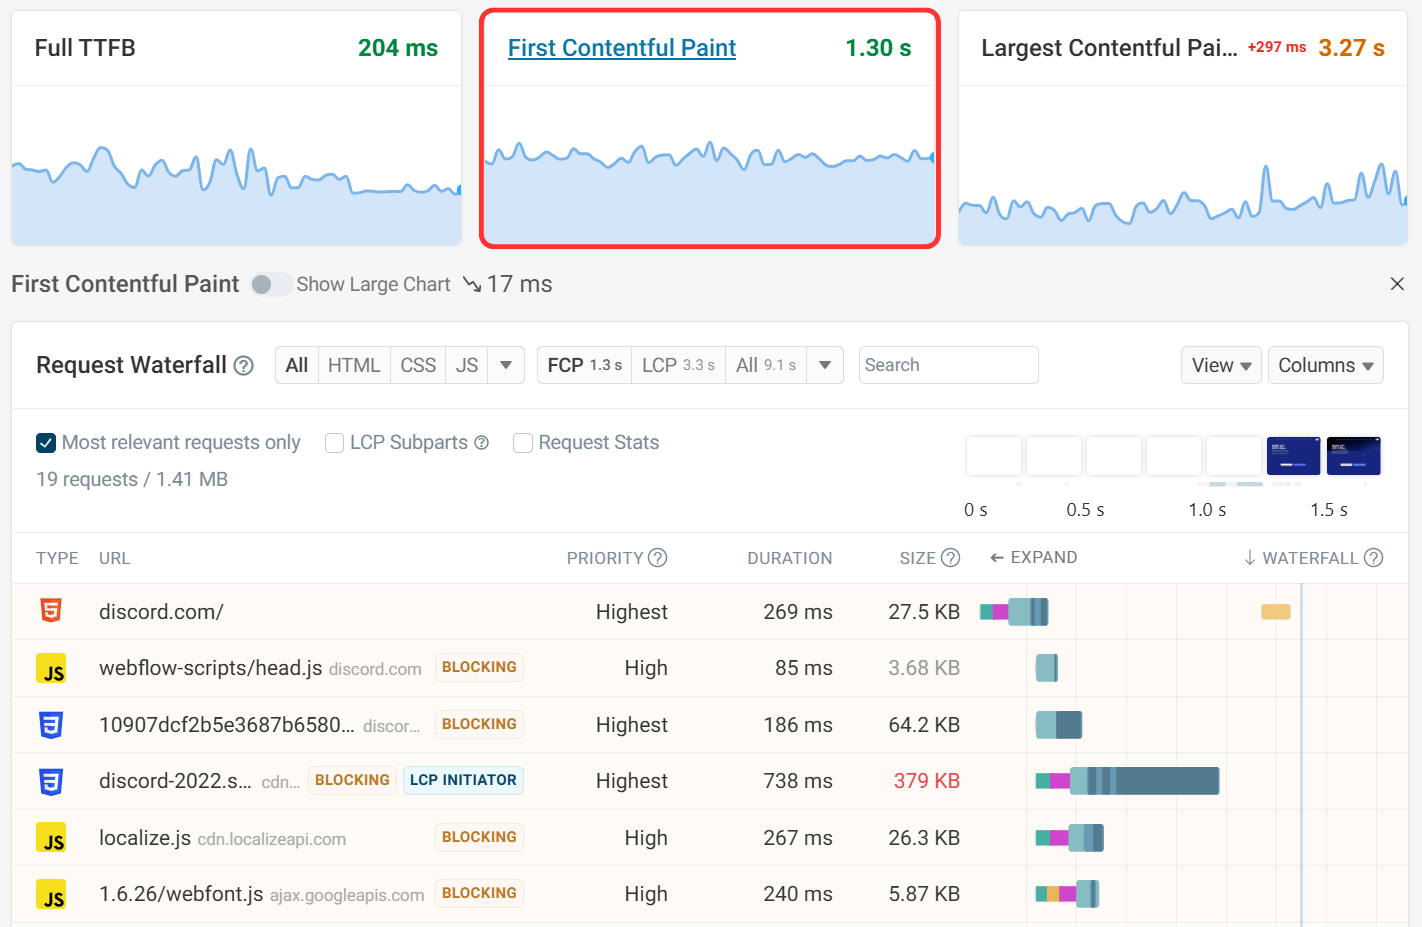
You can click on each metric to view more details and identify ways to speed up your website. For example, after clicking on the FCP metric, you will see what network requests on the page block rendering.
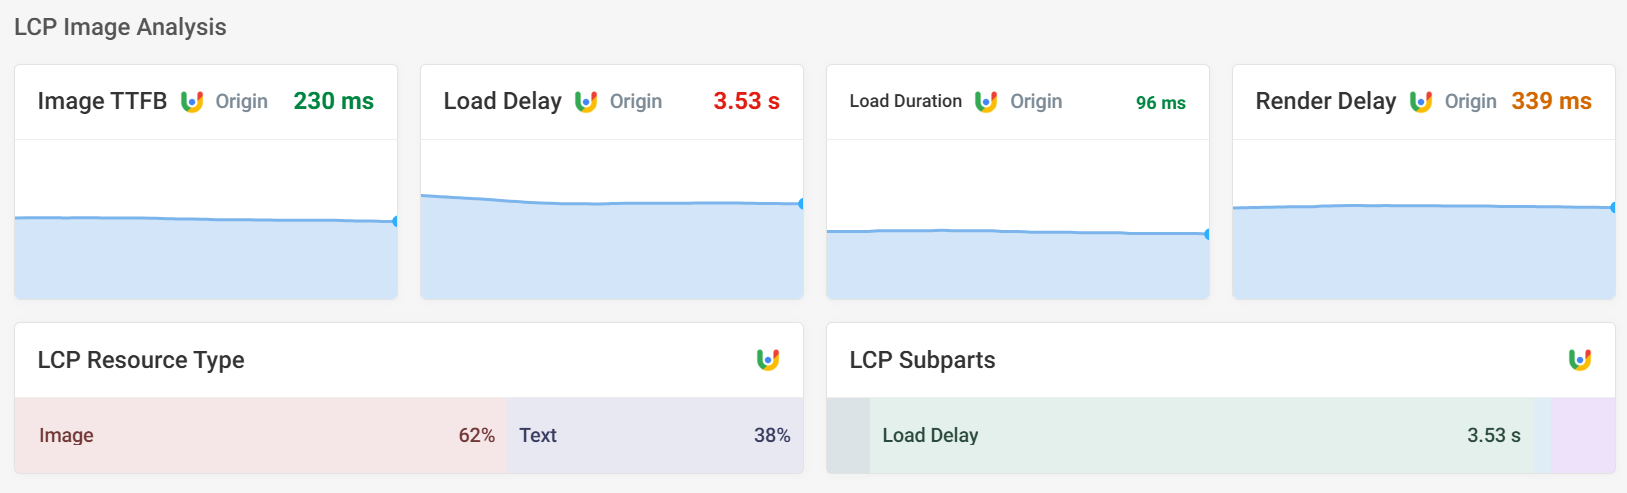
LCP Image Analysis
The LCP Image Analysis includes CrUX data for all four LCP Sub-parts:
- Image TTFB
- Load Delay
- Load Duration
- Render Delay
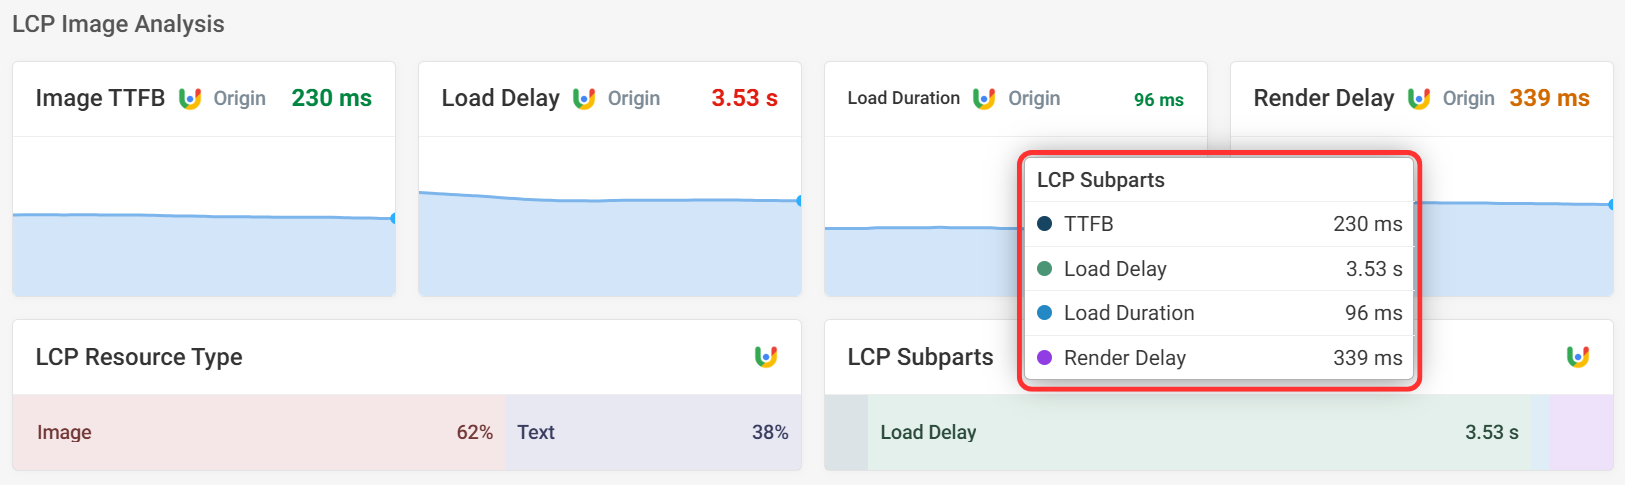
Also included is a breakdown of the LCP Resource Type, indicating how often the LCP element is an image or text element.
Hovering over the LCP Sub-parts breakdown will show the timings for each sub-part.
Additional Web Vitals
More CrUX metrics are included in the Additional Web Vitals section, including Round Trip Time and the Good CrUX score.
The Good (CrUX) value indicates roughly how many users had a good experience on your website. It's based on the lowest good experience rating across the three Core Web Vitals, and you should aim for a "Good" score over 75%.
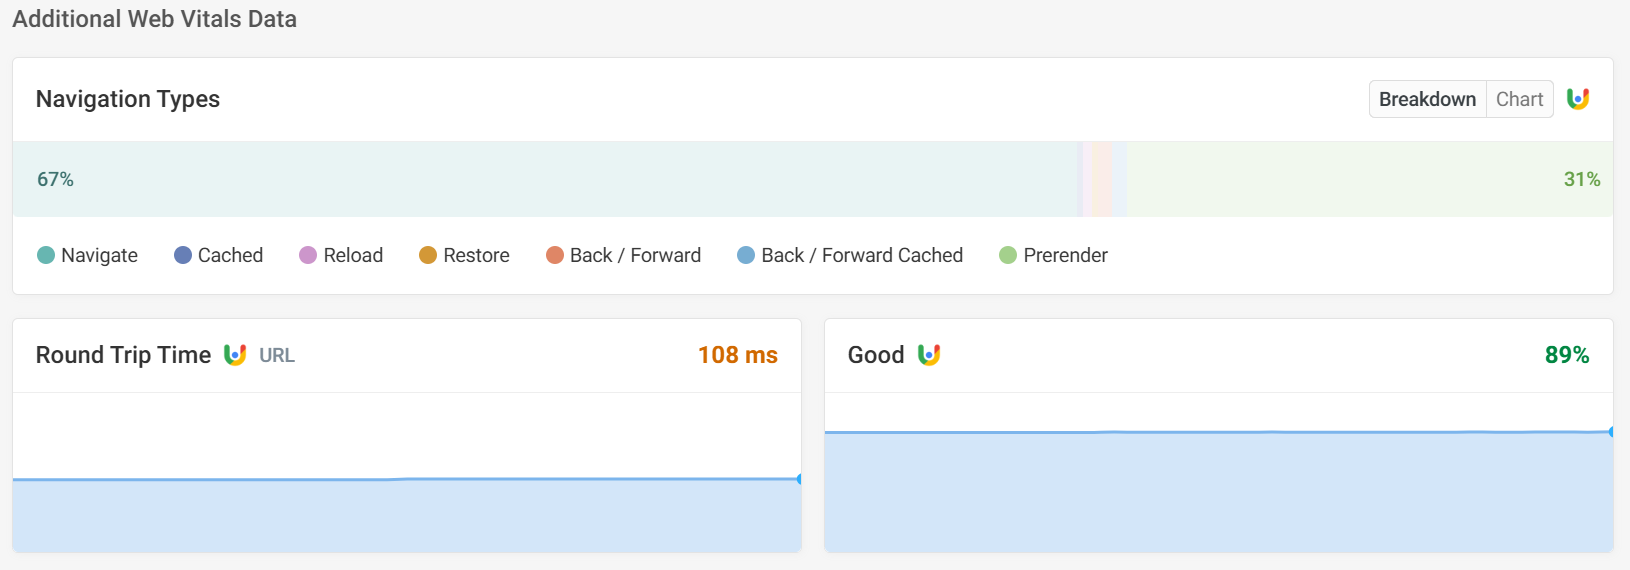
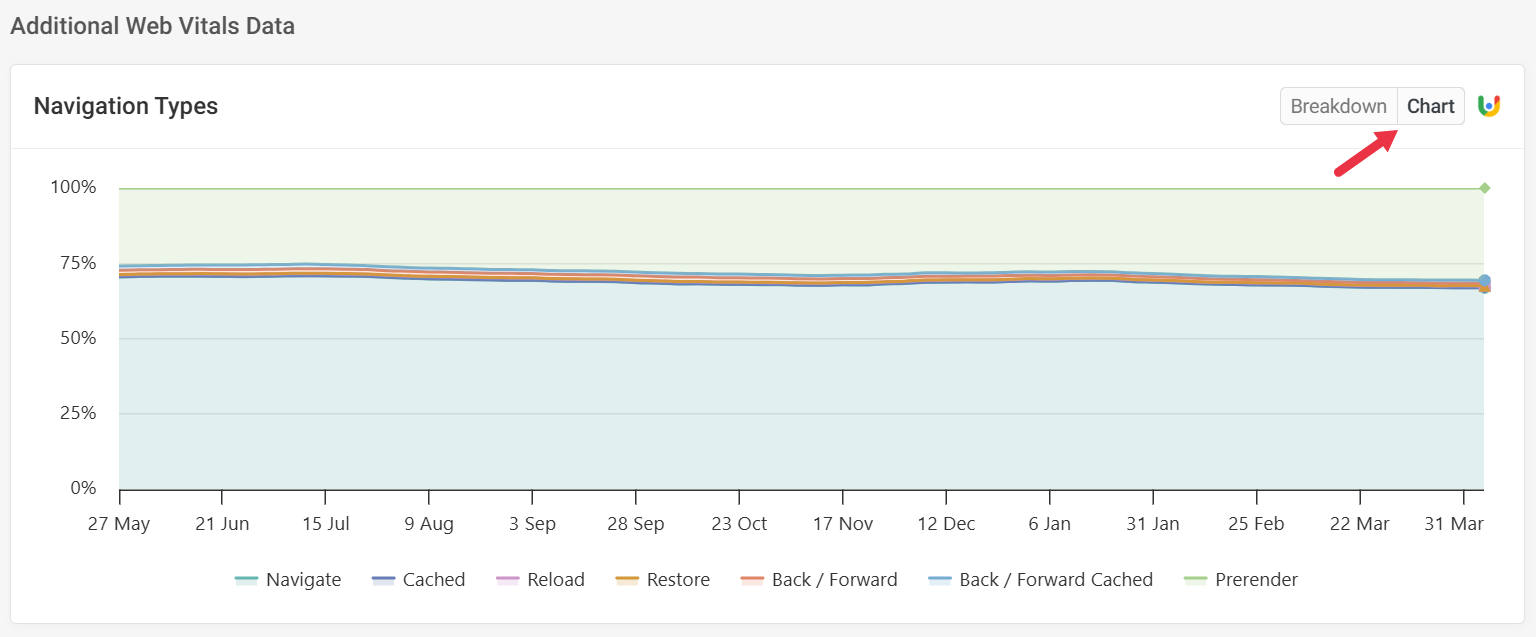
Navigation type indicates how a page was loaded. This helps analyze LCP by revealing whether slow loads are tied to fresh visits or specific navigation behaviors such as reloads or cached restores.
The chart view can be enabled in the top right corner.
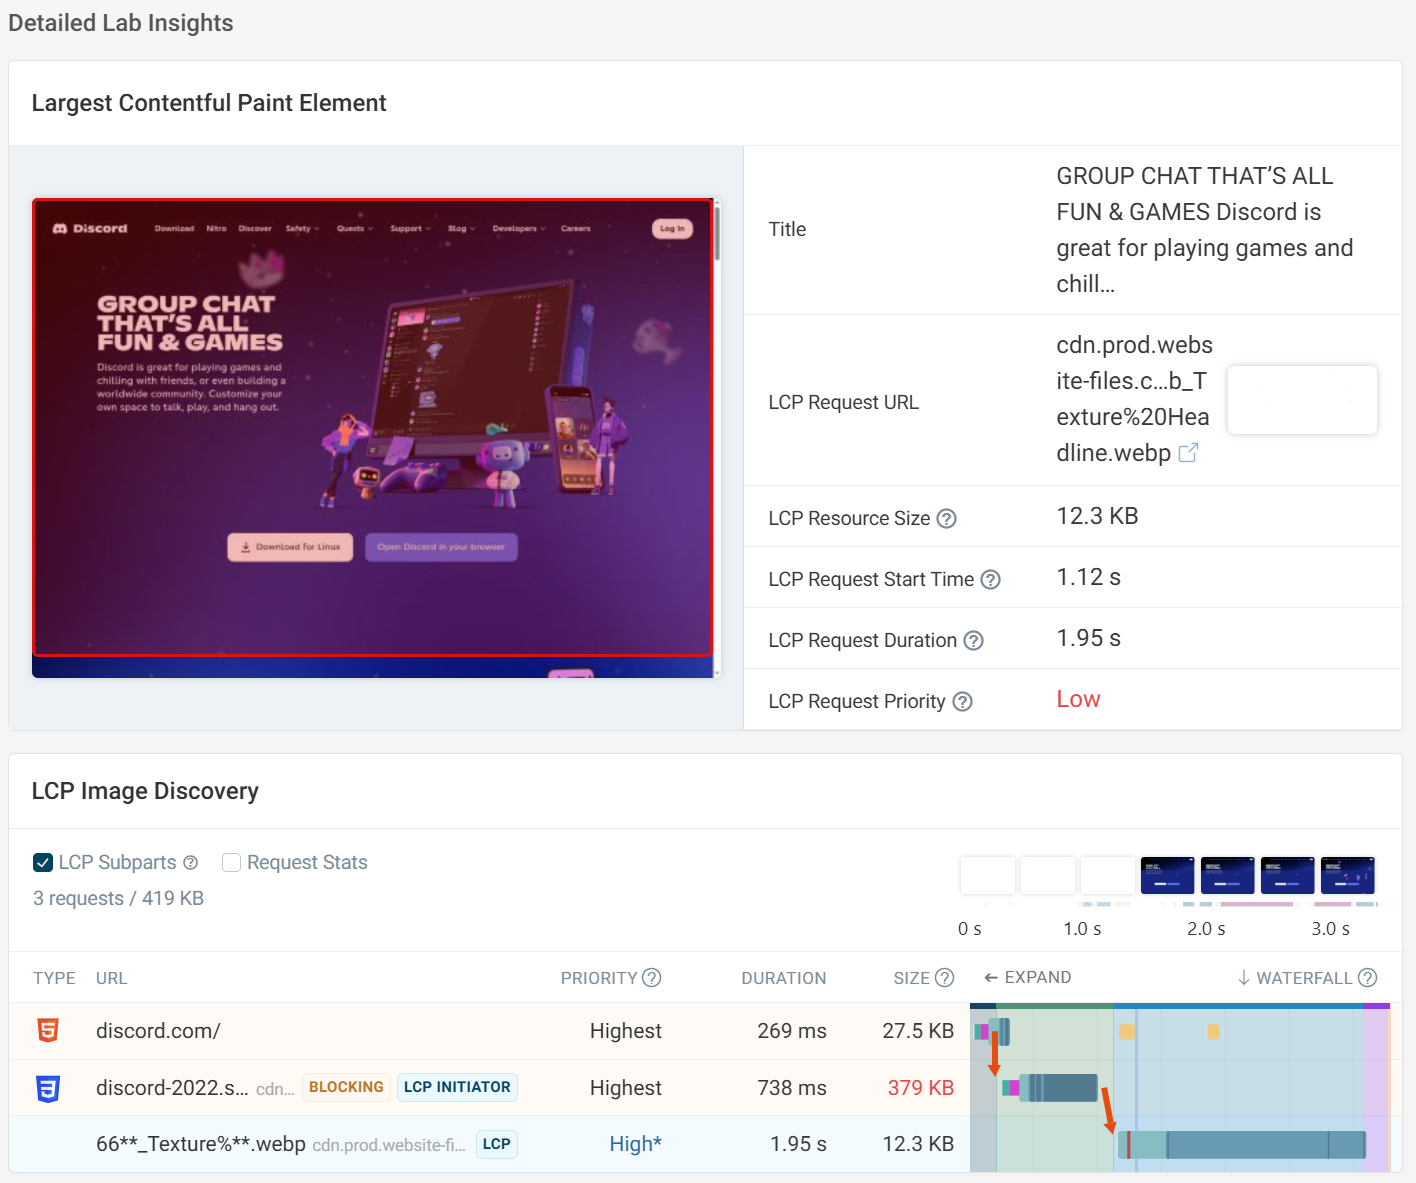
Detailed Lab Insights
Detailed Lab Insights provide more details on the LCP element, including a screenshot, priority status, and sub-part breakdown from the lab test.
The LCP Image Discovery shows an isolated request waterfall for the LCP element, helping identify any requests that could delay the image from rendering sooner, such as render-blocking stylesheets and LCP initiators.
The LCP sub-part measurements are highlighted in color on the request waterfall to better visualize which sub-part could be improved. This is enabled by default and can be toggled off with the LCP Sub-parts checkbox.
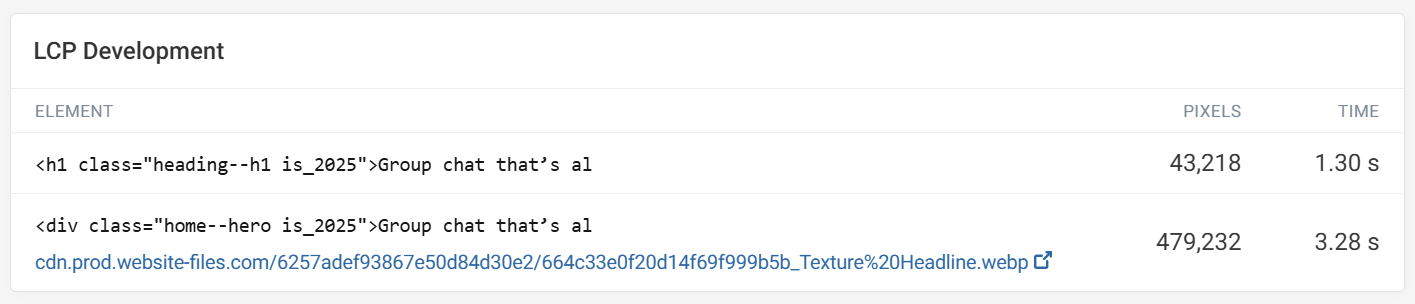
The LCP Development shows which elements are identified as the LCP element throughout the page load. At the end of the test, the largest element will be selected as the final LCP element.
Displaying the sizes and timings of each element is useful, as in some cases slightly larger elements may render later in the page load, such as consent banners, causing the LCP score to increase dramatically.
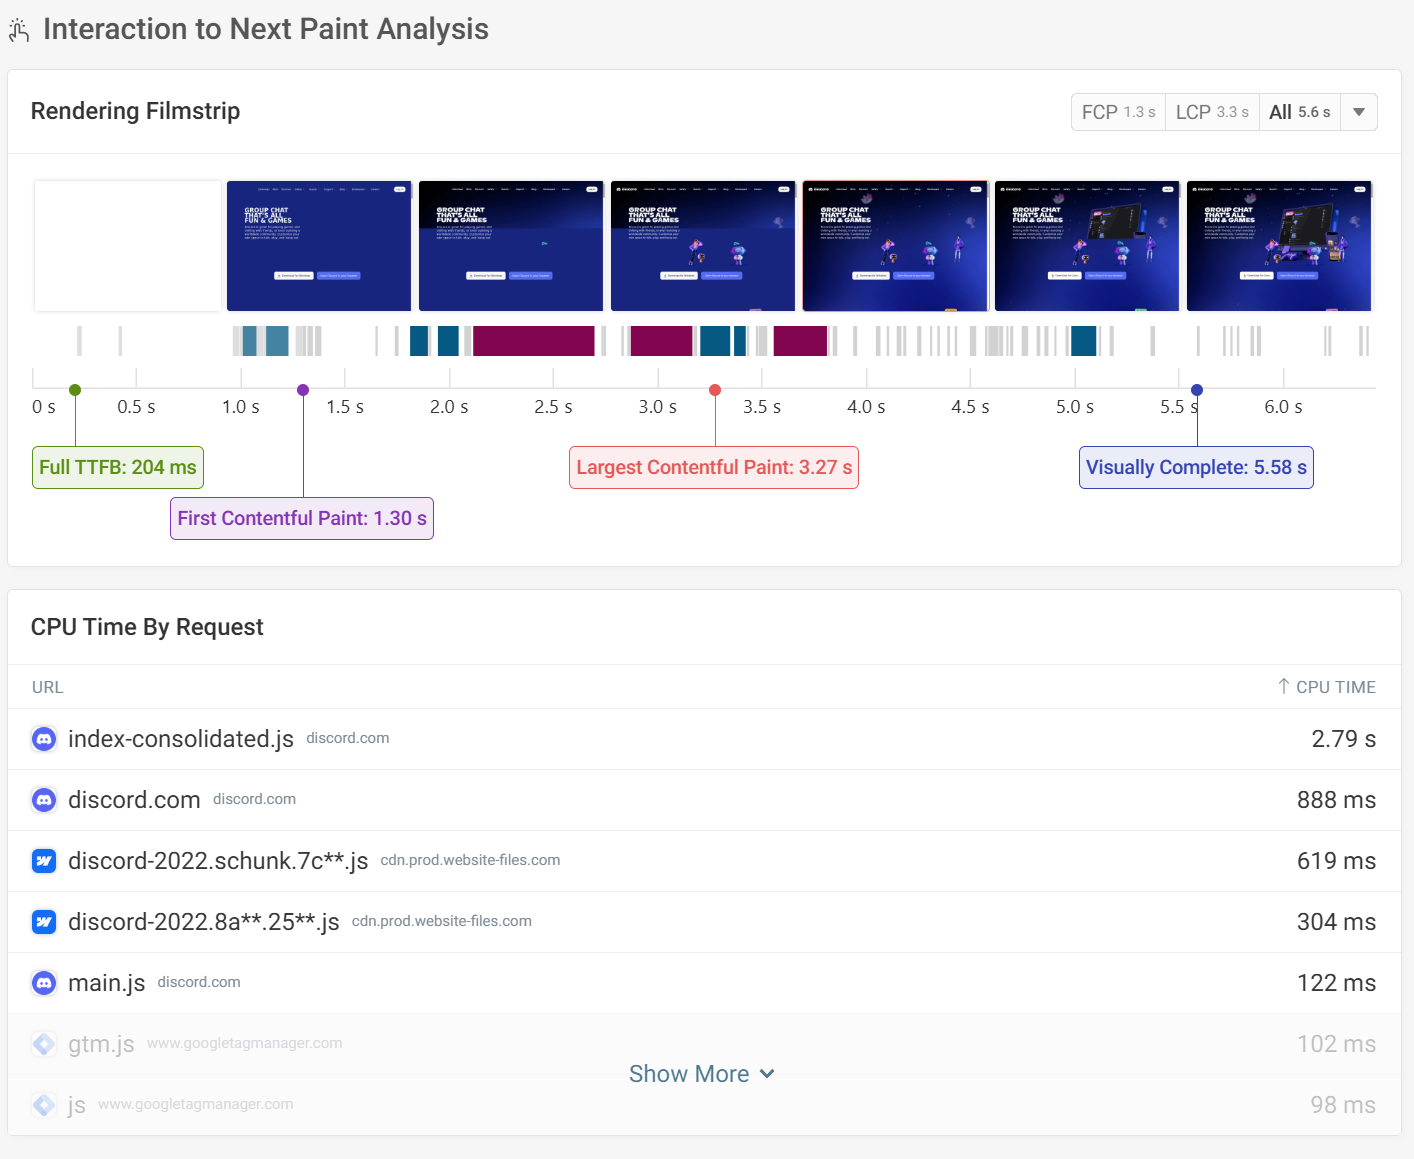
Interaction to Next Paint Analysis
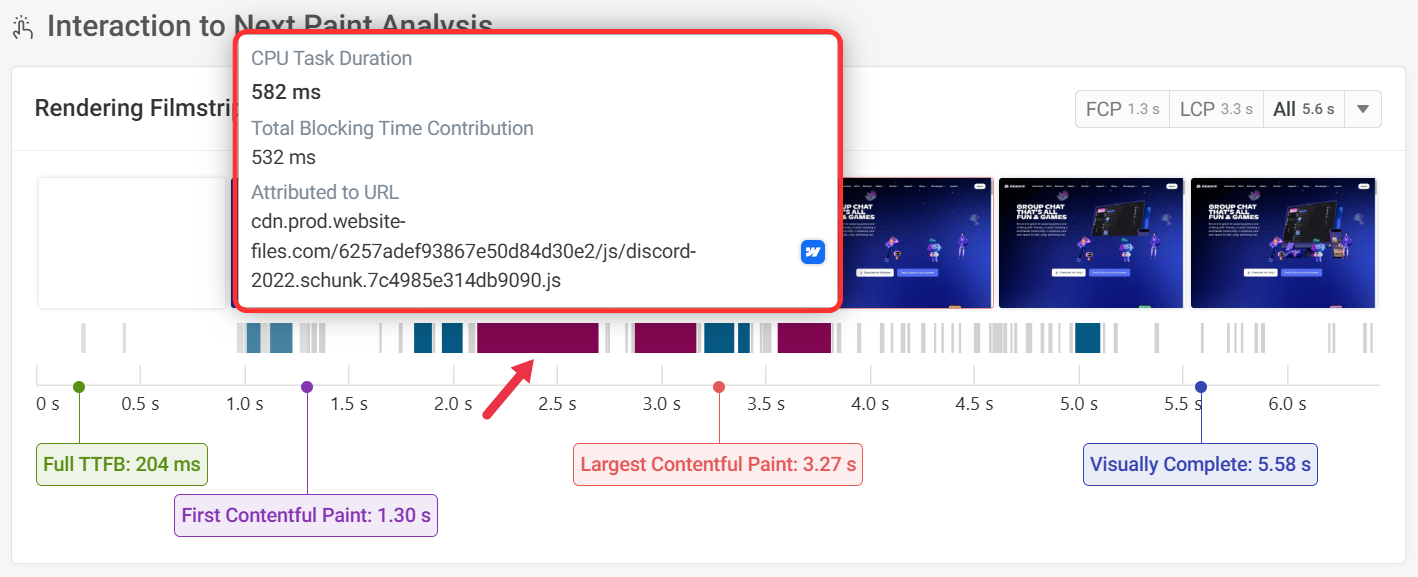
The Interaction to Next Paint Analysis shows the rendering filmstrip, highlighting CPU tasks below. The purple indicators are Total Blocking Time (TBT) contributions. Any CPU task above 50 ms contributes to TBT.
If a user interacts with the page during these moments, they may have a slow experience, impacting INP scores.
Scripts are ordered by length of CPU time in the table below.
Hovering over the TBT indicators will provide more details on the TBT duration and related script.
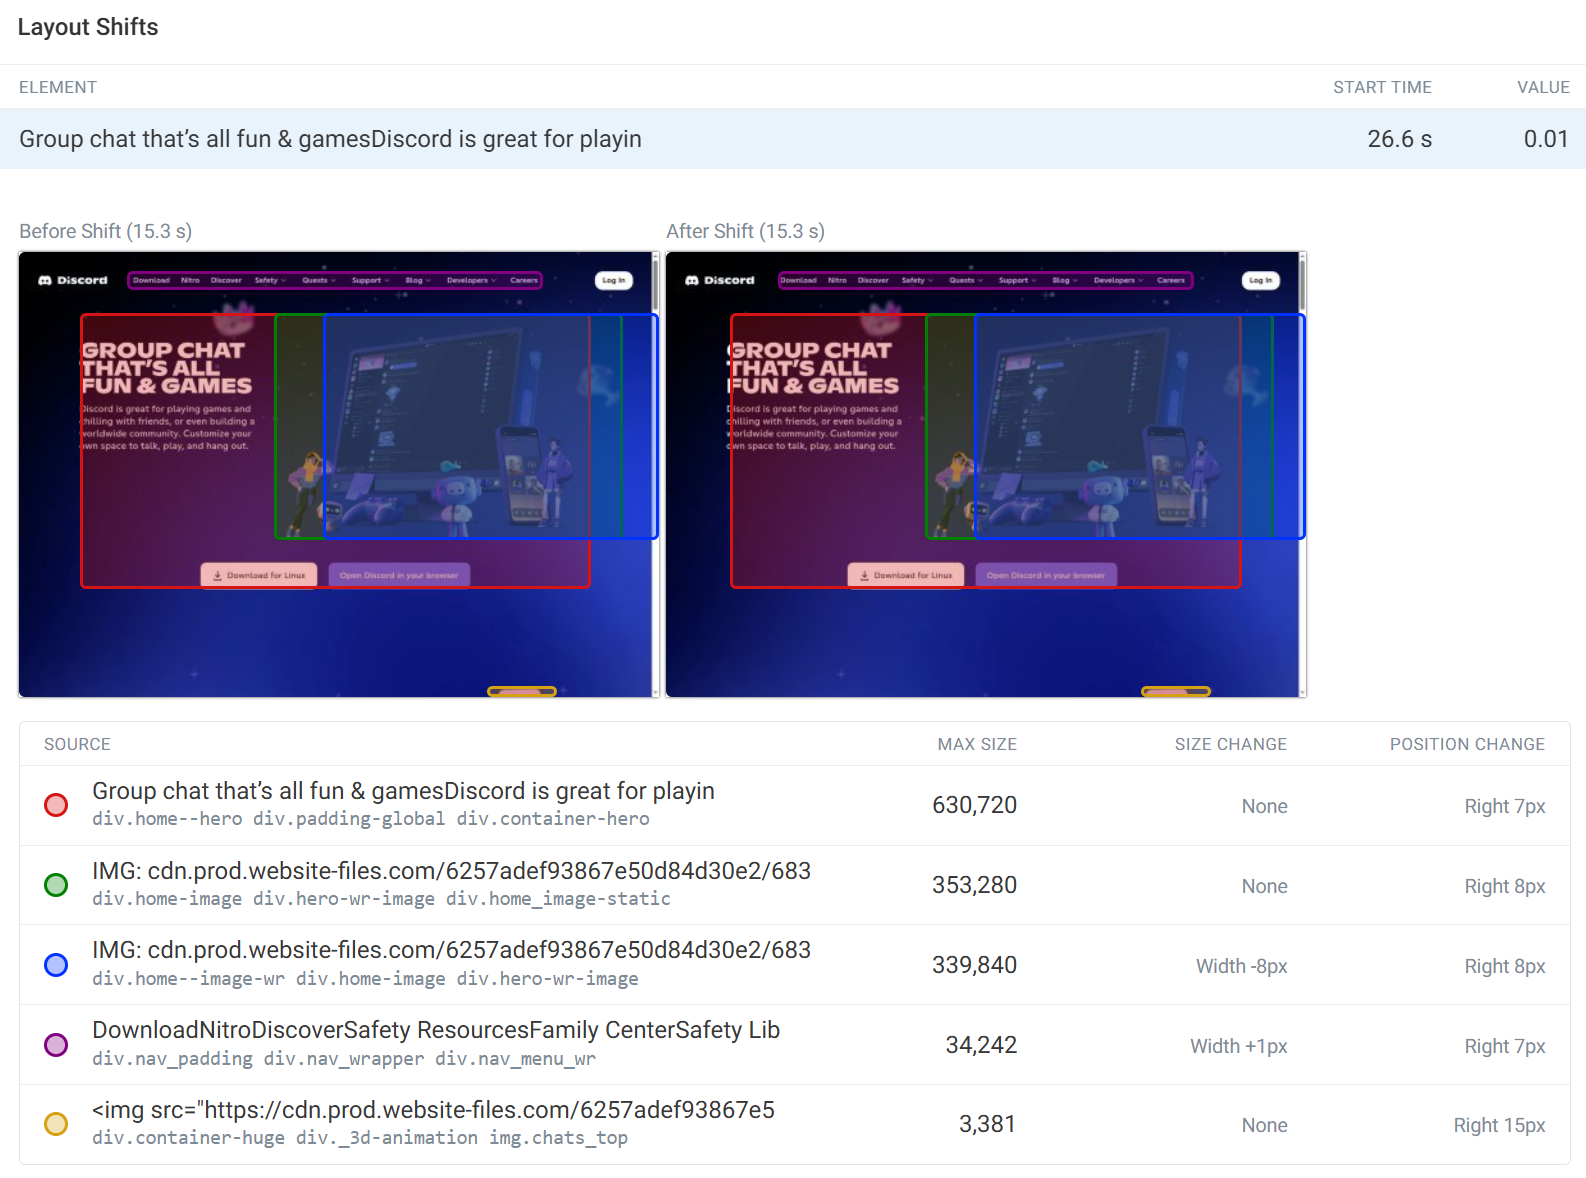
Cumulative Layout Shift Analysis
Any layout shifts that occur during the test are highlighted in the table, showing the shift start time and value.
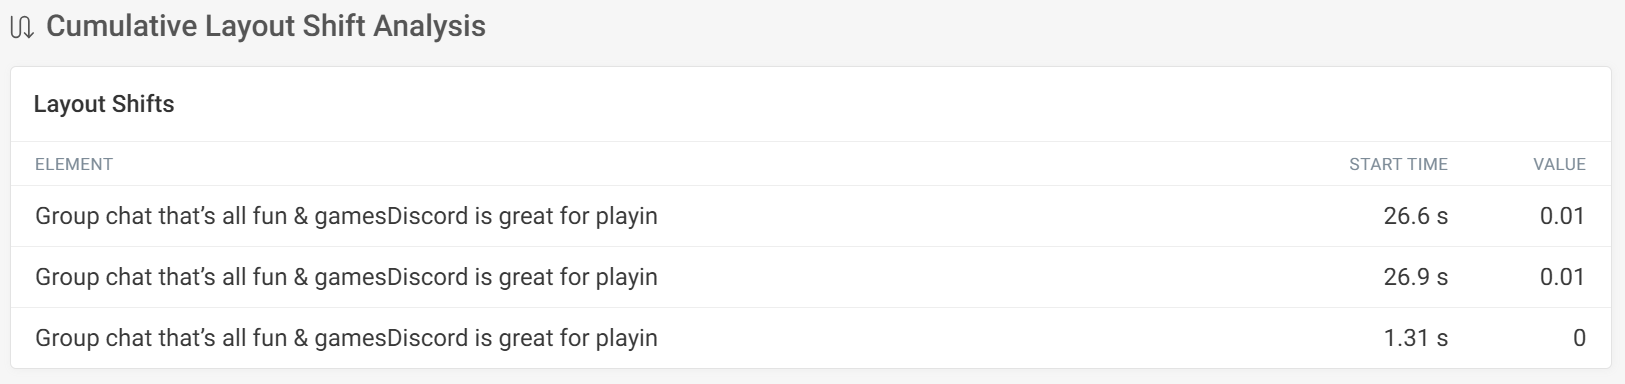
Clicking into a shift will show before and after screenshots, with the moving elements highlighted and a breakdown of position and size changes below.