
YSlow is a site speed testing tool that was first released in 2007. It analyzes your website to identify potential performance optimizations.
While YSlow still powers testing services like Pingdom there are more modern alternatives available today. In this article we'll look at some of the free tools you can use to test your website speed today.
DebugBear Website Speed Test
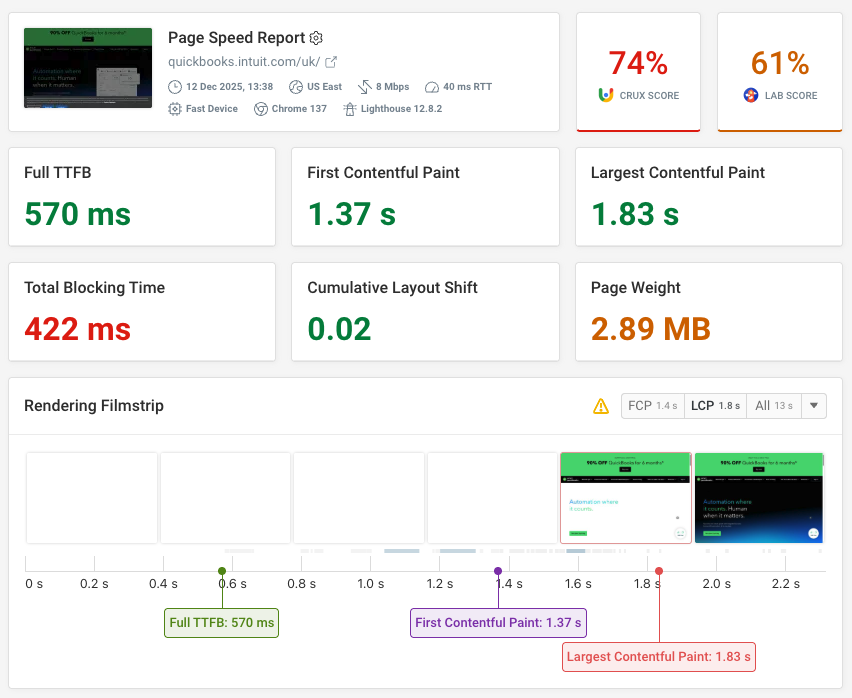
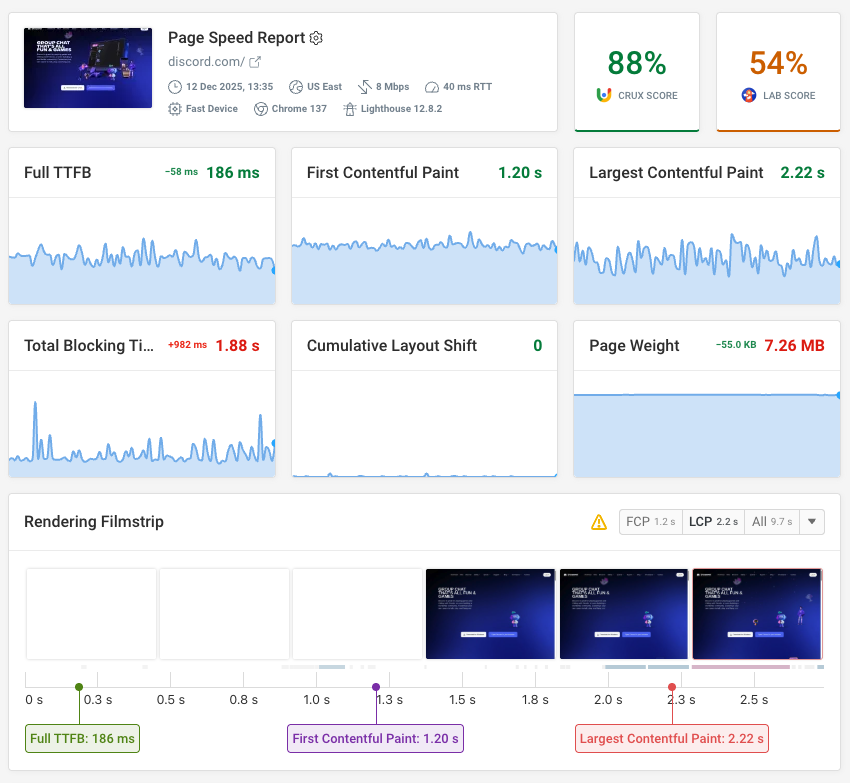
DebugBear's website speed test is a free tool that tells you how your website is loading for visitors and what you can do to optimize it.
It shows various page speed metrics, including Google's Core Web Vitals metrics. These are also shown as annotations to the rendering filmstrip, which shows how the page loaded frame by frame.
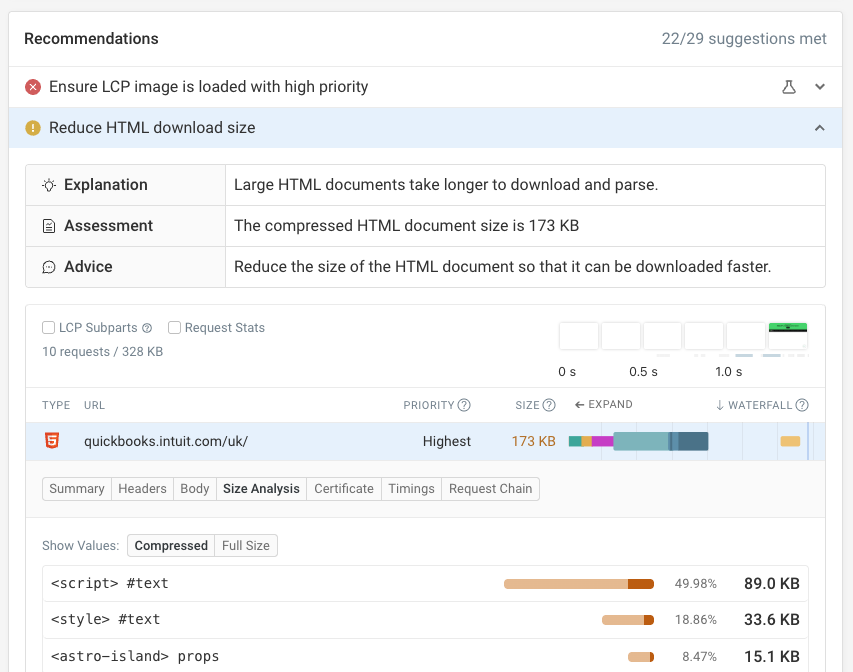
The test result also includes a number of performance recommendations you can use to improve your website speed.
For example, DebugBear identifies when important images are not prioritized correctly or when the HTML document is oversized.
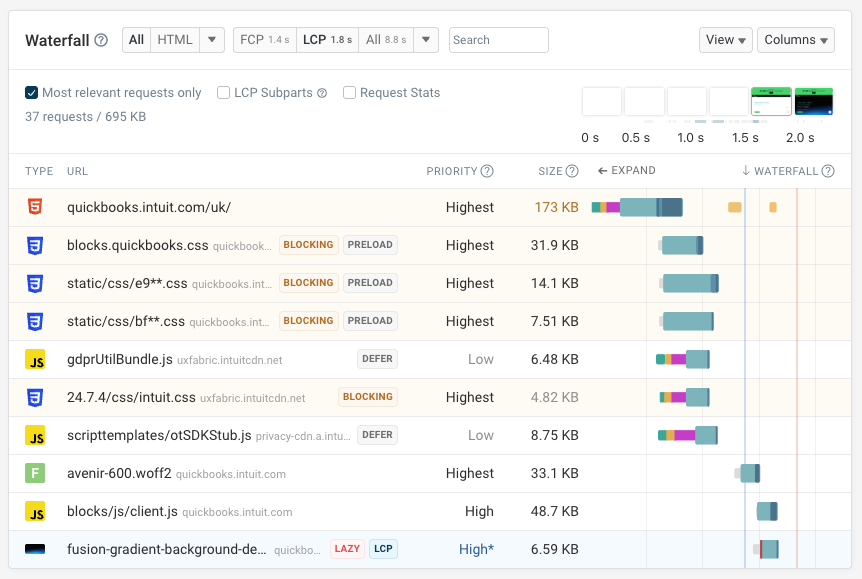
The request waterfall view shows you when different page resources loaded and how that impacts the visual page load process.
You can also easily view additional information for each request:
- The request priority and resource size
- Whether the request is render-blocking
- Whether scripts are deferred
- Whether images are lazy loaded
- What request is responsible for the main image
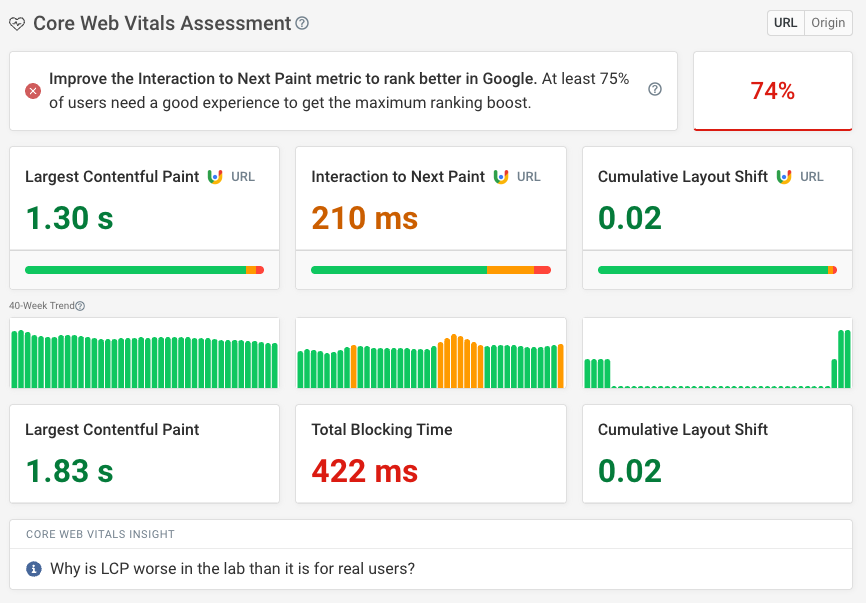
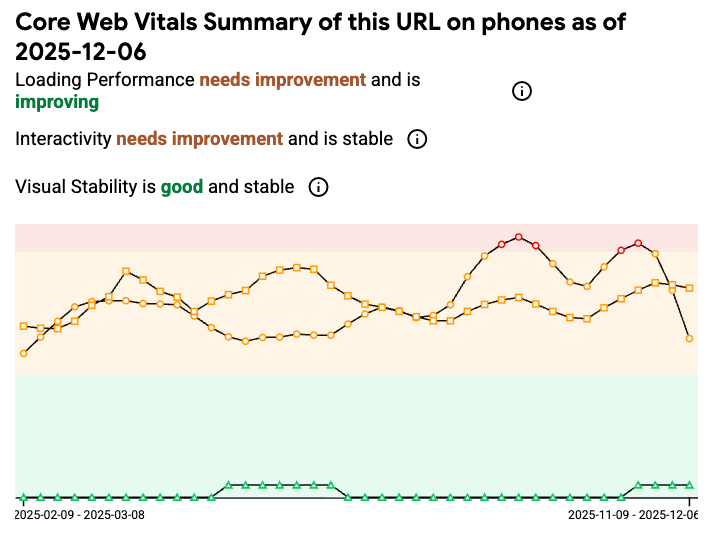
Finally, the Web Vitals tab also provides insights into real visitor experience based on the Chrome User Experience Report (CrUX):
- Is your website passing Google's Core Web Vitals assessment?
- How have your scores changed over the last 40 weeks?
- How does page load time break down into different components?
- Is there room to speed up page reloads or back/forward navigations?
Overall, the DebugBear page speed test is a modern alternative to YSlow that can give you detailed insights to speed up your website.
PageSpeed Insights
Google's PageSpeed Insights tool is a great starting point for measuring website performance. Like DebugBear it combines CrUX data with detailed on-demand tests.
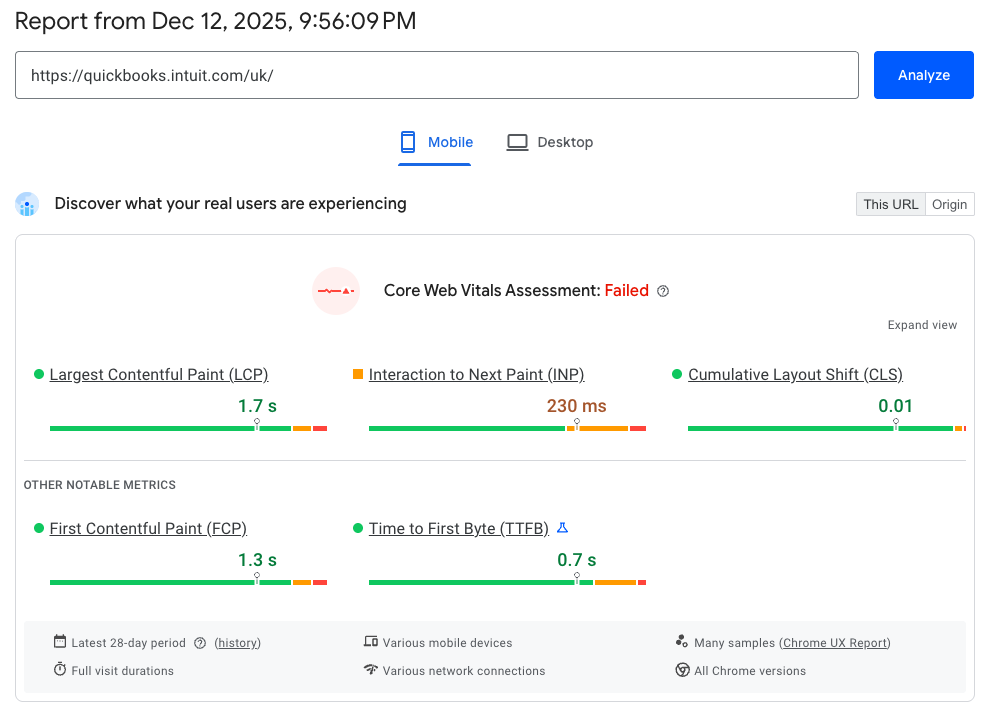
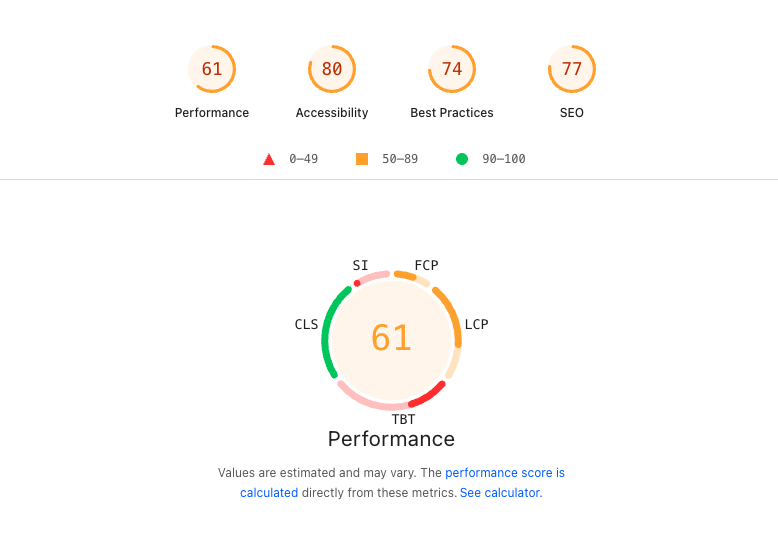
PageSpeed Insights assigns your website a performance score between 0 and 100. This is based on 5 different subscores:
- Largest Contentful Paint: When the main page content becomes visible
- First Contentful Paint: When the first content appears on the page
- Speed Index: How quickly content is visually displayed during page load
- Cumulative Layout Shift: Visual stability, whether content shifts around on the page
- Total Blocking Time: Measures how long the main thread is blocked from responding to user input
On top of checking performance, PageSpeed Insights also reports scores for Accessibility and on-page SEO.
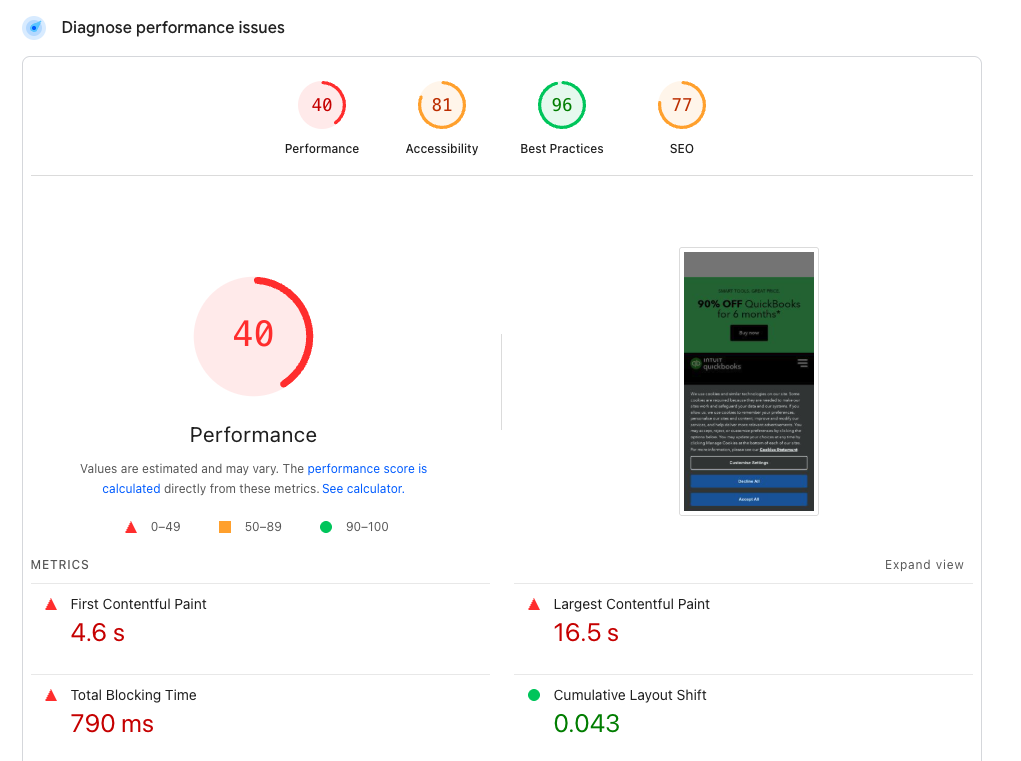
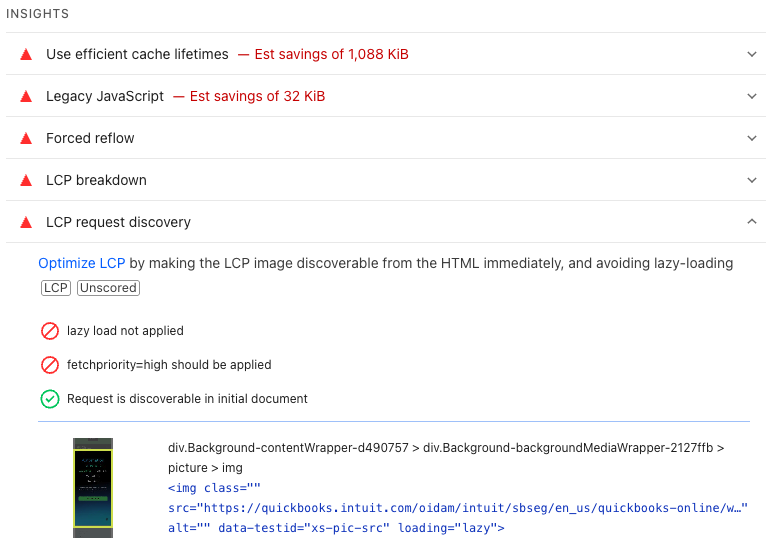
The performance diagnostics can provide detailed suggestions on what's slowing down your website.
For example, the LCP request discovery audit tells you whether the browser can quickly start loading the main image that's responsible for the Largest Contentful Paint rendering milestone.
Our detailed guide to using PageSpeed Insights explains how to interpret the metrics reported by Google and how to fix the issues that it highlights.
The performance score data in PageSpeed Insights isn't always reliable due to how the tool estimates performance on slower connections.
Chrome DevTools
Google's Chrome browser comes with powerful built-in developer tools. Over the last two years Google has also done a lot of work to improve the performance testing features offered by Chrome.
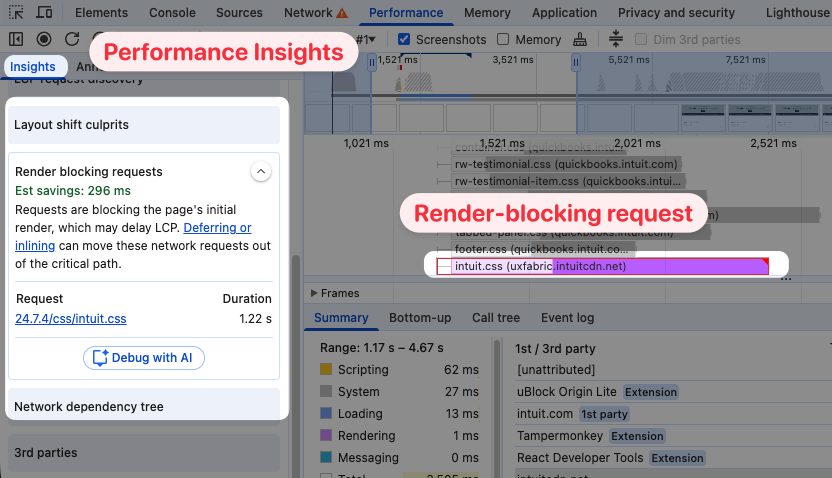
For example, when you open the DevTools Performance tab you can now quickly see the Core Web Vitals metrics and start debugging page load time.
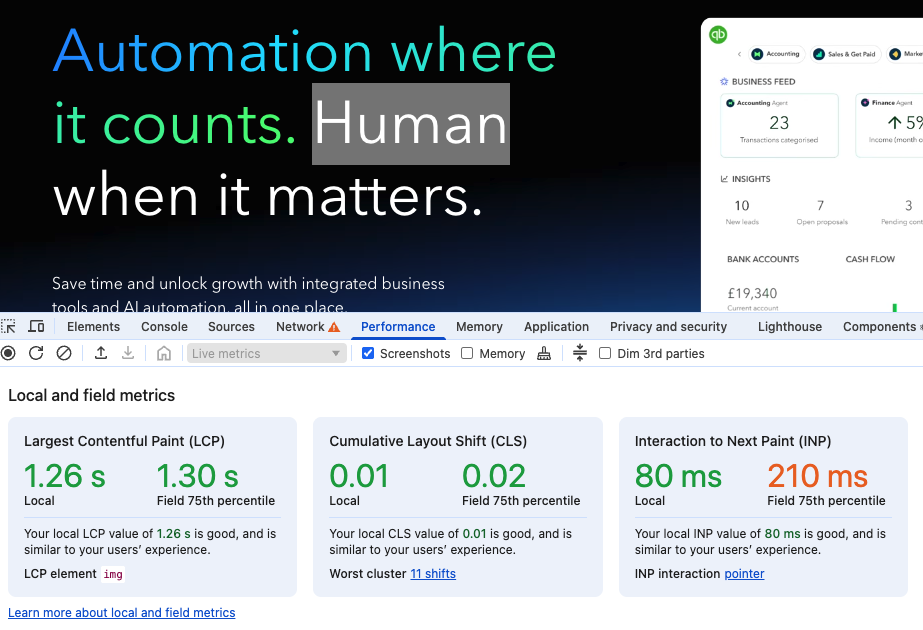
The Performance profile is a powerful way to analyze page load delays and slow interactions. The performance insights help you quickly identify optimizations on the page.
DevTools also provides in-depth insights into CPU processing work and JavaScript execution time. This is especially important for investigating single page application performance.
Other features of Chrome DevTools include:
- Throttling the network connection
- Debugging JavaScript code
- Viewing errors and warnings in the browser console
- Inspecting network requests
WebPageTest
WebPageTest has long been an advanced performance testing tool, and it describes itself as the "gold standard in web performance optimization". A key strength of WebPageTest is the technical detail the tool can provide.
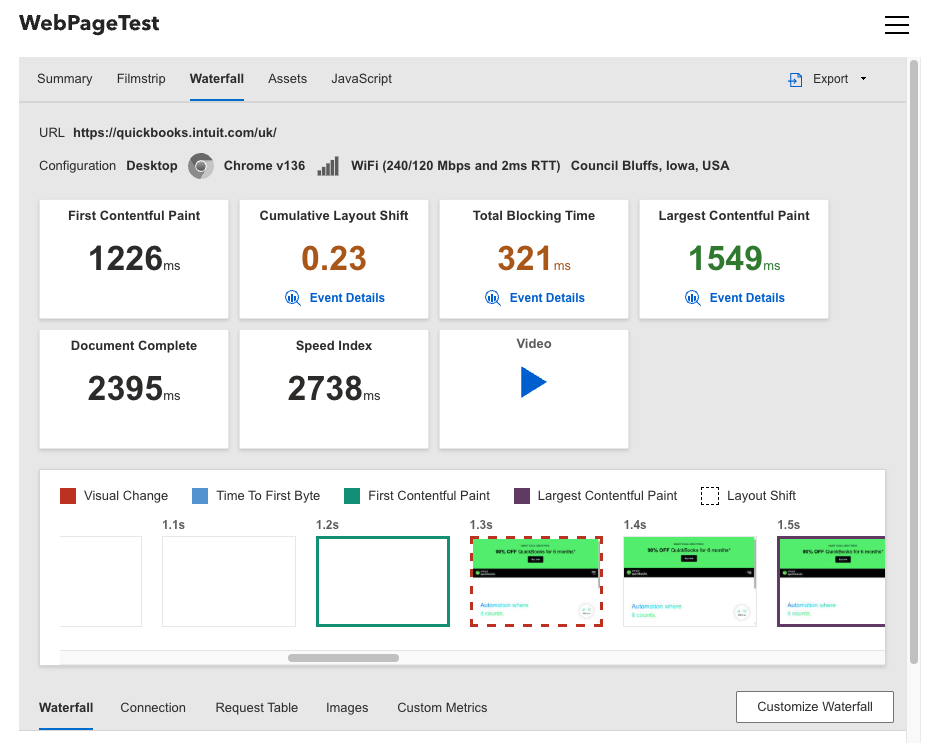
WebPageTest shows you key performance metrics and a rendering progress visualization for your website. You also get a detailed request waterfall where you can see how different resources contribute to the page load process.
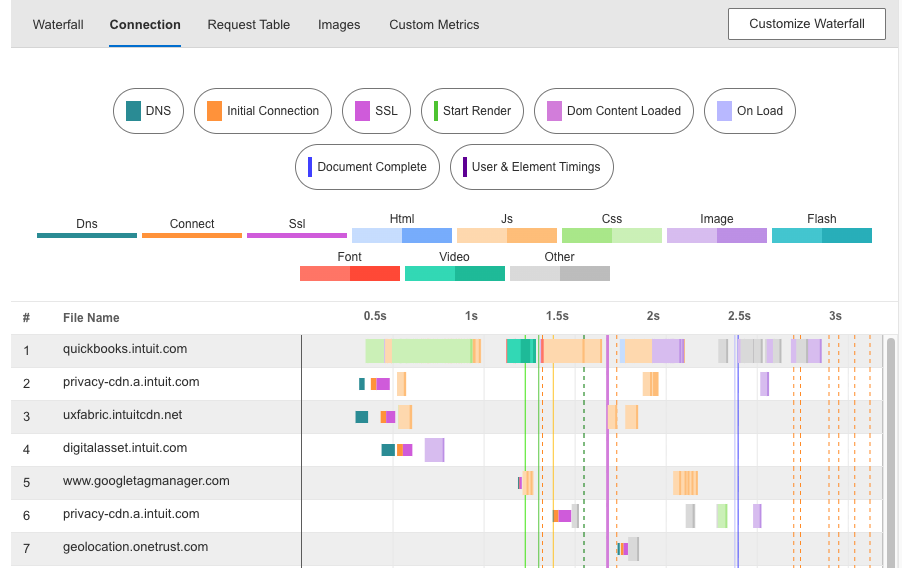
The connection view shows how different resources share the same server connections. It also makes it easier to see how network bandwidth is used when transferring different resources.
Here we can see how the browser loads files from different servers, and what network requests can share a connection.
Learn more about testing page speed with WebPageTest.
Google Lighthouse
Lighthouse is an open-source library by Google. It's actually integrated into many other tools like PageSpeed Insights, Chrome DevTools, and DebugBear.
You can also run Lighthouse through the command line interface or using Node.js. That lets developers build automated processes for performance testing and analysis.
For example, Unlighthouse is a Lighthouse-based tool that can scan your entire website for page speed issues.
CrUX Vis
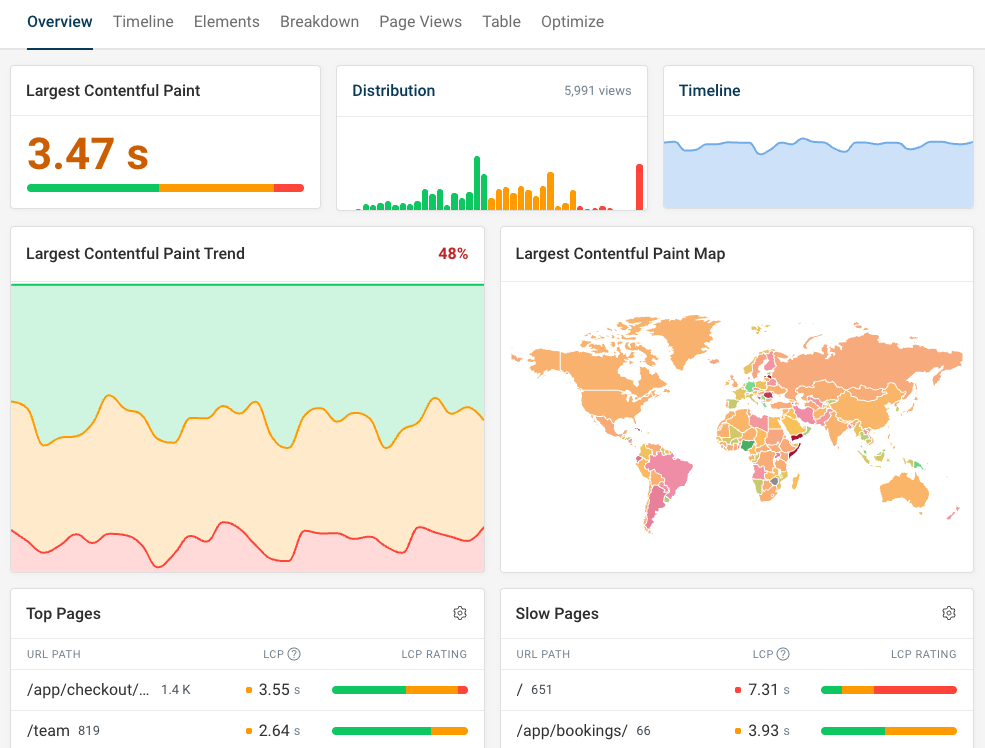
CrUX Vis is a Google tool that exclusively shows data from the Chrome User Experience Report.
It doesn't provide detailed diagnostics but instead focuses on real user experience and historical data.
Why is YSlow outdated?
YSlow was an early front-end performance testing tool, but it hasn't been updated in over 10 years. Today more modern alternatives exist that can provide more helpful reporting to help you optimize website performance.
Some of the suggestions that YSlow provides are also outdated today, as new technologies like HTTP/2 have become available.
Run continuous page speed tests
Site speed testing tools are great for getting a snapshot of your performance metrics and to find ways to improve performance. Website performance monitoring helps you stay on top of your page speed for the long term.
DebugBear helps you deliver a great visitor experience by providing continuous synthetic website monitoring and real-time visitor analytics.
You can quickly pick up when your page load time changes and compare test results to each other to see what caused the metric regression.
Real user monitoring shows you how fast your website really is for visitors. Track Core Web Vitals and other performance metrics over time, and inspect specific page visits to see how you can optimize the visitor experience.


Monitor Page Speed & Core Web Vitals
DebugBear monitoring includes:
- In-depth Page Speed Reports
- Automated Recommendations
- Real User Analytics Data