
Frontend observability tools help you monitor and analyze the performance, reliability, and user experience of your website.
Learn how different monitoring tools can help you optimize your website and deliver a great experience to visitors.
DebugBear
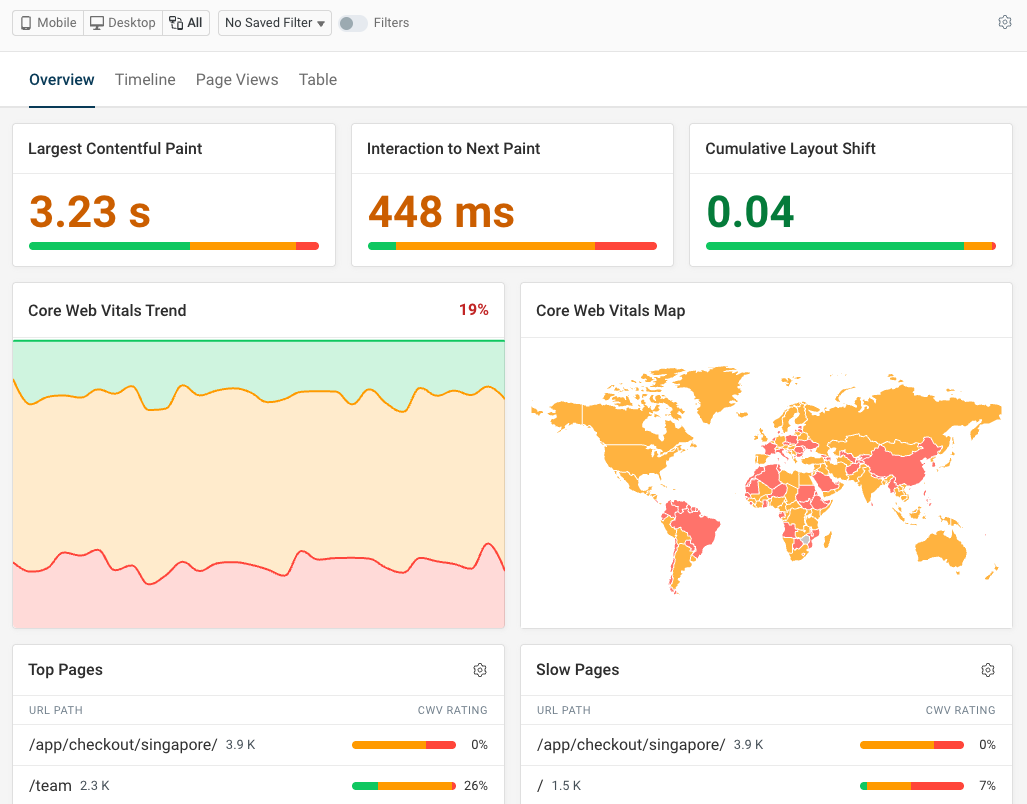
DebugBear's real user monitoring product can measure frontend performance, track errors, and provide insight into user behavior.
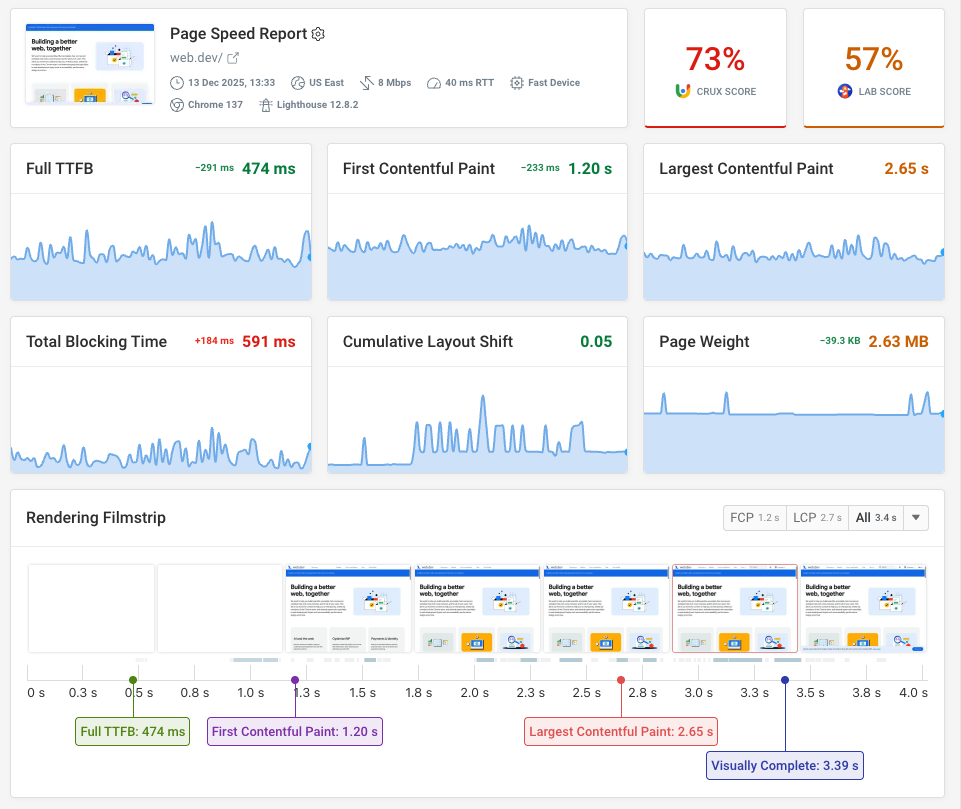
For example, you get a detailed dashboard for tracking Google's Core Web Vitals metrics, which analyze page load time, responsiveness to user interactions, and visual stability.
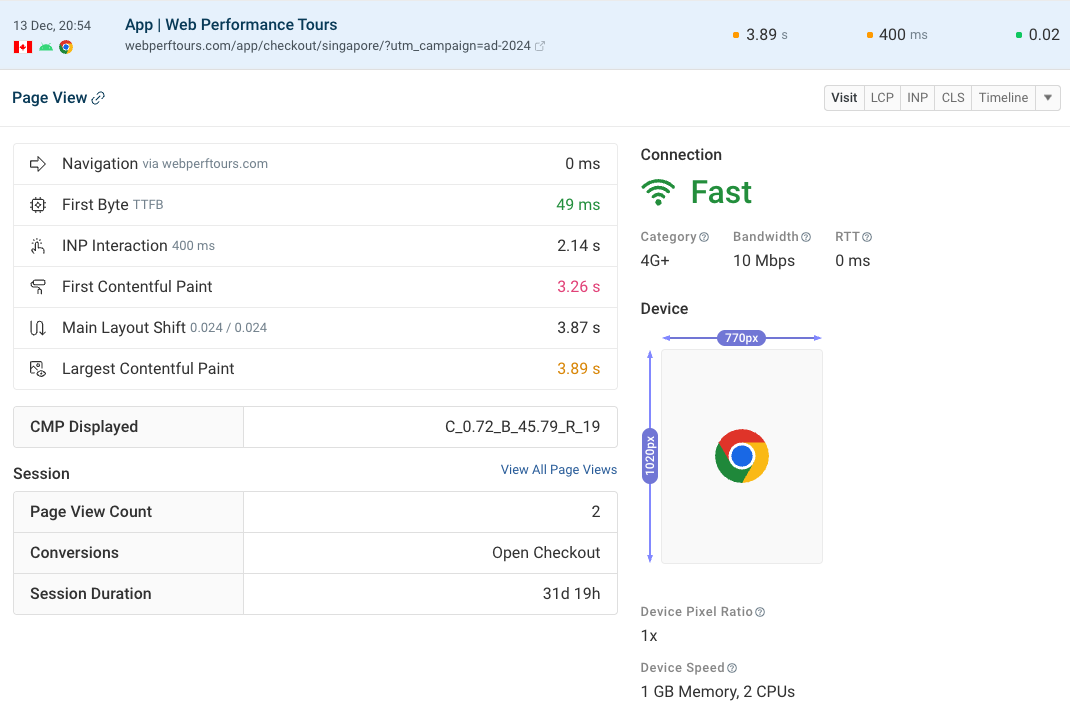
You can also inspect specific page views to learn more about the visitor and their experience. For example, you can see:
- Basic info like browser, country, or operating system
- Network bandwidth and latency
- Device characteristics like memory and CPU count
- The type of navigation (for example, a page reload or back/forward navigation)
DebugBear shows additional details for each performance metric and breaks the metric down into different components.
For example, for the Largest Contentful Paint metric you can see LCP subparts, what scripts delayed rendering, and what page element was responsible for the largest paint.
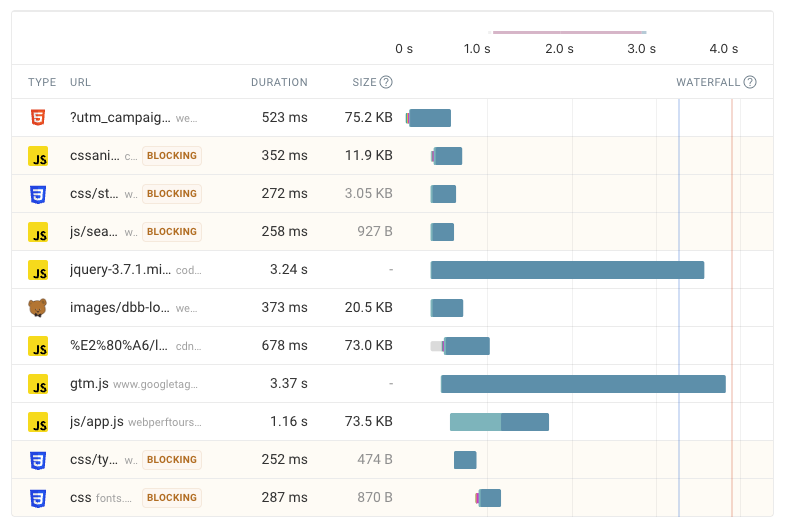
The request waterfall shows you when different page resources were loaded.
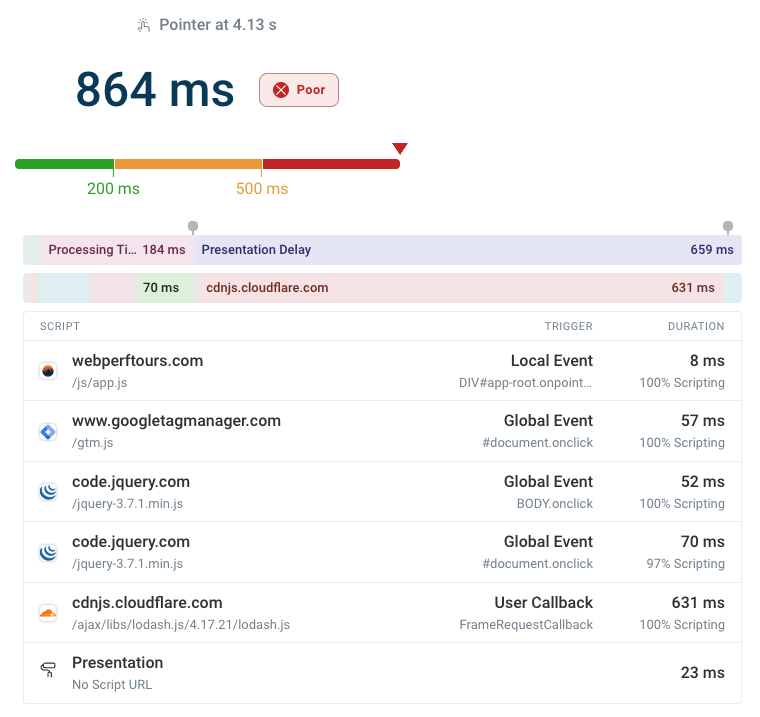
You can debug poor Interaction to Next Paint scores by checking when specific scripts ran during the interaction.
In this screenshot we see a requestAnimationFrame call that causes a large amount of presentation delay.
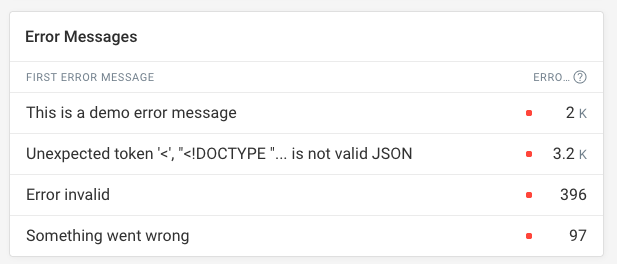
Check what errors are impacting users on your site. DebugBear lets you see how often different errors occur and what pages are affected.
You can also track user sessions to see how visitors navigate across your site.
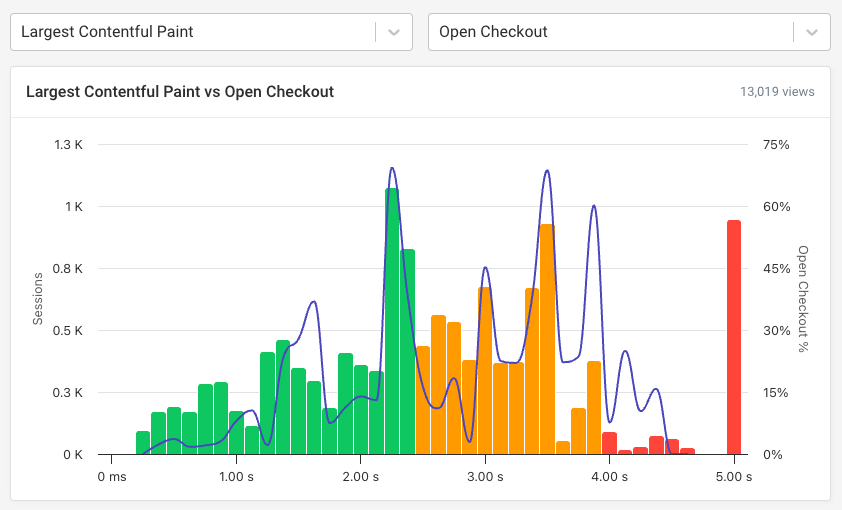
Conversion tracking lets you see how page speed and other UX metrics impact business outcomes.
Sentry
Sentry is an application monitoring platform that offers error tracking and performance monitoring. It's built to help developers identify and fix issues in their applications.
Sentry offers a number of framework-specific integrations for frontend observability, including support for React, Angular, Vue.js, and more.
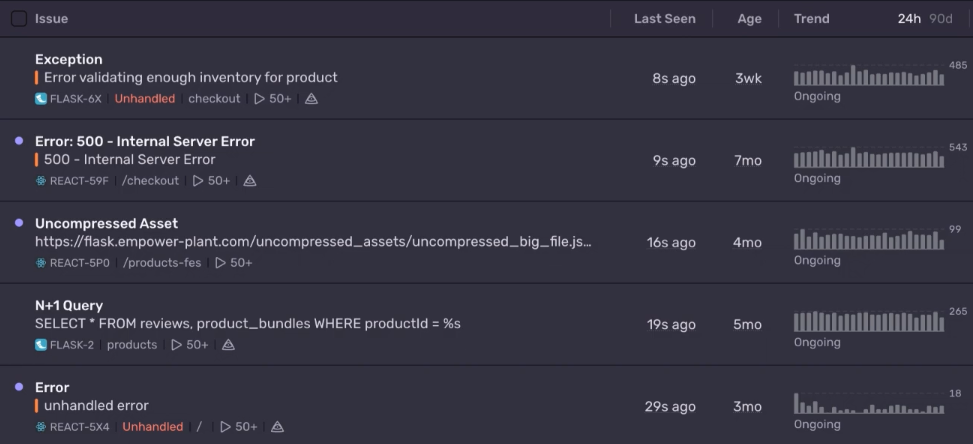
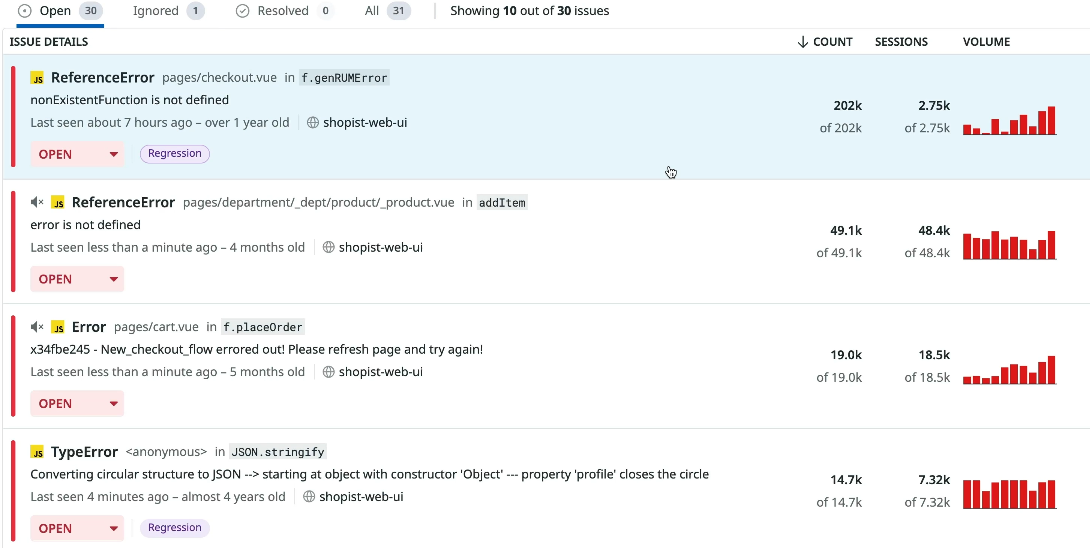
You can see how often different errors occur, when each error was first introduced, and when it was last seen.
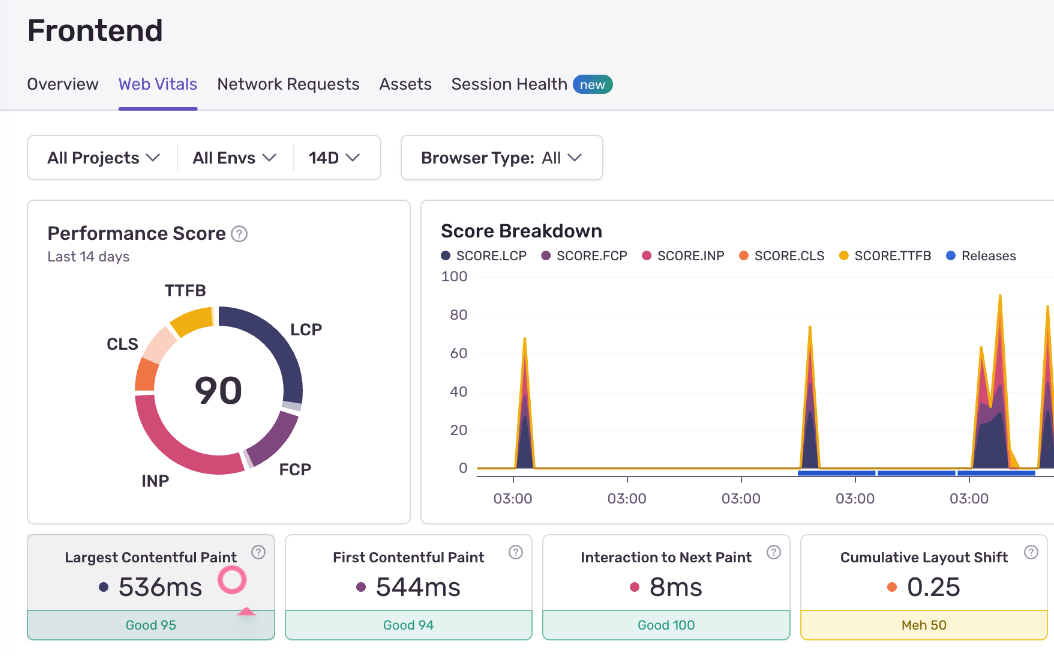
It also surfaces Google's Core Web Vitals metrics to help you analyze website performance and identify what's causing poor user experiences.
You can set up alerts in Sentry to get notified about new errors or performance issues.
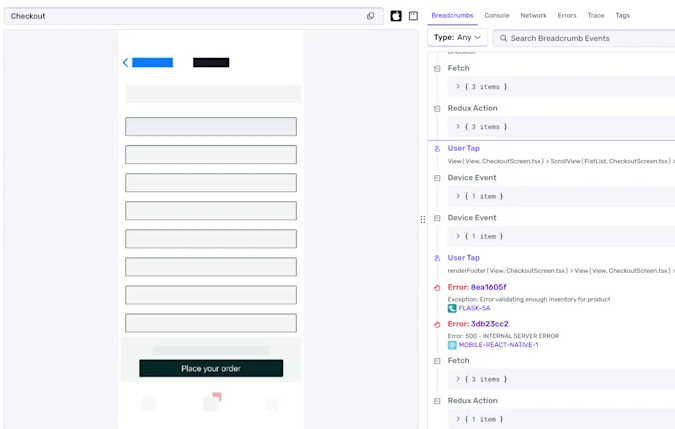
Sentry also lets you replay specific visitor sessions to see how they interacted with your site and what issues they encountered.
Rollbar
Rollbar is a dedicated error monitoring solution, covering frontend and backend errors. It integrates with your release process and lets you upload source maps for more readable error stack traces.

You can also send additional debug data to Rollbar to help diagnose issues, for example user actions or custom metadata. Rollbar collects console output to help you understand what might have led to a page error.
It also offers a session replay feature that lets you see how visitors interact with content on your website.
DataDog
DataDog is a comprehensive IT observability platform that includes frontend monitoring capabilities along with backend tracing, infrastructure monitoring, log management, and more.
It provides real user monitoring as part of its digital experience monitoring feature set.
DataDog provides detailed reporting for frontend JavaScript errors and lets you see if specific visitor segments are more impacted by specific issues.
You can inspect individual visitor sessions in detail and see how certain network requests impacted overall page load time.
SigNoz
SigNoz is an open-source observability platform based on OpenTelemetry. It provides a foundation for comprehensive frontend and backend monitoring.
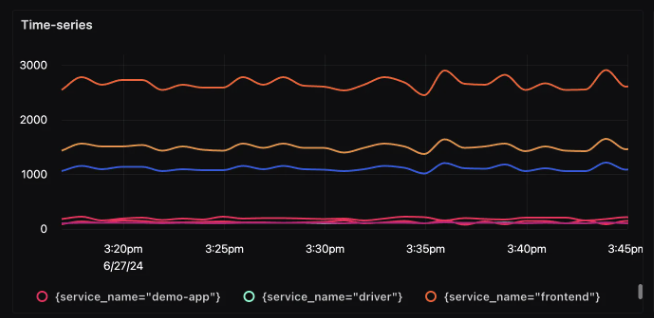
You can report metrics or trace data to SigNoz and analyze it in-depth with flexible analytics dashboards.
What is frontend observability?
Frontend observability tools help you get insights into issues impacting your visitors. They also provide detailed debug data to help developers understand what's causing problems and how to fix them.
Common observability features include:
- Core Web Vitals monitoring
- JavaScript error tracking
- Session replay
- Performance tracing
- User behavior analytics
Monitoring vs. observability
The key to a good observability solution is that it provides in-depth reporting built to help you fix problems quickly. In contrast, monitoring tools often focus on alerting and high-level metric tracking.
Observability tools collect more detailed data and guide you through the debugging process.
Fix front-end performance and UX on your website
DebugBear is a frontend observability service that helps you monitor and improve your website's performance and user experience.
It combines real user monitoring with detailed synthetic tests to help you identify and fix issues before they impact your users. Sign up for a free trial.


Monitor Page Speed & Core Web Vitals
DebugBear monitoring includes:
- In-depth Page Speed Reports
- Automated Recommendations
- Real User Analytics Data