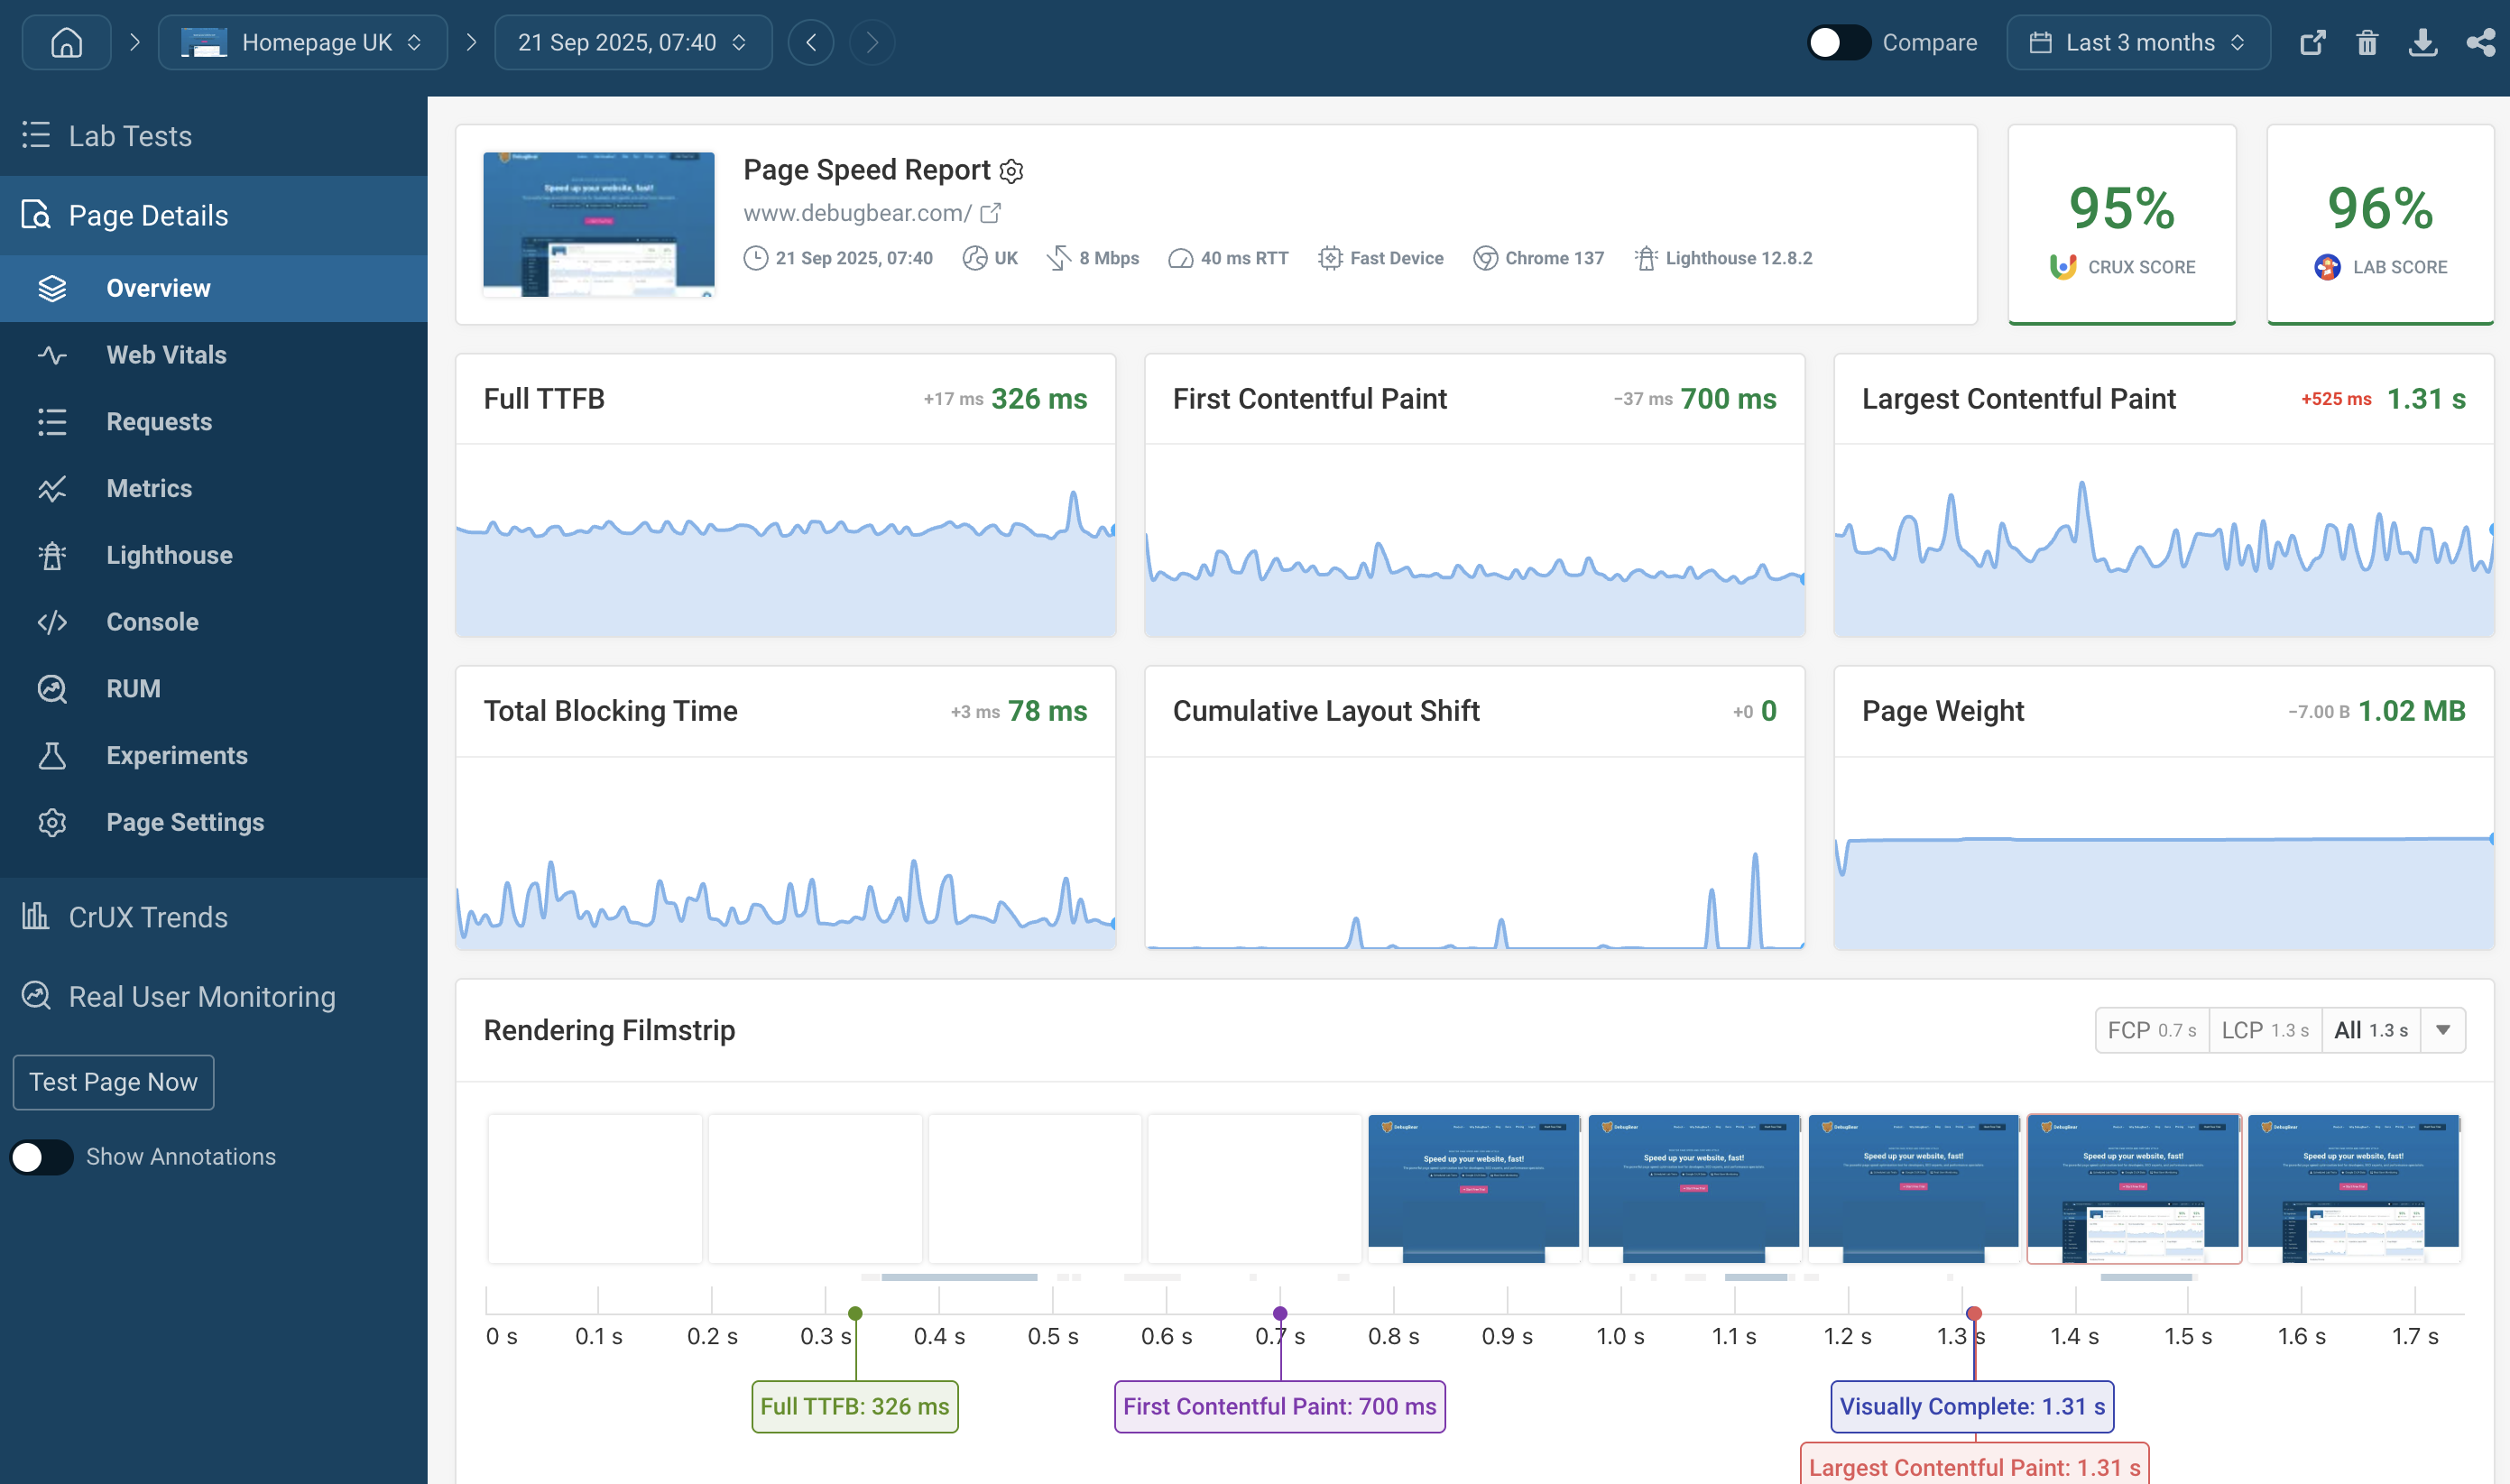
DebugBear runs tests on a schedule, visualizes site speed over time, and alerts you when there’s a performance regression.
Monitor Google Lighthouse scores
DebugBear builds on top of Google Lighthouse but expands on it with detailed debug data and high-quality data.
Track Google Core Web Vitals
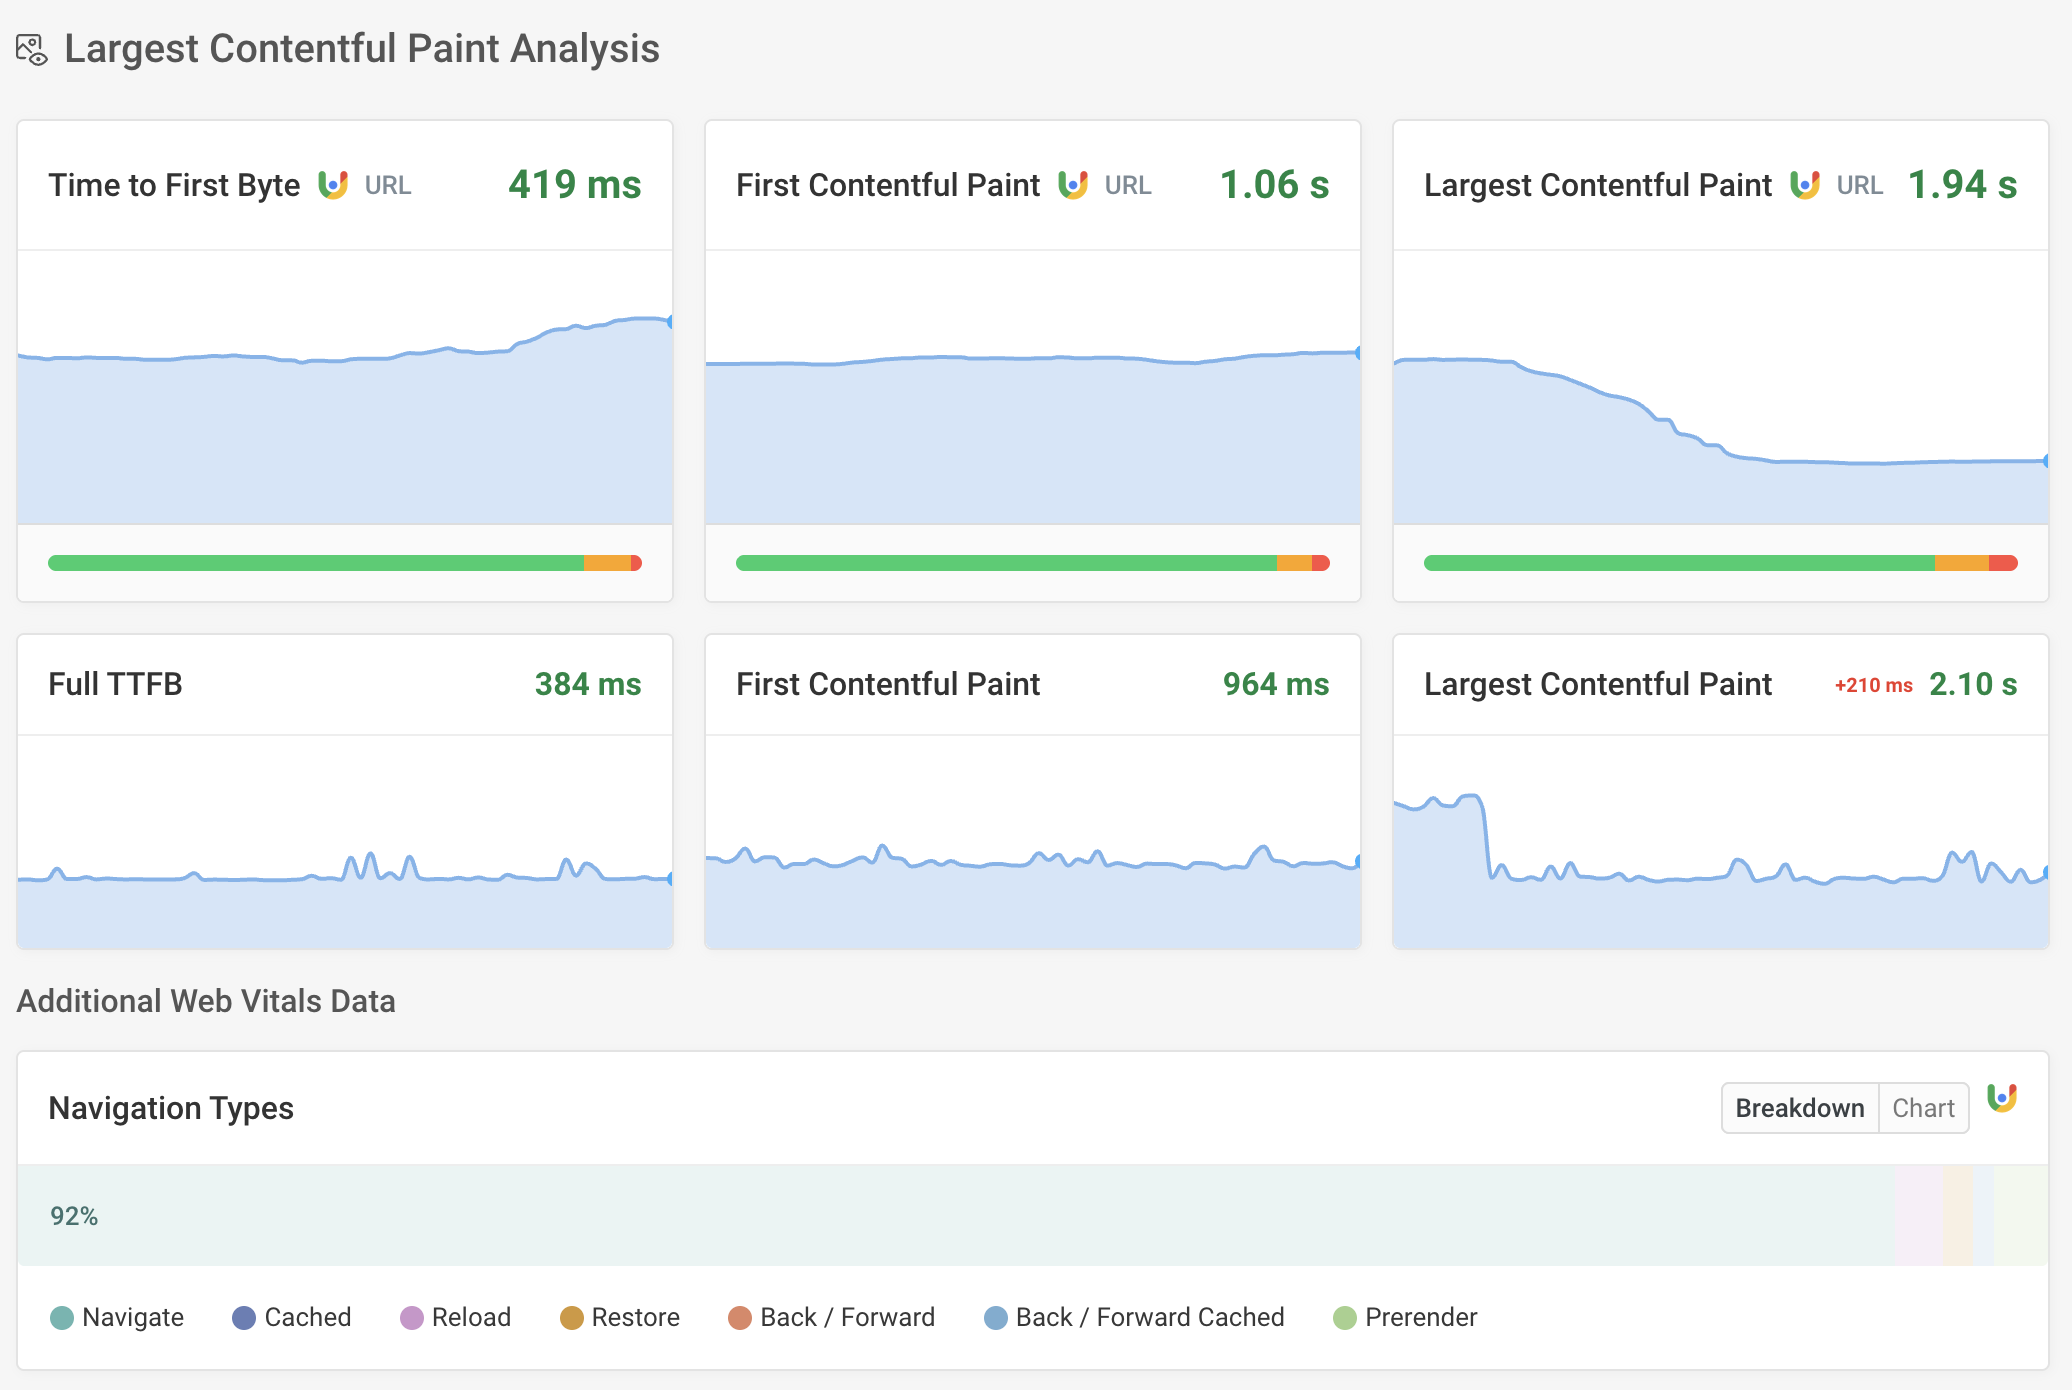
Core Web Vitals field data
DebugBear uses Google's Chrome User Experience Report (CrUX)
to show how real user experience your website.
This is important, as it's what Google uses in its search rankings.
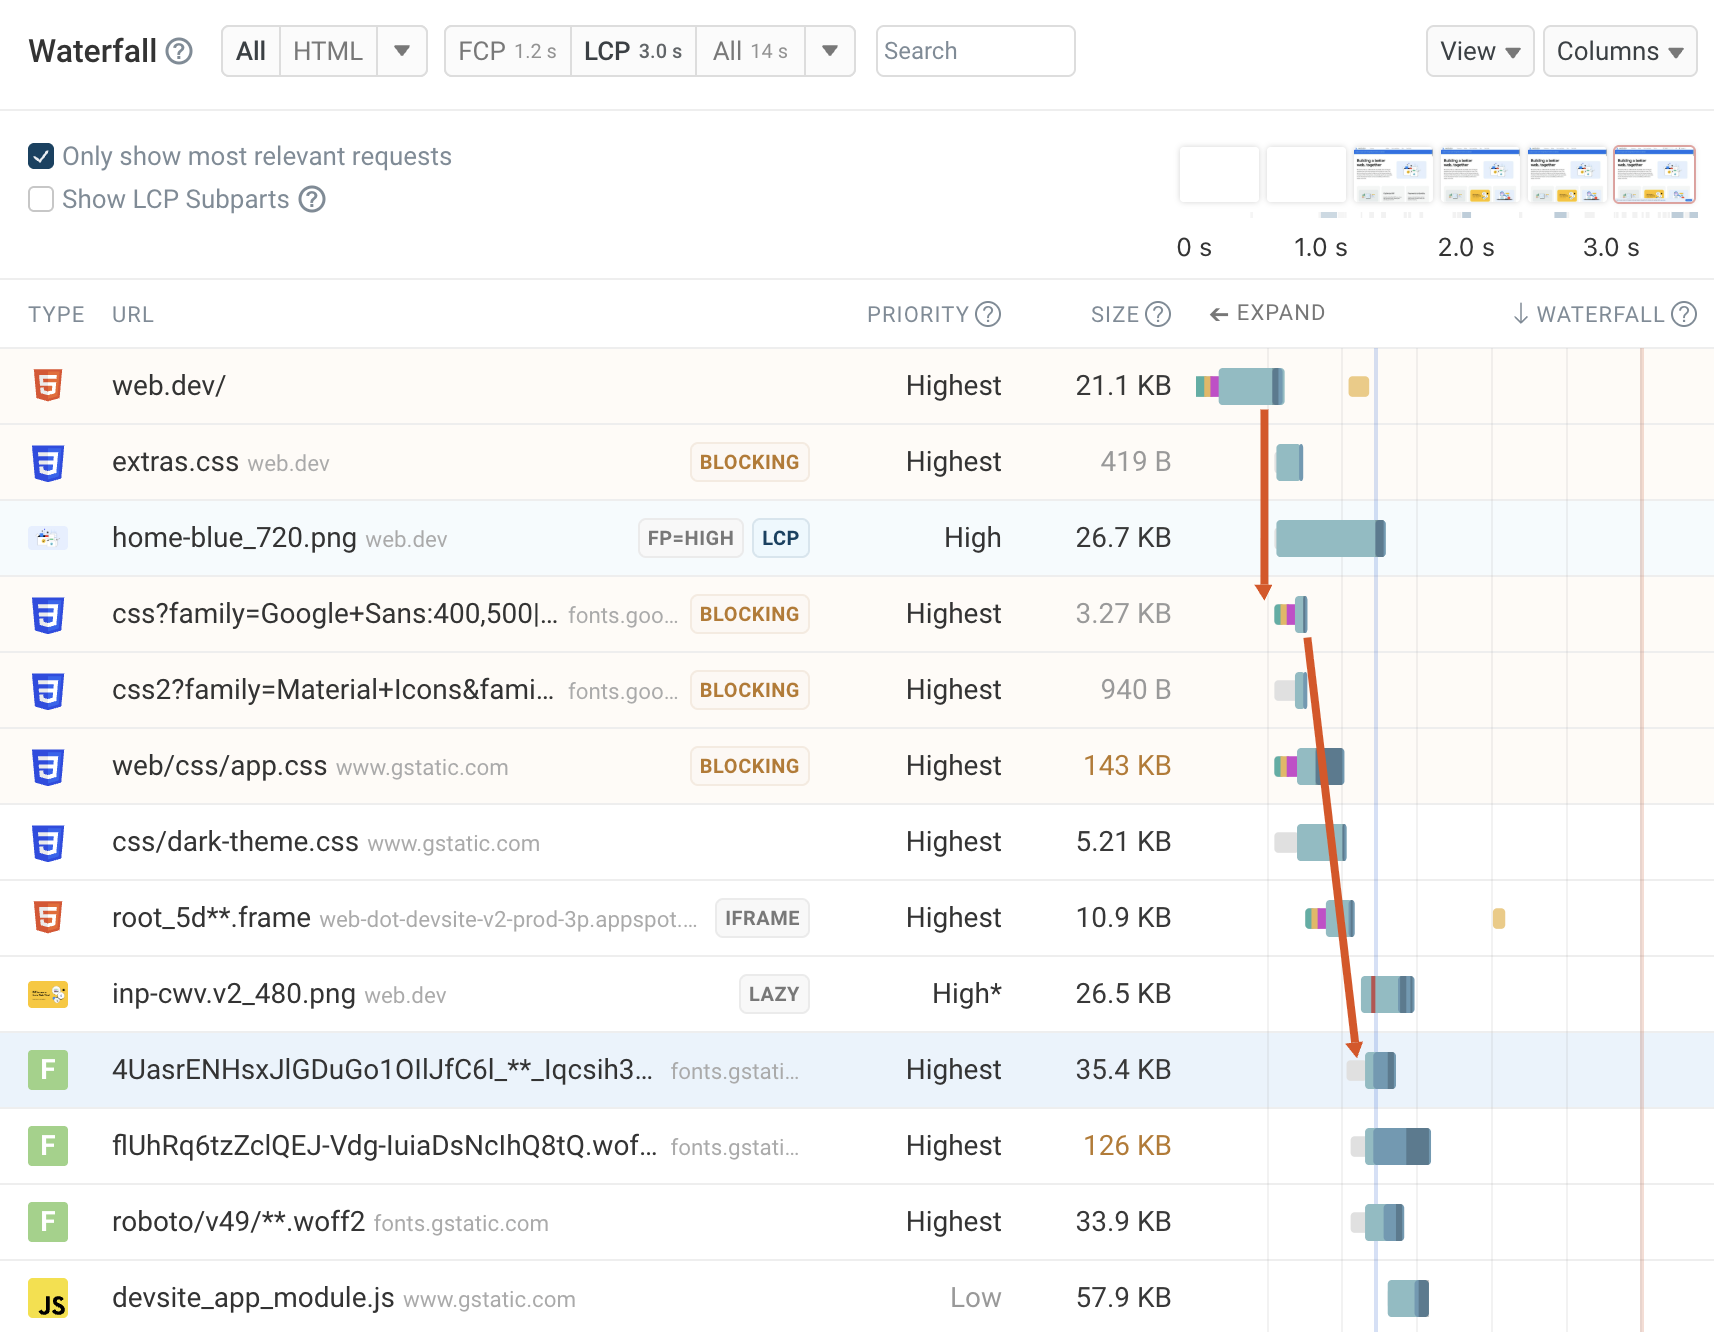
Web Vitals debugging
Our product is built to help marketing and developments teams optimize their Core Web Vitals.
Get detailed reports for each metric and see how you can optimize it.
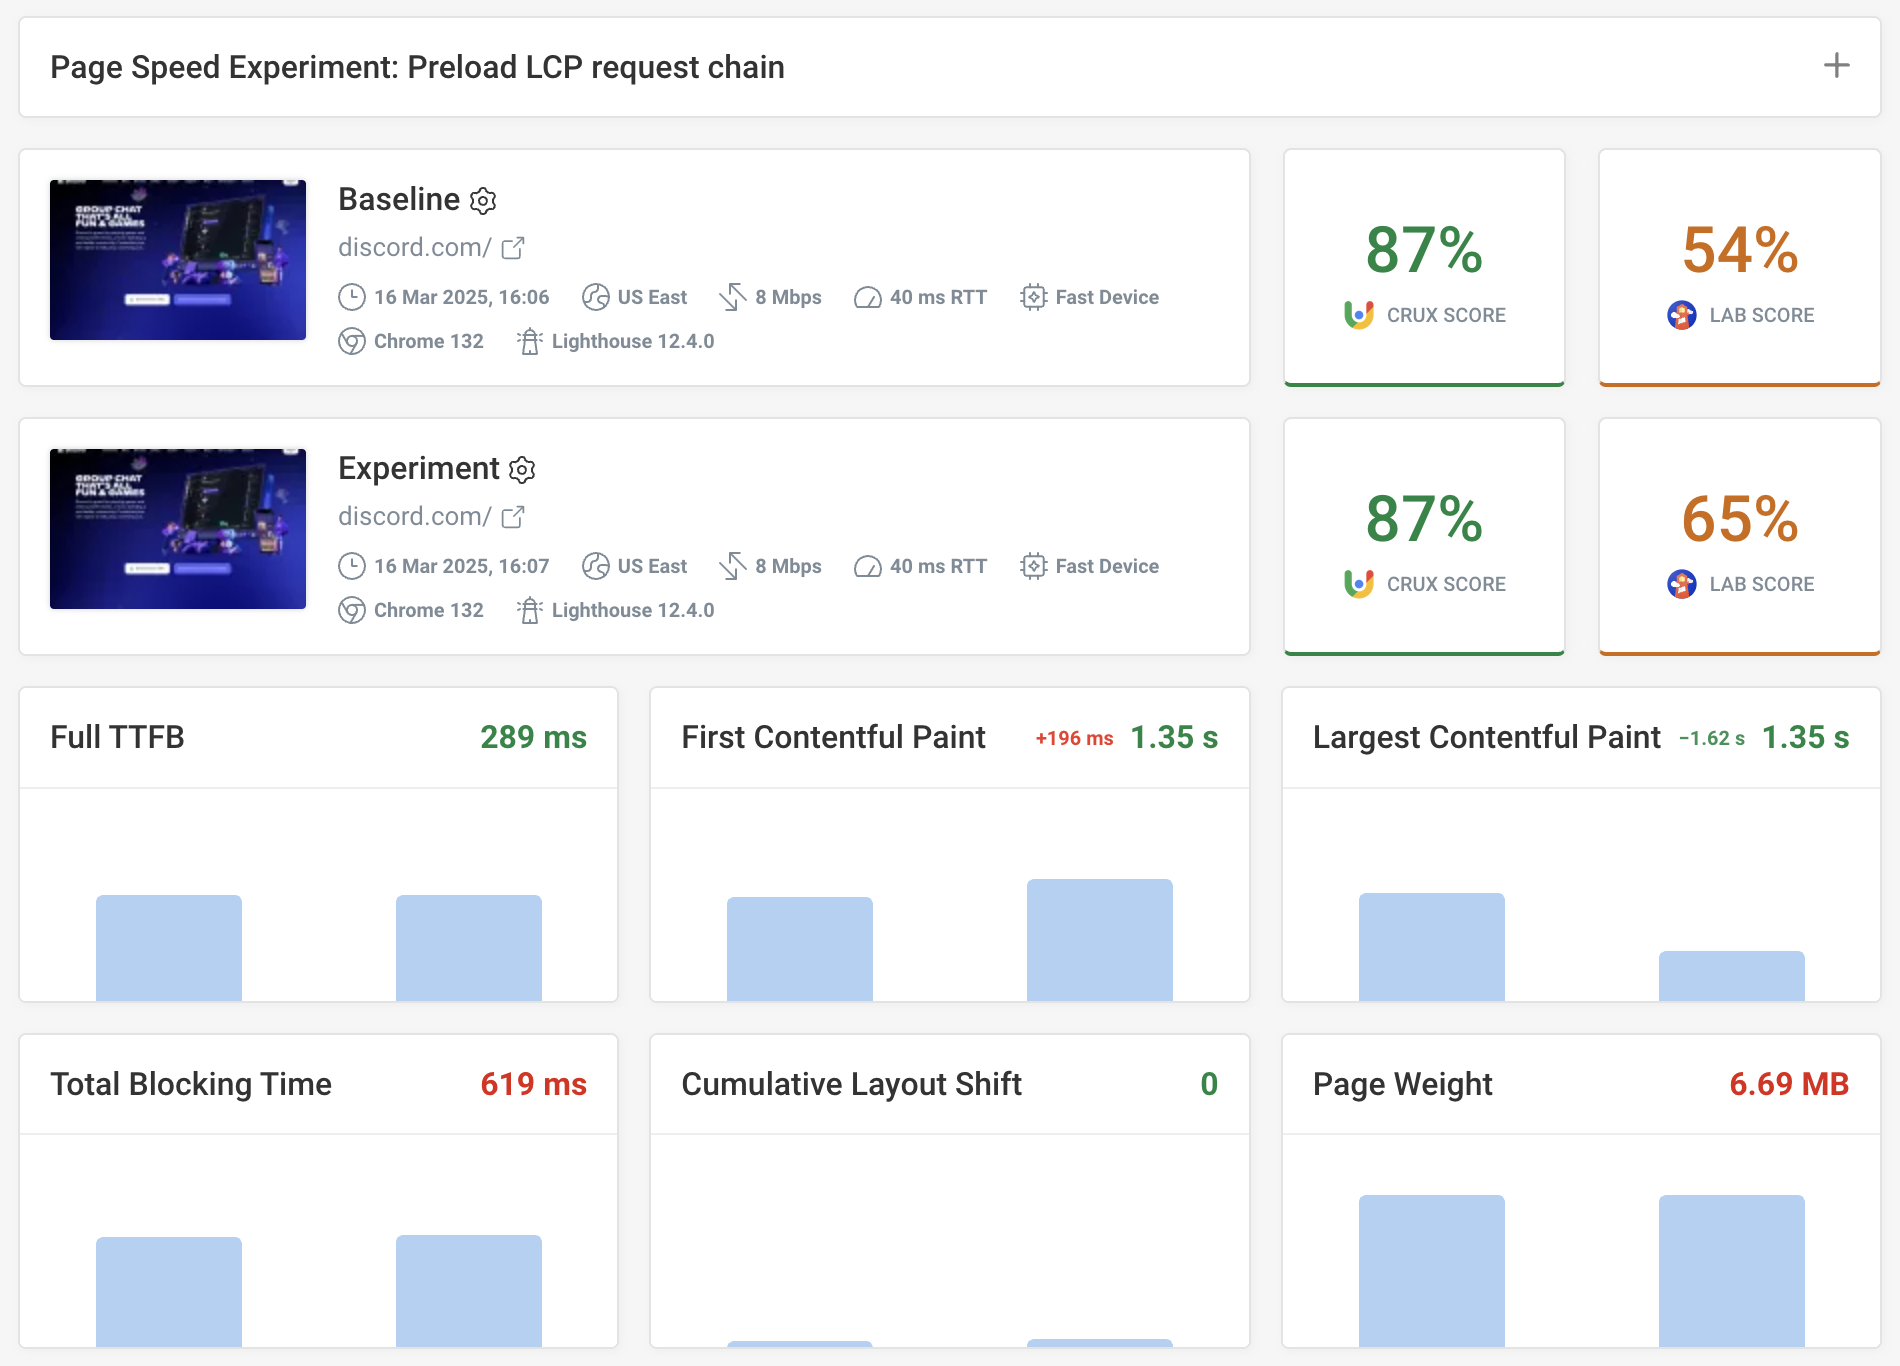
Run site speed experiments
Try out optimizations without deploying code
Simply modify the page HTML to add a priority hint, preload, or remove a render-blocking script.
See how fast the page would be with that change.
Create detailed tickets for your team
"Improve Core Web Vitals" is too broad. Experiments let you
try out potential optimizations and share the ones that work best
with your development team.
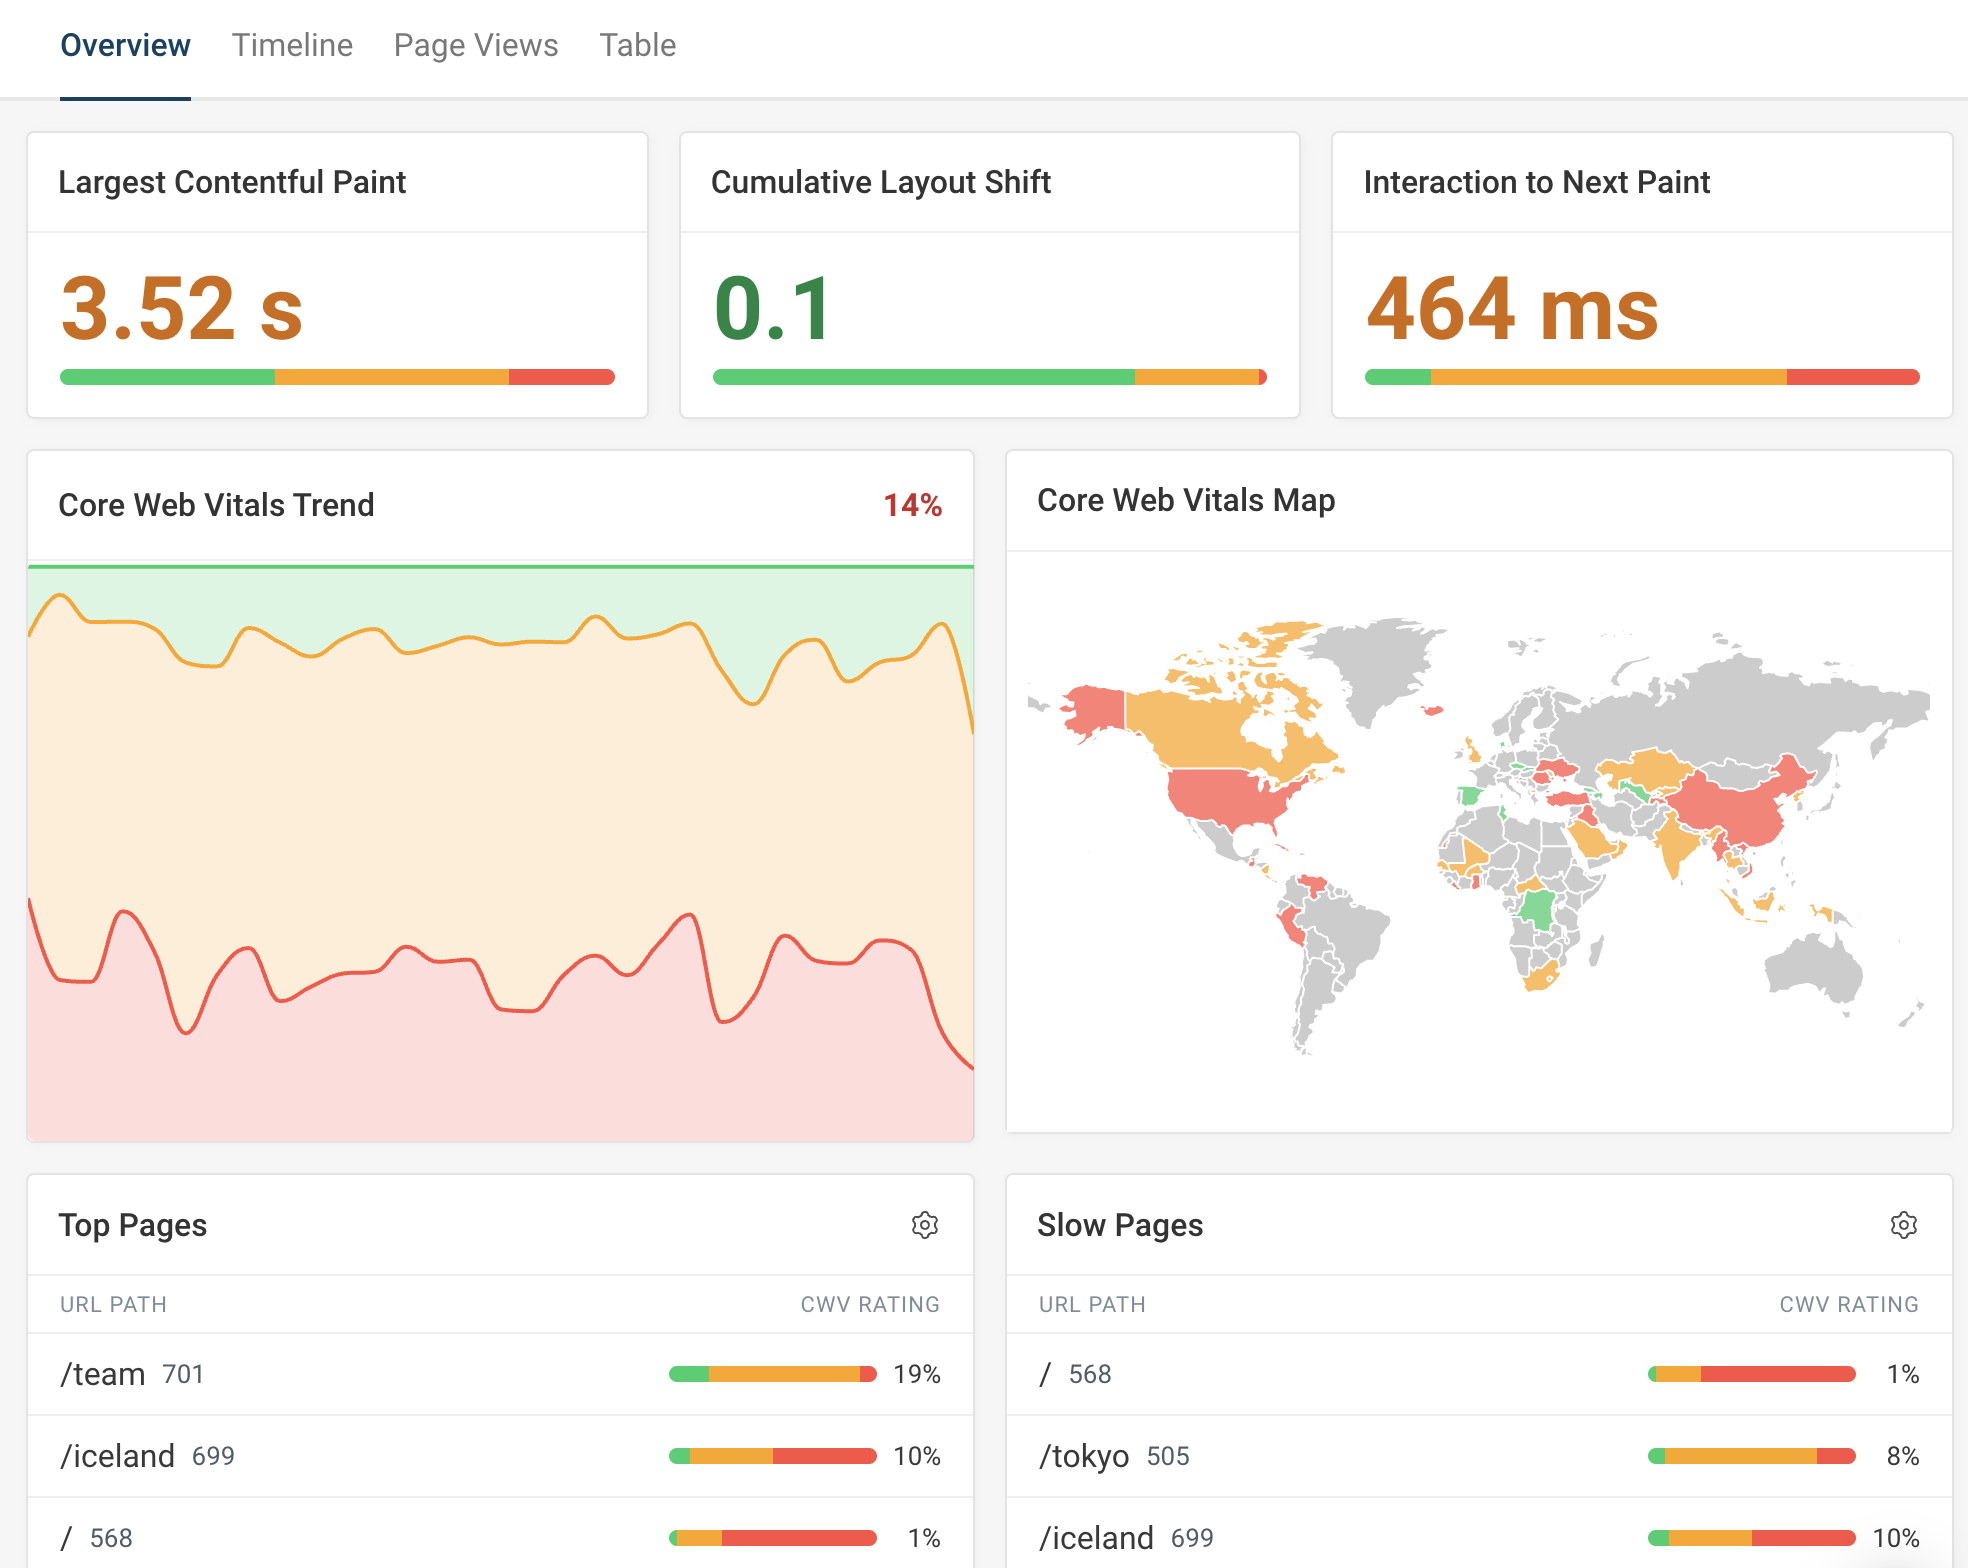
Monitor real user data
See how visitors experience page speed across your whole website
Simply install our analytics script and to identify slow pages and optimize them.
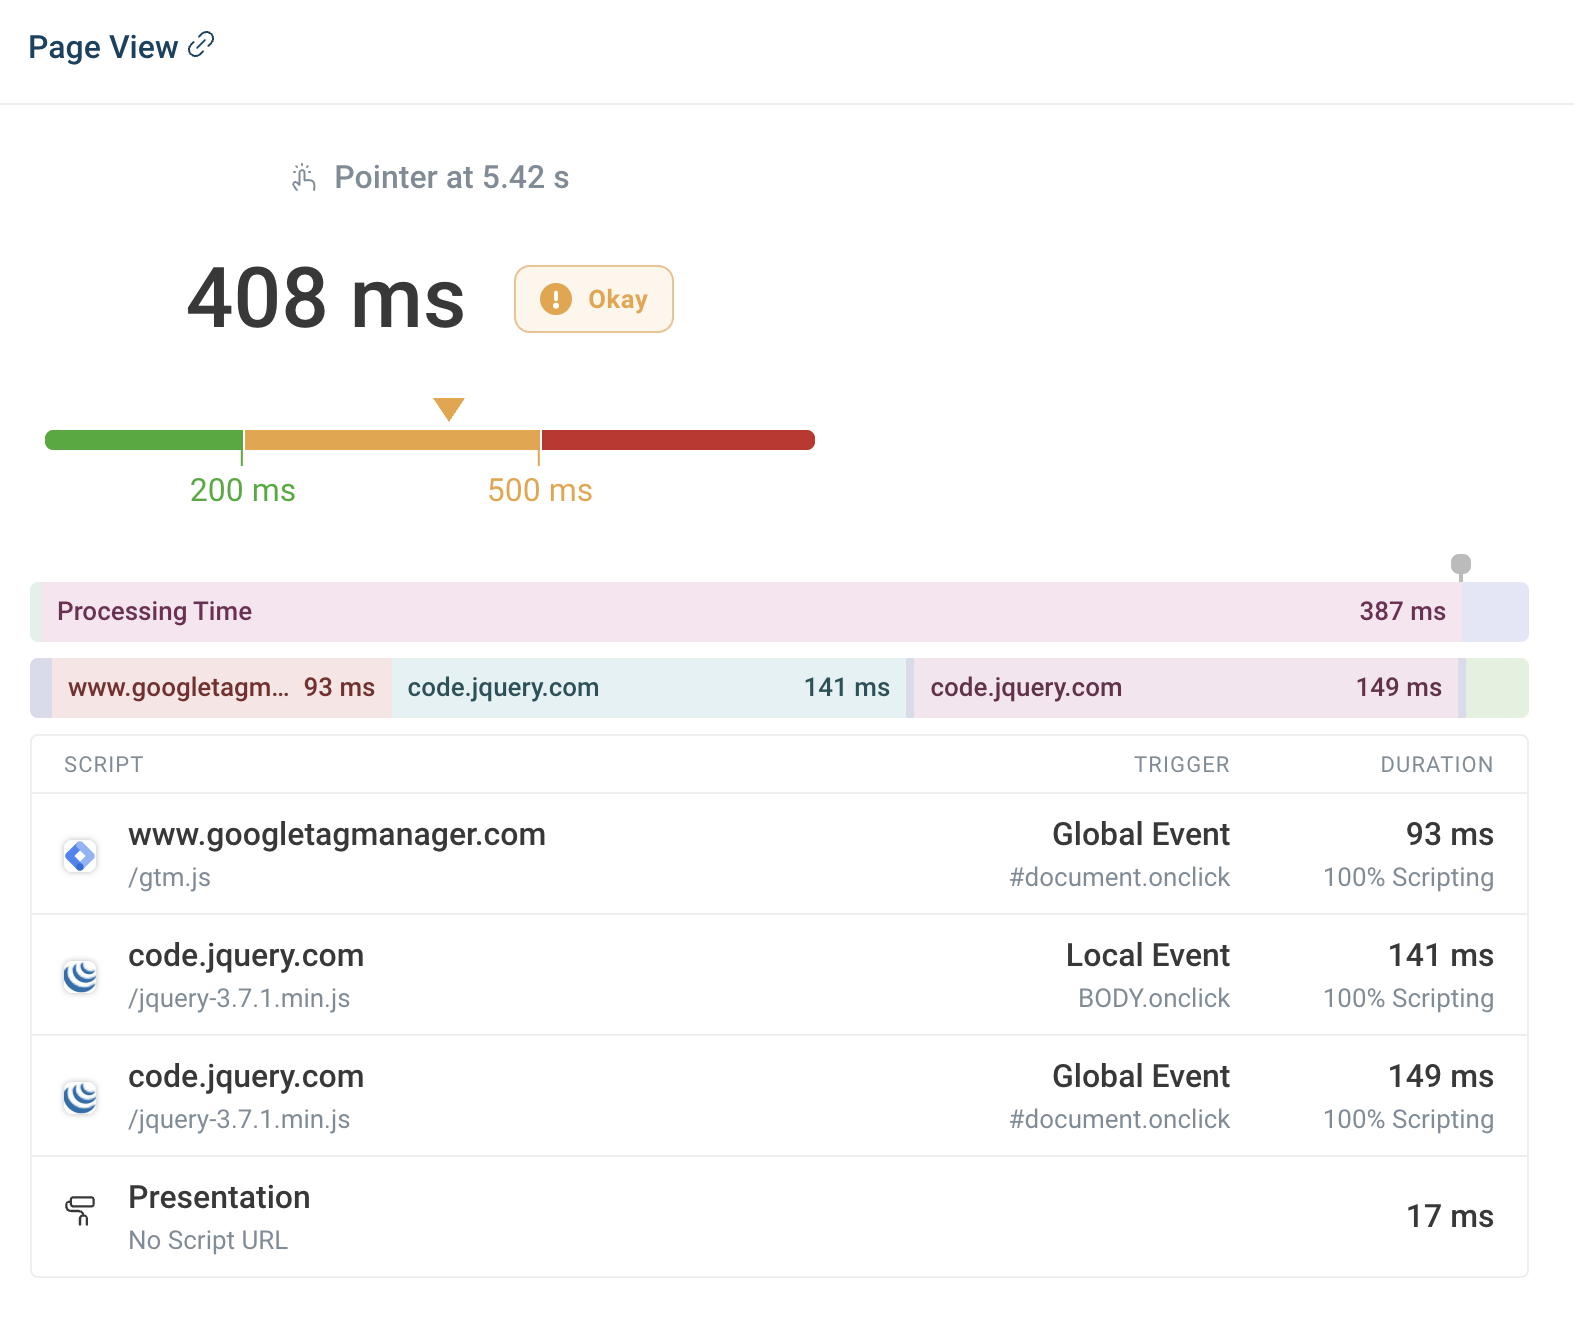
Detailed debug data
See how users interacted with the page and what UI elements are responsible for the Largest Contentful Paint,
Cumulative Layout Shift, and Interaction to Next Paint.
How is DebugBear different from Speedcurve?
Both are solid tools
Speedcurve and DebugBear provide reliable web performance data, performance recommendations,
and detailed request waterfall for debugging. A lot comes down to what works better for you.
Easy to set up
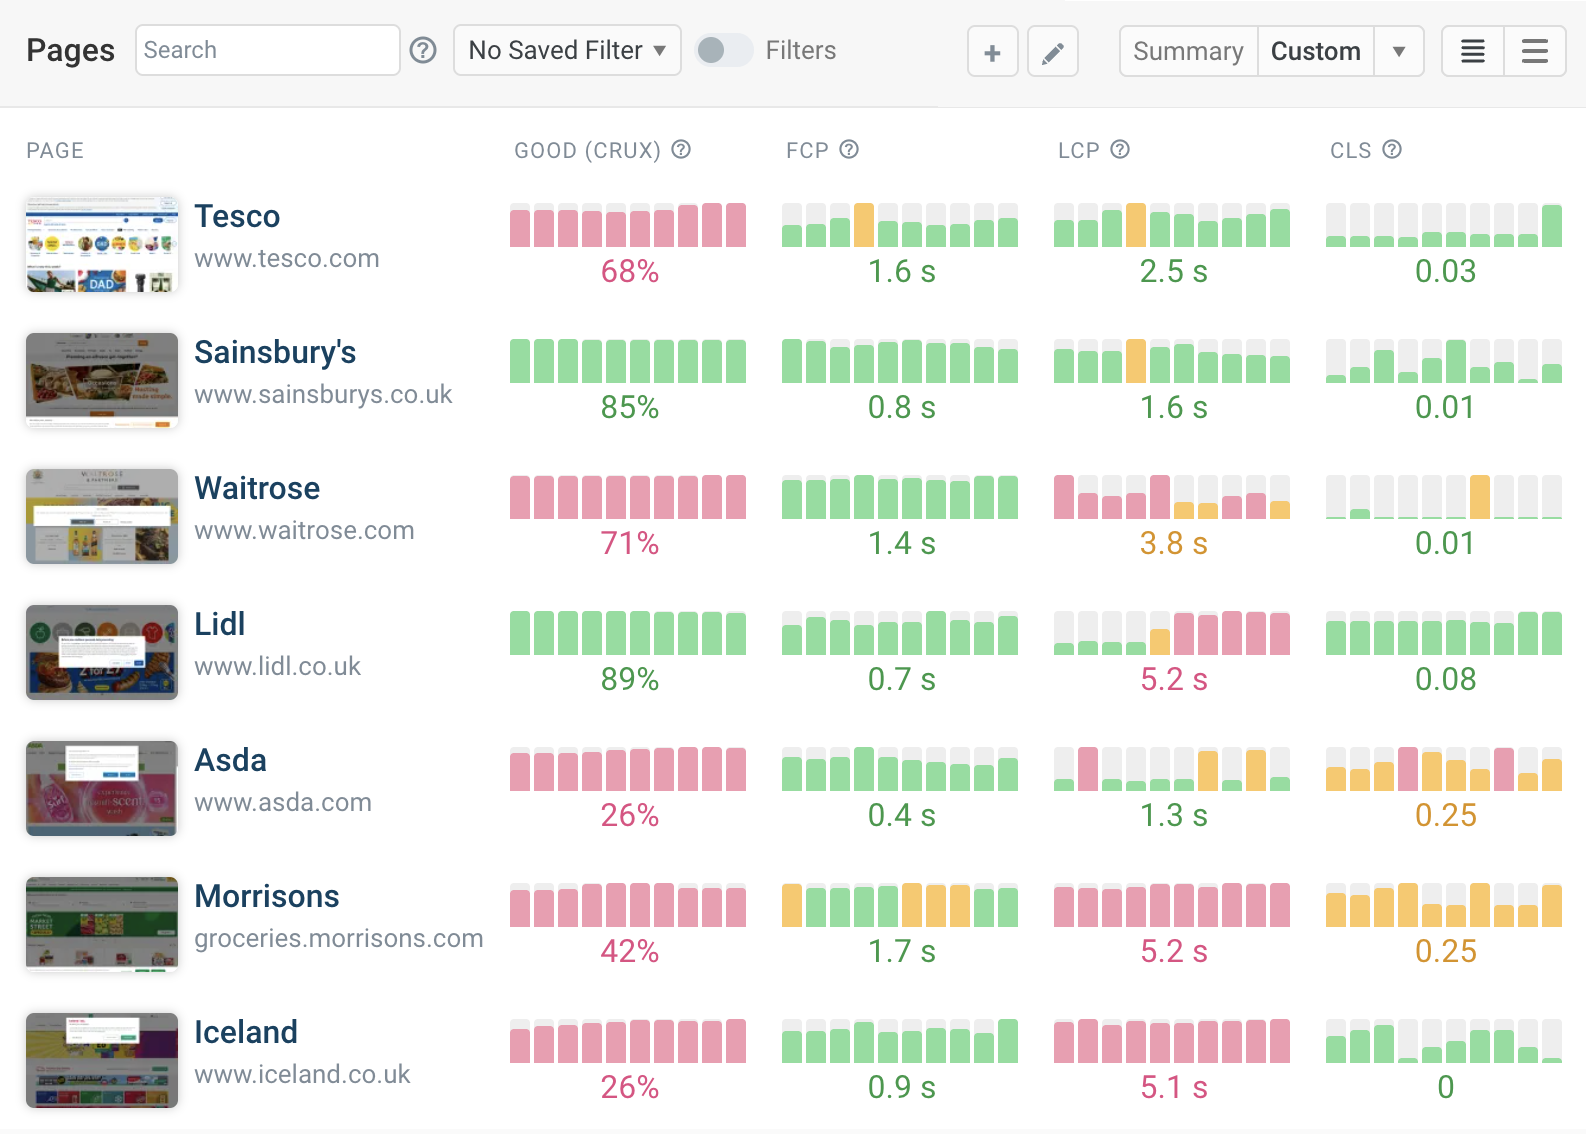
Simply paste the URL of your website or that of a competitor into DebugBear to start monitoring it.
Built for Core Web Vitals
DebugBear has been built with Core Web Vitals optimization as a key goal.