Nearly every website uses JavaScript, so JavaScript performance is a growing topic in modern front-end development. In this post we'll introduce common performance pitfalls and discuss how to detect and avoid them.
We'll focus on JavaScript execution and other CPU processing that results from it. Check out our guide to Performant front-end architecture to learn more about structuring your app and prioritizing different types of resources.
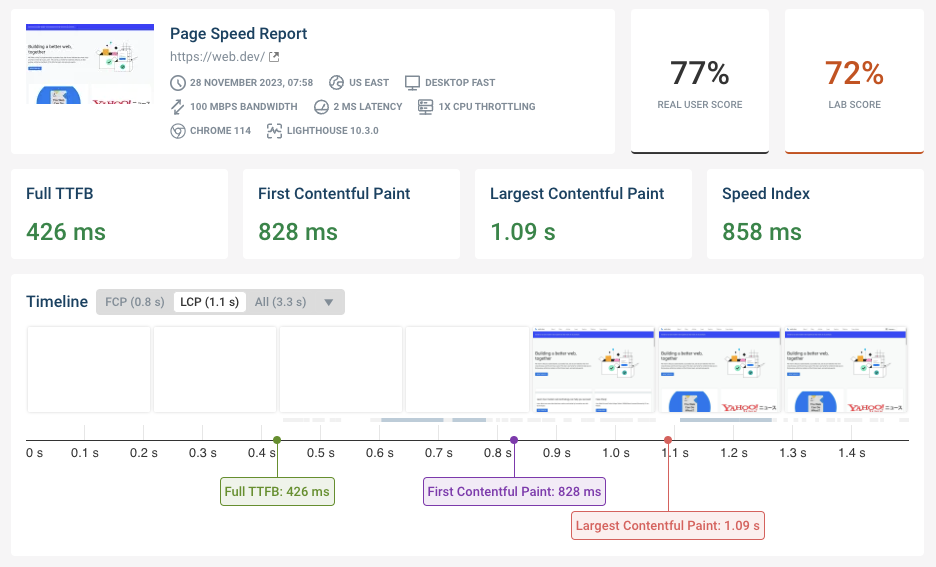
JavaScript performance is important for the Interaction to Next Paint.
Types of Javascript performance issues
We can separate JavaScript Performance issues into four different types:
- Slow parsing and compilation
- Slow execution
- Browser reflows
- Memory leaks
Slow parsing and compilation
Before browsers can run our code they first need to parse and compile it. Where possible this is done lazily, to avoid spending time on code that will never run.
Slow execution
Running JavaScript can have a significant effect on the overall performance of your website. Scripting time is usually the biggest contributing factor for high CPU load in the browser.
As this happens on the browser main thread, JavaScript execution can freeze the UI and prevent the user from interacting with the page.
Reflows and Layout Thrashing
Layout is when the browser calculates where it needs to paint DOM elements. This step requires geometric information like width and height.
The DOM API allows us to read and modify the content and styling of each element. While some of the properties won’t affect performance, others will cause the browser to synchronously recalculate the page layout, before continuing to execute the JavaScript code.
We'll show you what causes a reflow and how you can optimize your DOM manipulations to avoid them.
Memory Leaks
Memory leaks are an underrated aspect of JavaScript performance. Browsers have an intelligent garbage collection mechanism that cleans up after our code. But how we write our JavaScript code still impacts its efficiency.
We'll cover memory leaks an a future blog post.
How to debug Javascript performance issues
We can use the browser DevTools to debug JavaScript Performance problems.
- Open a Chrome window in Incognito Mode (Incognito mode ensures that our performance measurements won't be contaminated by browser extensions)
- Right-click an element on the page and select Inspect. Alternatively, press Command+Option+I (Mac) or Control+Shift+I (Windows, Linux) to open the DevTools.
Performance Tab
The Performance tab shows a detailed view of page runtime performance. It covers a wide range of information, including network activity, timings, main-thread tasks, and frames per second. We’ll use the performance profiler in our examples to analyze JavaScript performance and view execution timings.
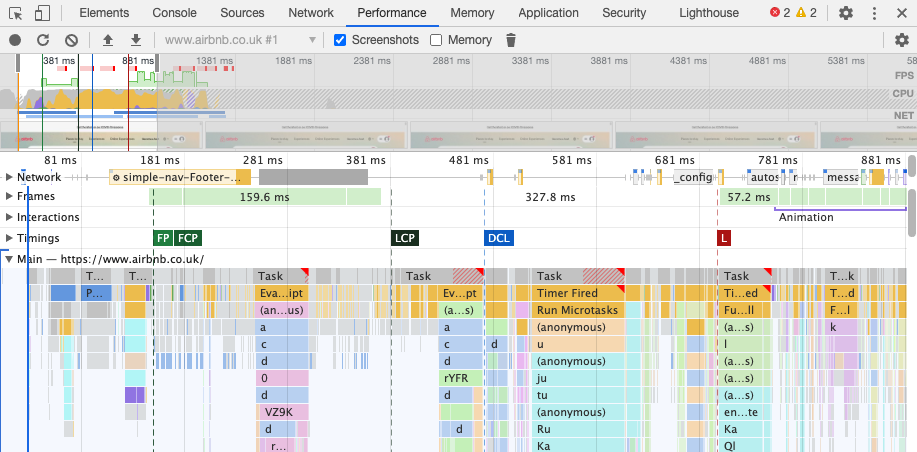
The main-thread section shows not only what JavaScript function was running at any given time, but also when Chrome spent time parsing code or updating the page layout.
Layout or reflows triggered by JavaScript
Layout or Reflows can have a notable impact on the performance of our page. Typically layout affects the whole document, so we should avoid it whenever possible.
Chrome will point out when DOM access in our JavaScript code triggered a reflow.
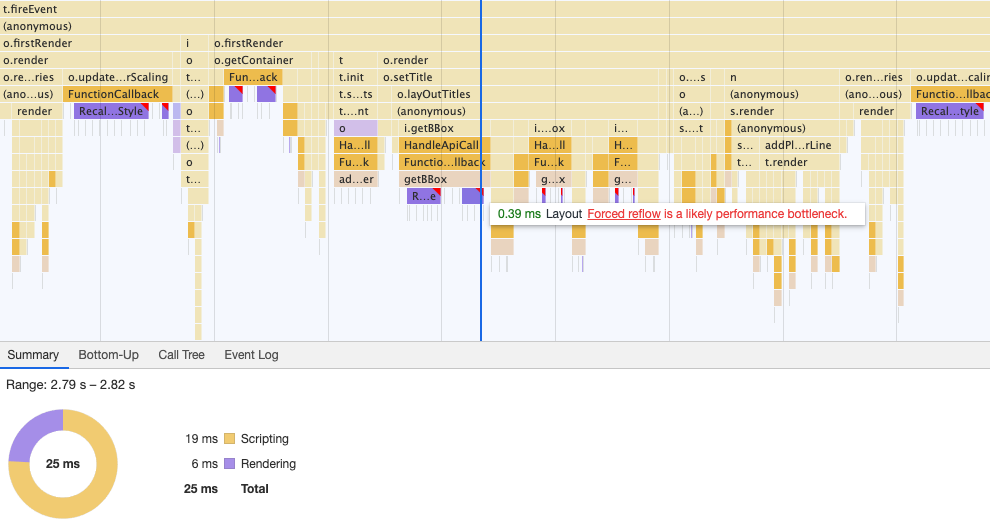
The screenshot shows an example of layout thrashing, where we repeatedly read and modify DOM properties, causing a series of relayouts.
Console API
The Console API offers three methods to measure how long it took to run our code:
console.timemethod starts a measurement. We pass a unique name for it because we can run many timers simultaneously on the same page.console.timeEndstops the timer with the specified name, and the amount of time that elapsed is logged to the console.console.timeLoglogs how much time has elapsed on a specific timer since thetimefunction was called.
These measurements then appear as messages in the browser console.
Let’s look at an example. In the code below we count to 10 million, with a timeLog call after the first 1 million.
console.time("Counting");
for (var i = 0; i < 1000 * 1000; i++) {}
console.timeLog("Counting", "Counted to 1 million");
for (var i = 0; i < 9000 * 1000; i++) {}
console.timeEnd("Counting");
The screenshot below shows the results.

Performance API
performance.now
The performance.now function returns a timestamp in milliseconds. It used to provide a high-resolution timestamps, but the resolution has been reduced to 1ms due to Spectre.
performance.mark
The User Timing API provides the performance.mark and performance.measure functions. We can use them to set markers and measure the distance between them.
The code below creates two markers and then uses measure to calculate the difference between them.
console.log("Note: copy and paste this example into the dev tools");

const runYourCode = () => {
  let i = 1e7;
  while (i--) {
    /* do work */
  }
};

performance.mark("startMark");
runYourCode();
performance.mark("endMark");

performance.measure("Our custom measurement", "startMark", "endMark");

console.log(performance.getEntriesByName("Our custom measurement"));
const [measurement] = performance.getEntriesByName("Our custom measurement");
console.log(measurement);
The screenshot shows how the measurement looks in Devtools. The Timing section of the performance profiler shows a new bar indicating how long our function took to run.
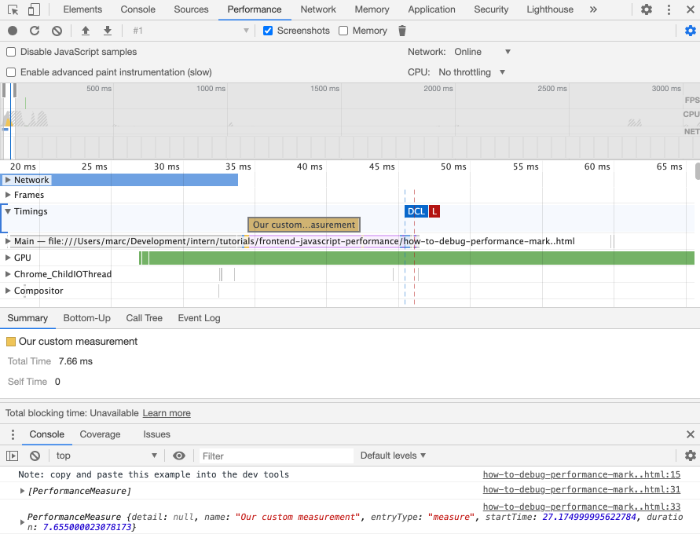
The name in the Timing section comes from the measure call. We can also see the PerformanceMeasure object being logged to the console.
You can also track user timings when monitoring the performance of your website.
Node
Require perf_hooks to use the performance object in Node.
const { performance } = require("perf_hooks");
Lighthouse
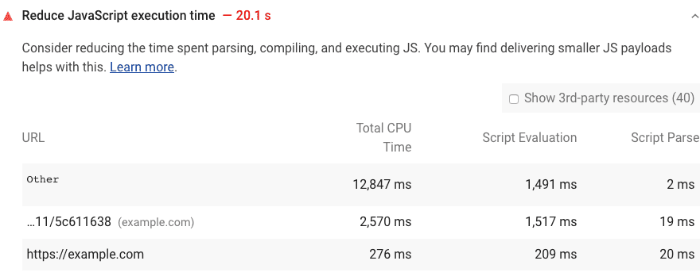
Lighthouse collects information about our JavaScript code, which we can use to debug performance issues. For example, it shows how long it took to run and parse different scripts under the "Reduce JavaScript execution time" audit.
Lighthouse version 6+ also audits unused parts of our JavaScript code and provides hints on removing them. See the Remove duplicate and unused code section of this article for more details.
Last but not least, Lighthouse reports slow third-party JavaScript libraries.
How to write fast front-end JavaScript code
We'll discuss common JavaScript performance problems and what can be done about them.
Avoid DOM access that requires layout work
DOM access takes time when we force the browser to recalculate the styles or page layout. To keep the impact of DOM manipulation to performance as low as possible, try to reduce DOM access and batch edits together or manipulate element fragments before you add them to the DOM.
The following example reads the offsetTop property of an element before the page has rendered for the first time. This forces a synchronous layout, as the browser hasn't calculated yet where on the screen the element will appear.
<div id="element">Text in Box</div>
<script>
  var element = document.getElementById("element");
  console.log(element.offsetTop);
  element.style.width = "400px";
</script>
We can measure this with the Performance tab in Chrome DevTools. Open the example in the browser, switch to the Performance tab, and hit the reload button. Zoom into the beginning of the timeline and locate the tasks shown in the screenshot.
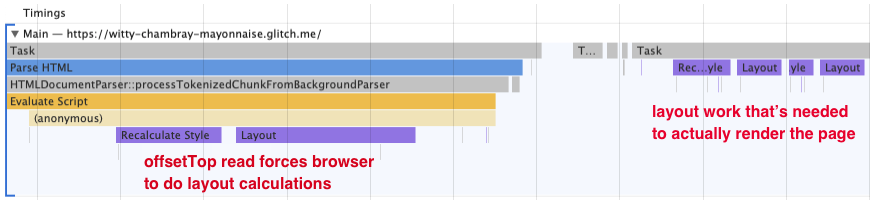
The code first reads the offsetTop property, before it changes the width of the element. To know the offsetTop of the element, the browser needs to update the page layout.
If we do this multiple times in a row this is called layout thrashing. This often happens when we force style changes and reads in side a loop.
Memoization
For functions with slow logic that can't be sped up, memoization can be a real performance boost. It can make functions run faster by caching the their return values after the initial execution.
const increment = memoize(function (n) {
  return n + 1;
});

increment(3);
increment(3); // will hit the cache
memoize takes the function we want to run as a parameter and returns a new memoized function. When the memoized function is called it adds the return values to the memoizer cache.
This is an example implementation of a memoize helper function.
function memoize(fn) {
  // could use `{}`, but then looking up "constructor" would be a cache hit
  let cache = Object.create(null);

  return function (arg) {
    if (arg in cache) {
      console.log("memoize cache hit");
      return cache[arg];
    } else {
      let result = fn(arg);
      cache[arg] = result;
      return result;
    }
  };
}
If your function takes object as an argument you could use a Map as the cache. However, keep in mind that this only works if your objects are immutable, otherwise you could get a false cache hit.
You can also use the memoize implementation in Lodash.
Event listeners
An event listener waits for an event, such as a click on a button. After the event gets triggered, it delegates it to an attached function. There are a few ways to avoid performance issues caused by event handlers.
Throttling and Debouncing events
Some events fire several times in a row, like when a user scrolls down the page or resizes the browser window. We can run into performance problems if we handle every event. Throttling or debouncing events can solve this issue.
Throttling reduces the trigger rate, for example running an event handler at most once every 200ms.
Debouncing delays processing the event until it stops firing. For example, you might not want to process a keyup event until the user has stopped typing for 500ms.
function throttle(callback, limit) {
  let wait = false;
  return function () {
    if (!wait) {
      callback.apply(null, arguments);
      wait = true;
      setTimeout(function () {
        wait = false;
      }, limit);
    }
  };
}

function handler(e) {
  console.log(e);
}
const throttledHandler = throttle(handler, 500);
window.addEventListener("resize", throttledHandler);
You can use these throttle and debounce implementations or use a library like Lodash.
Event delegation
Event delegation is a pattern to reduce the number of event listeners in our application. We define an event listener for all click events in our application. If a user clicks on an element, the handler delegates it to a function that handles click events for that element. This also saves memory, reducing the likelihood of a performance issue.
Prefer native JavaScript
Newer version fo ECMAScript, the specification for JavaScript, provide a larger set of native functions that make it easier to write our apps.
Using these functions where possible can also help with performance. For example, the built-in string endsWith method will be faster than writing our own logic. While new features may initially be slower when support is first added to JavaScript engines, their performance improves over time.
You might not need frameworks and libraries
Most of the time, when we start new projects, we use frameworks and libraries that help us with handy features. Still, one of the most used libraries is jQuery. But we can also use frameworks like React, Angular, and VueJs to create our websites. Of course, they all ultimately rely on native JavaScript, but they bring many features we don’t need.
If our website isn’t designed to be a single page application, we can go with a few lines of native JavaScript instead of using jQuery or any other library. There's no need for frameworks if your page only contains a simple form.
::: If you're having performance issues with Vue apps, check out our Vue performance guide! :::
Animations
We use animations for our sites to make user interaction more fluent. The problem with animations is that the user notices when they are not smooth and performant.
We're less likely to run into performance issues if we only work with the transform and opacity properties. Modern browsers run them on a separate compositor thread that's different from the main thread.
If you need to animate different element properties, you should consider how you apply the animation. Reduce the number of reflows or layout steps the browser has to perform. Browsers have some APIs to help us with that.
requestAnimationFrame
requestAnimationFrame tells the browser that we want to perform an animation. It takes a callback function, and the browser invokes it right before the next paint.
The browser schedules the function call to reduce the work for painting and layout. Especially if we do animations for things like progress bars or similar functionality, requestAnimationFrame is the right choice.
Postpone non-essential work
Sometimes we need to run code, but it doesn't have to run synchronously and delay updates to the UI.
Fortunately, we can schedule non-essential work with requestIdleCallback. For example, we could use it to generate and send analytics data.
Iteration and loops
As developers we use loops all the time, whether to iterate over a list of links from the DOM or products we requested from an API. The performance of iterations can affect the performance of our website.
These tips also apply to other ways to iterate over a list, like forEach or map.
Exit loops early
If you try to find an item on your list, stop the loop once you found the item. We don't need to iterate through the whole list if we already have what we need.
for (const item of list) {
  if (isRightItem(item)) {
    doStuff();
    break; // avoid iterating after item is found
  }
}
Similarly, if you only need to find one item in a list, prefer find over filter.
Avoid nested iterations
Avoid nested loops where possible. A nested loop leads to execution time that rises exponentially with the number of items we're iterating over. For a long list, a nested loop might freeze our application.
This can be hard to notice, especially if the loop is in another function in different file and it's not clear that calling the function iterates over the list.
function getRequest(url) {
  return requests.find((r) => r.url === url);
}

for (const url of urls) {
  // getRequest iterates over list of requests every time
  let request = getRequest(url);
  doStuff(request);
}
In this example it could help to iterate over the list of requests once and create an object that maps each request url to a request. Then we can use the URL to look up the request in constant time.
Note that this might not be necessary if we know that urls and requests will never have more than 50 items.
Micro-optimizations / VM optimizations
JavaScript is a very flexible language and, therefore, harder to optimize. Micro-optimizations are small changes to our code that don’t significantly impact the application but still speed up the specific code. Before we apply micro-optimizations we should already have identified a performance issue and measured its impact.
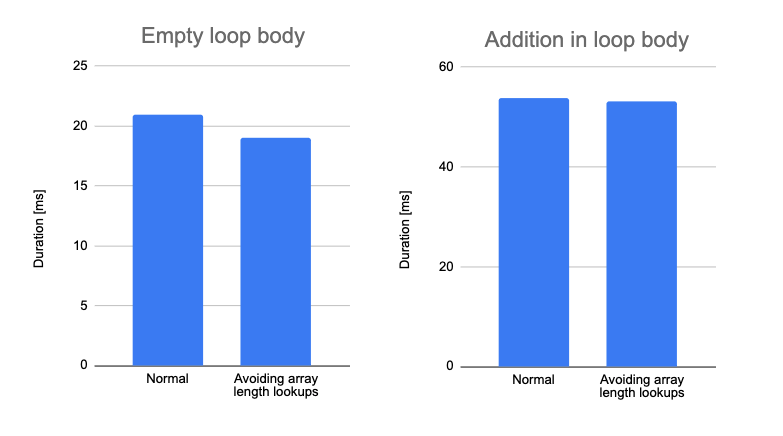
For instance, a micro-optimization would be minimzing how often we access the length property of an array when iterating over that array. w3schools uses this example of how to speed up the loop itself.
for (var i = 0; i < arr.length; i++) {}
// With property lookups minimized
var l = arr.length;
for (var i = 0; i < l; i++) {}
But in practice it's more important what we do inside of our loop. Even small amounts of work inside the loop will have a significantly higher impact than the iteration itself.
Let's compare the loop above to a loop that has some functionality in it.
var index = 0;

var i;
for (i = 0; i < items.length; i++) {
  index += i;
}
While the optimization does improve performance, its impact is small, even if we don't actually do any work inside the loop. The impact is barely noticeable if we do something as simple as incrementing a variable.
Other micro-optimizations are changes to our codebase to help the JavaScript engine (for instance Chrome's V8) optimize our code.
If we identified specific code that runs slowly, we should first consider using a different algorithm. But if we need to stick to our current implementation, we could apply consider making changes based on how JavaScript engines are implemented. Check out these links for some examples:
- Hidden classes
- Morphism
- Optimizing/De-optimizing function calls with same/different types
- Array operations
Optimizing JavaScript code architecture
A good JavaScript code architecture can help us avoid several performance problems on our website or our application.
Use bundlers and code splitting
Bundlers like webpack, esbuild, Rollup, or Parcel combine different files in our codebase into JavaScript bundles. Thesse tools can split our code into smaller chunks. This can have a massive impact on the how much JavaScript code is served to the user.
Module / NoModule Pattern
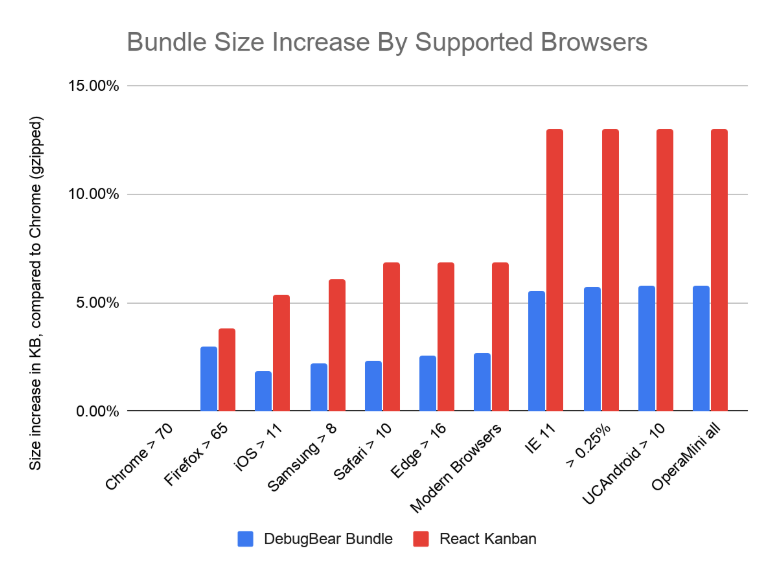
The module / nomodule pattern describes the practice of serving only modern code to modern browsers. Older browsers will require different bundles or additional files.
The bundlers mentioned above can generate different bundles of code based on the browsers the code needs to run in. We can generate a bundle with the modern syntax for modern browsers and one with transpiled code and polyfills for older browsers. If we want to know more about it check out the following links:
At DebugBear we also measured how support for older browser increases bundle size.
Remove duplicate and unused code
Avoid unused or duplicate code where possible. Sometimes the architecture doesn't allow this, but we should keep an eye on it. You can manually check the Coverage tab in the DevTools or use bundler plugins like Webpack Bundle Analyzer.
Use Web workers for complex code
JavaScript is single-threaded, which means it generally runs on the main thread in the browser. If we have some heavy lifting that can run in the background, we can outsource that work to a web worker. Web workers run on a different thread and won’t block user interactions on the main thread.
Conclusion
Our users will have the best experience with our site if we can make their browser do as little work as possible. We can use the browser DevTools to identify opportunities to improve performance.
Measuring site performance also tells us when optimization is not needed, or when an optimization we tried doesn't have a noticeable impact. This is especially true if the optmization hurts the readability of our code.
Monitor website performance over time.
DebugBear can monitor the performance of your website and alert you when there's a problem.
Sign up for a 14-day trial or try our free website speed test.
Run A Free Page Speed Test
Test Your Website:
- No Login Required
- Automated Recommendations
- Google SEO Assessment