
A story on Hacker News recently argued that webpage speeds haven't improved, even as internet speeds have gone up.
This article explains why that conclusion can't be drawn from the original data.
We'll also look at how devices and the web have changed over the past 10 years, and what those changes have meant for web performance.

- Interpreting the HTTP Archive data
- How have mobile networks and devices changed over the last 10 years?
- How have websites changed?
- Data from the Chrome User Experience Report
- Modelling page load times
- Conclusion
Interpreting the HTTP Archive data
This chart from the Nielsen Norman Group article suggested that increasing mobile network bandwidth hasn't resulted in faster page load times.
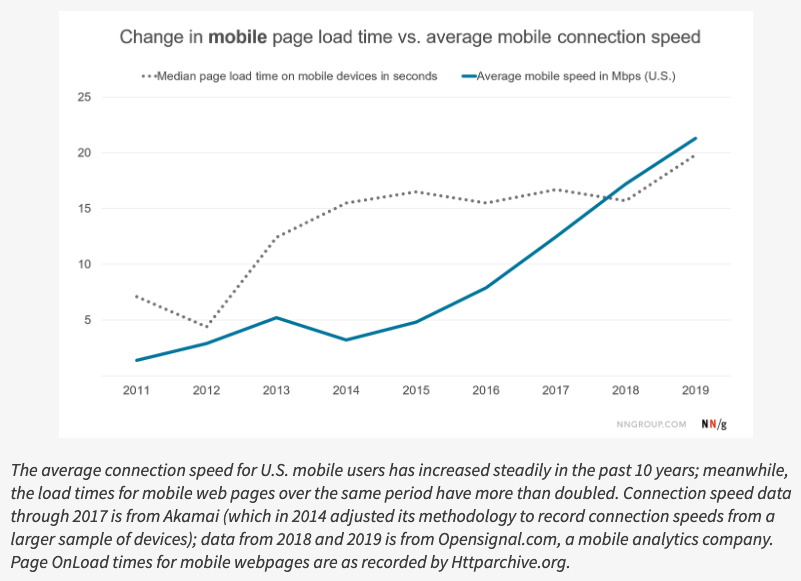
However, the connection speed used by HTTP Archive has not actually increased over time.
Instead it went down in 2013, switching from wifi to an emulated 3G connection.
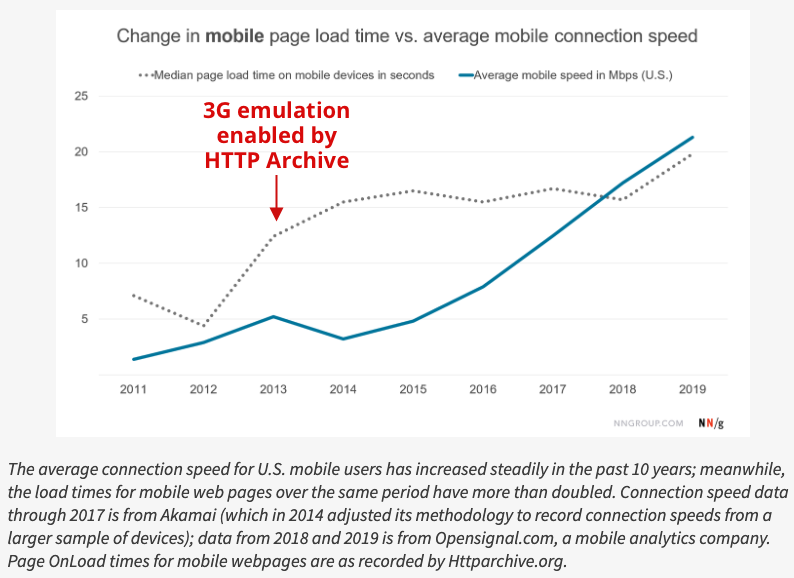
The onLoad metric has increased 55% since 2013, from 12.7s to 19.7s. If you bought a phone in 2013 and have been on a 3G connection ever since, then the web has become slower for you.
Before looking at how devices and the web have changed over the last 10 years, here are a few notes on how to think about this data.
Why look at onLoad?
The load event is emitted by the page when all page resources like scripts or images have been downloaded.
If the top of a page renders quickly, but the page also loads 20 images further down, then the onLoad metric will suggest that the page is slow.
A different page might not initially render anything useful at all, and only start loading additional resources and rendering content long after the onLoad event. Yet this page will appear fast.
As a result, onLoad doesn't do a good job measuring whether a user experiences the page as fast.
So why do we even look at this metric? Because it's been around for a long time, and HTTP Archive has been tracking it since 2010. Newer metrics like First Contentful Paint or Time to Interactive were only added to HTTP Archive in 2017.
Should we expect increasing bandwidth to result in faster page load times?
Increasing bandwidth will only make a page load faster if bandwidth is the bottleneck at some point. It won't help if you're on a Gigabit connection with a 1s network round trip time.
However, the 1.6 Mbps 3G connection emulated by HTTP Archive is very slow, so we should expect significant performance improvements as bandwidth improves. The average website downloads 1.7MB of data in 2020, which will take at least 9s to download on the HTTP Archive connection.
Some more HTTP Archive caveats
I'll talk a lot about "the average website" in this article. It's worth noting that HTTP Archive only collects data on homepages, not pages deeper down in the site. The corpus of tested domains has also grown over time.
The tests weren't always run on the same device. Initially a physical iPhone 4 was used, today the tests are run on an emulated Android device.
We'll look at median metric values in this article. If most websites are fast but one in five websites freeze your phone for 20s we won't be able to pick this up.
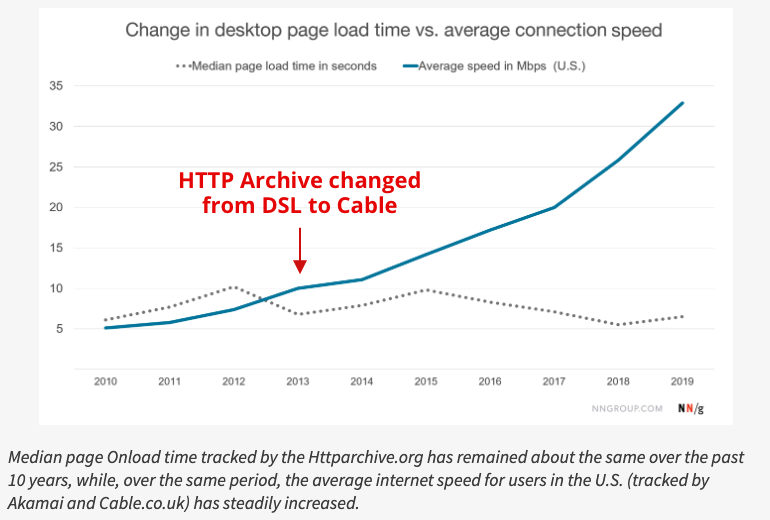
Performance on desktop
This article will focus on mobile performance in the US. However, if you're looking at the desktop data from the original article, it's worth noting that the test bandwidth was increased and latency was reduced in 2013.
How have mobile networks and devices changed over the last 10 years?
Let's look at 4 factors:
- network bandwidth
- network latency
- processor speeds
- browser performance
Mobile network bandwidth in the US
This chart shows average mobile bandwidth in the US by year, according to different sources. It increased from 1 Mbps to around 30 Mbps.
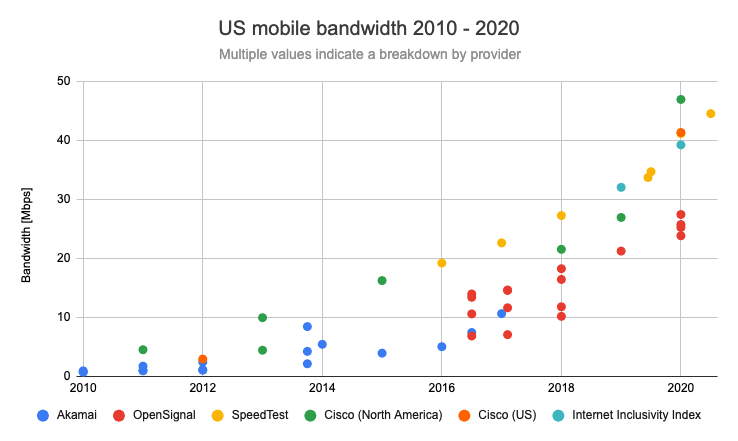
(I've not been very careful when collecting this data. For example, I didn't consistently distinguish when data was collected from when it was published. You can find my sources here.)
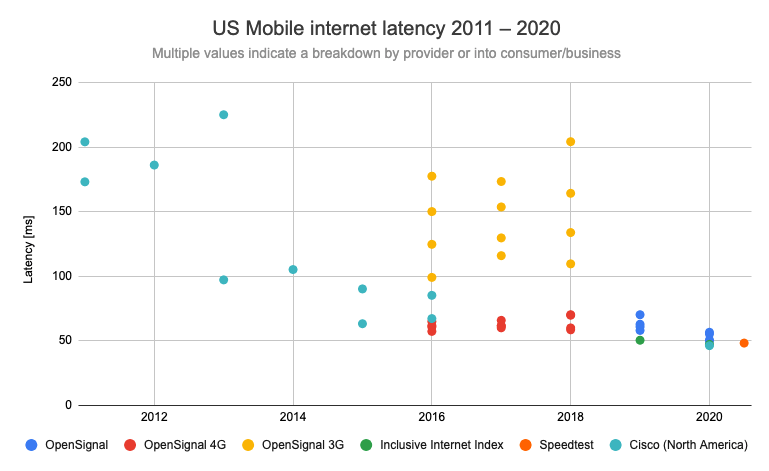
Mobile network latency in the US
This was harder to find data on, but the results indicate that latency dropped from around 200ms in 2011 to 50ms in 2020.
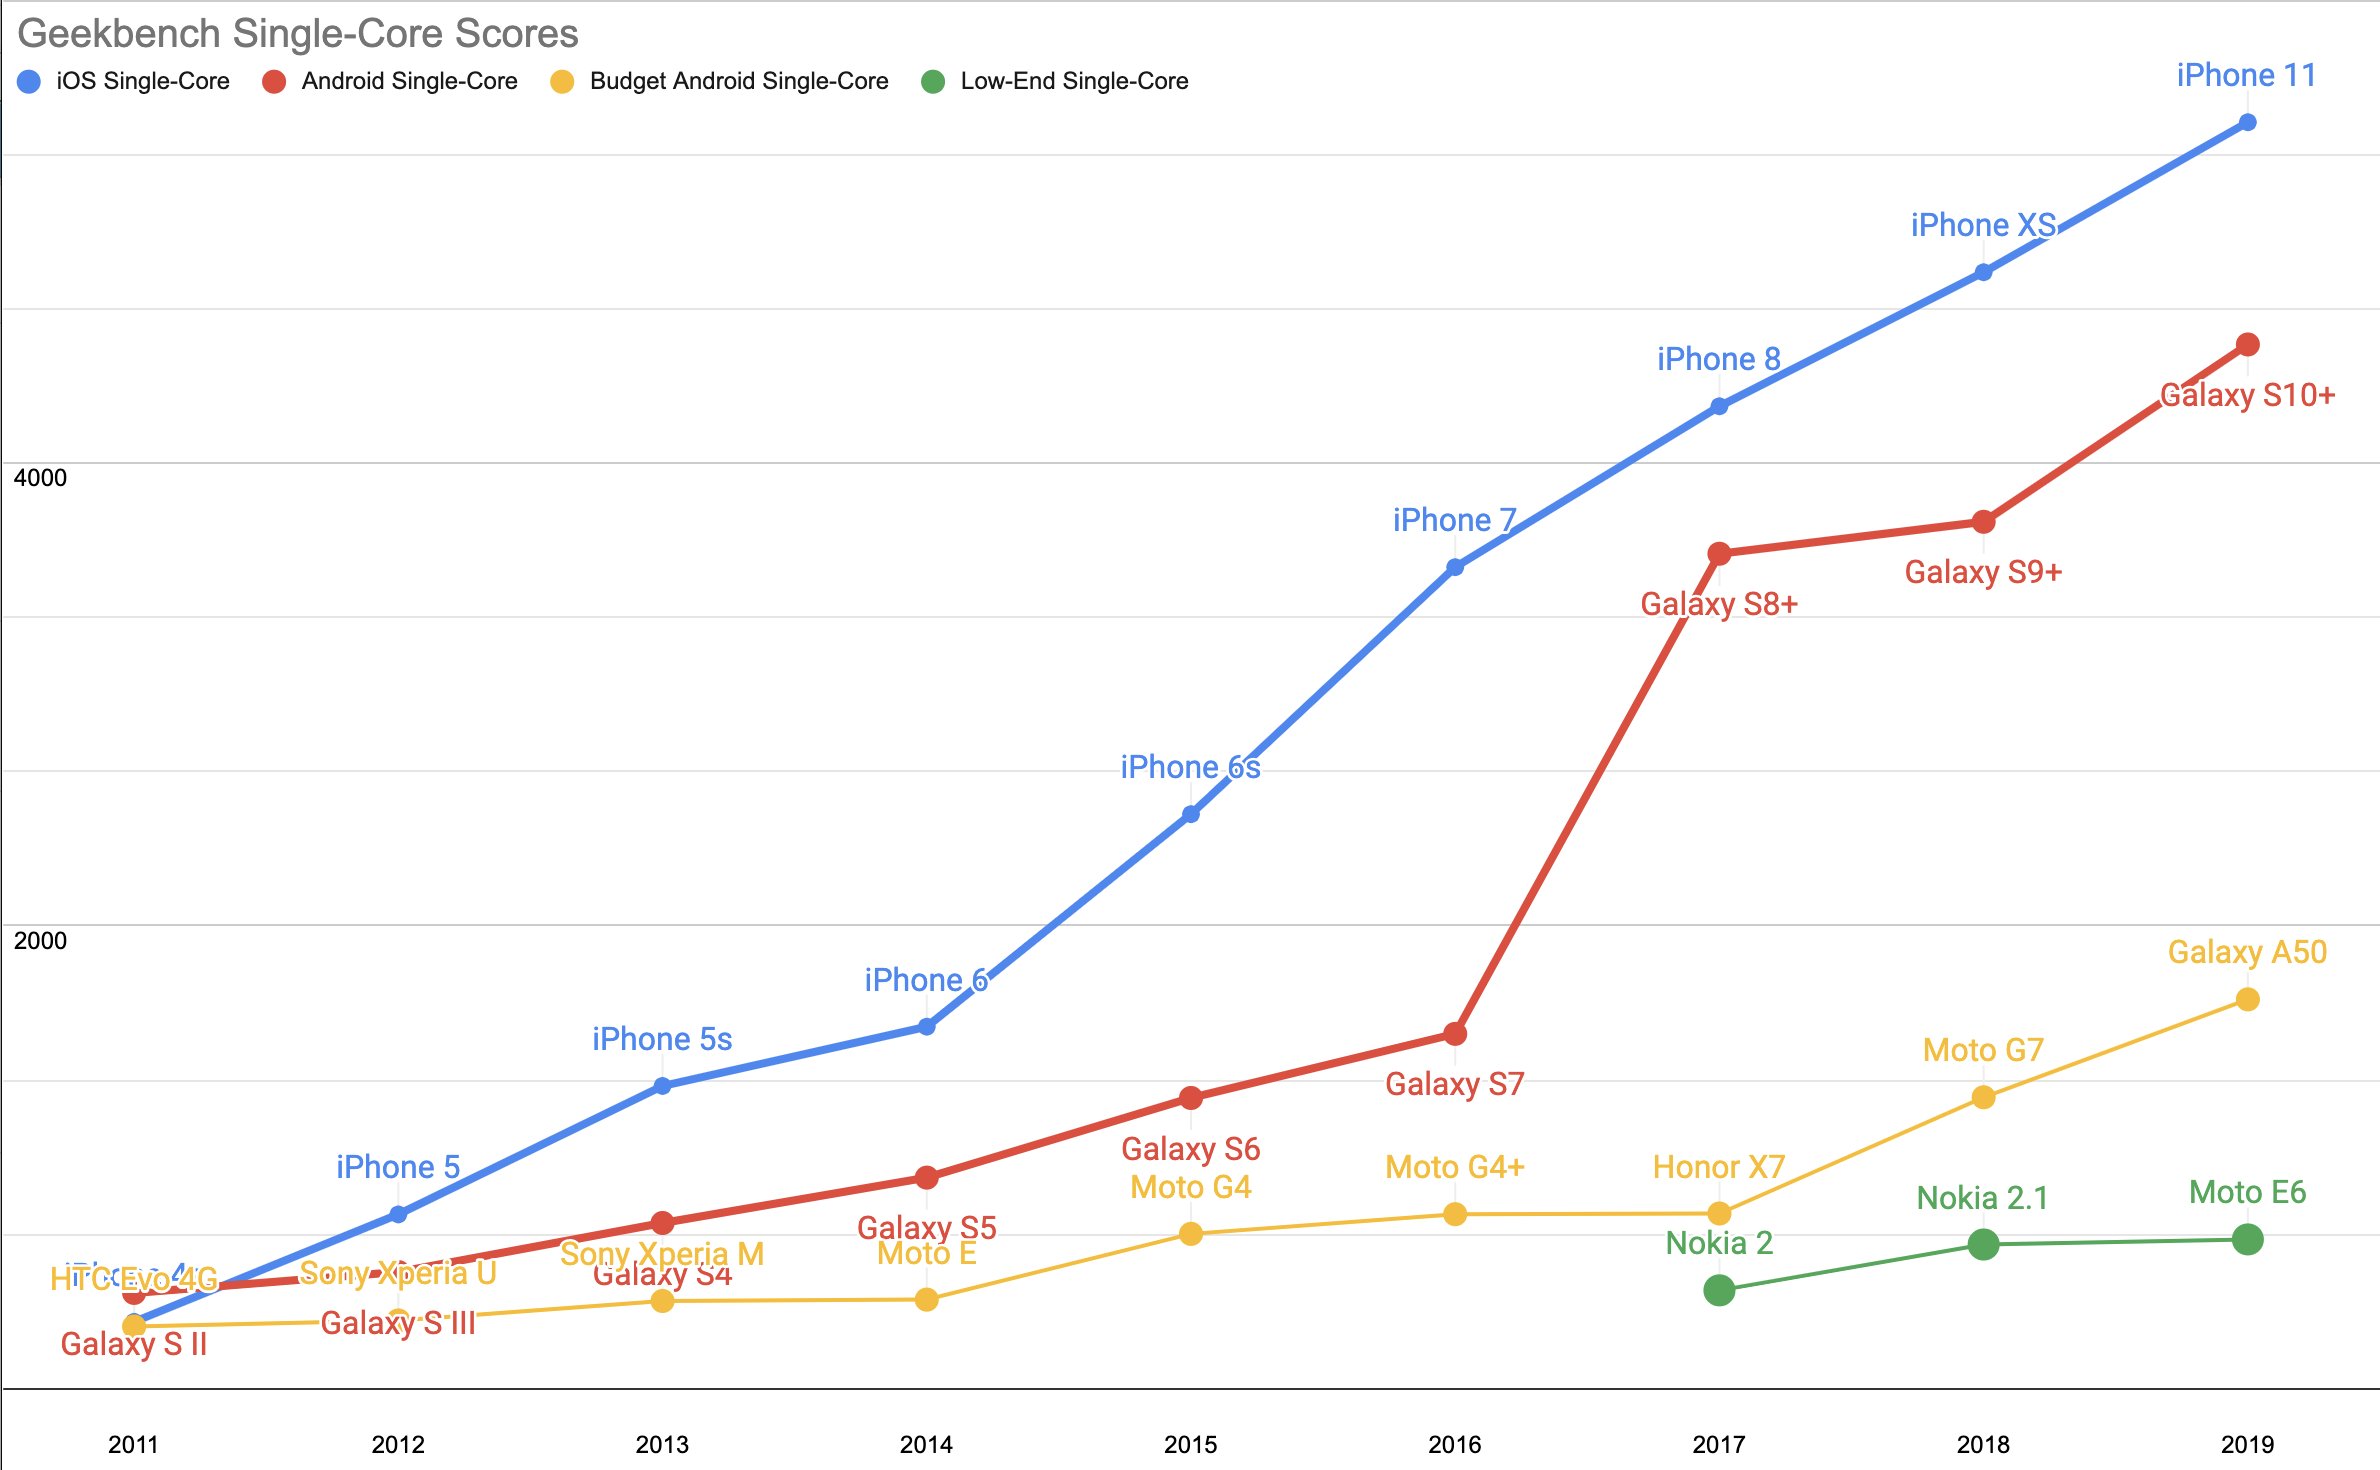
Mobile device CPU speeds
I've not been able to find data on average mobile device speeds in the US. But Alex Russel and Surma have published a chart showing GeekBench 4 scores alongside the release years of different phones.
Even budget phones have become 4x faster, with iPhones now being up to 20x more powerful.
How have browsers changed?
A lot of work has been done on browsers over the last 10 years. JavaScript has become a larger part of the web, so many improvements have focussed here.
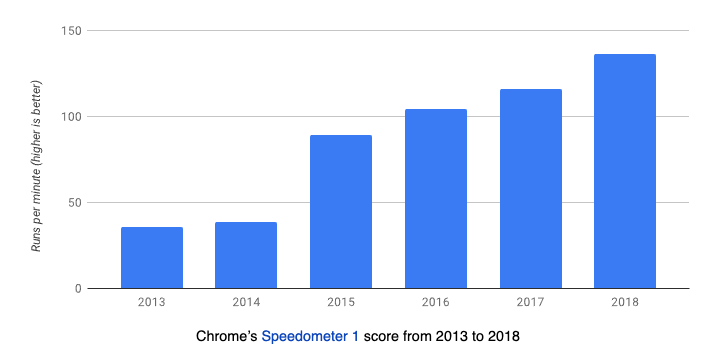
Looking at this chart from the V8 blog, page CPU usage has gone down by a factor of 4.
Networking
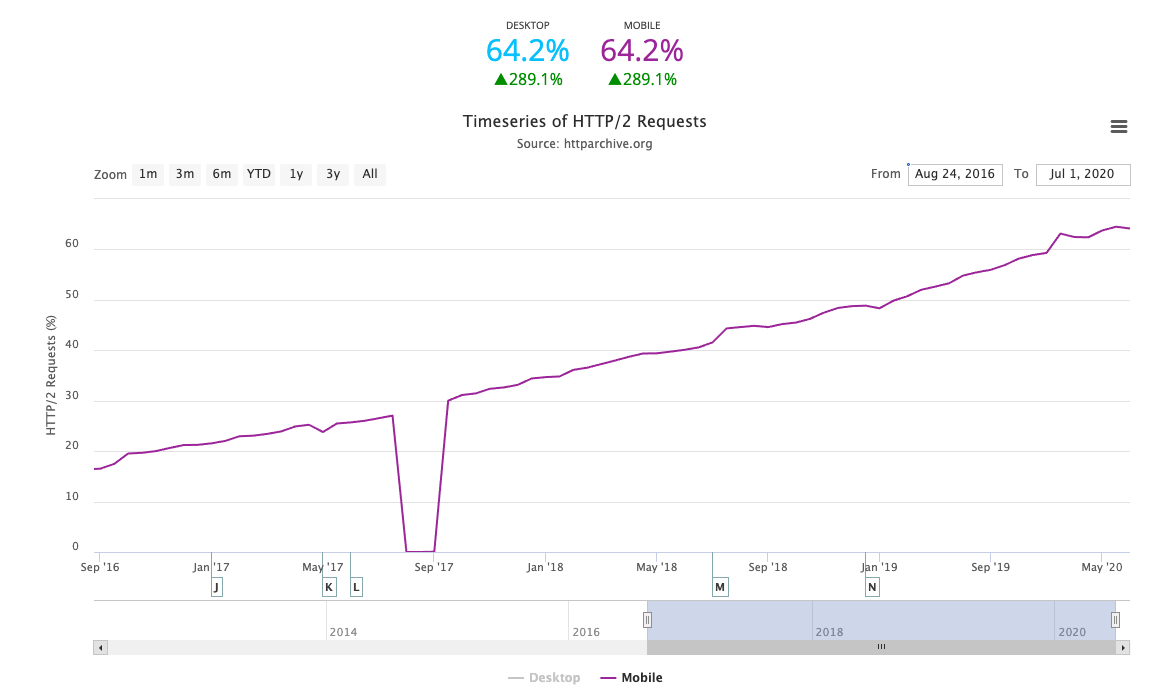
Browser networking has also improved, for example with the introduction of HTTP/2 in 2015. 64% of requests are now served over HTTP/2.
How have websites changed?
Let's look at some data from HTTP Archive to see how websites have changed.
Page weight
Mobile page weight increased by 337% between 2013 and 2020. This is primarily driven by an increase in images and JavaScript code.
Other resources also increased a lot – I suspect these are mostly videos.
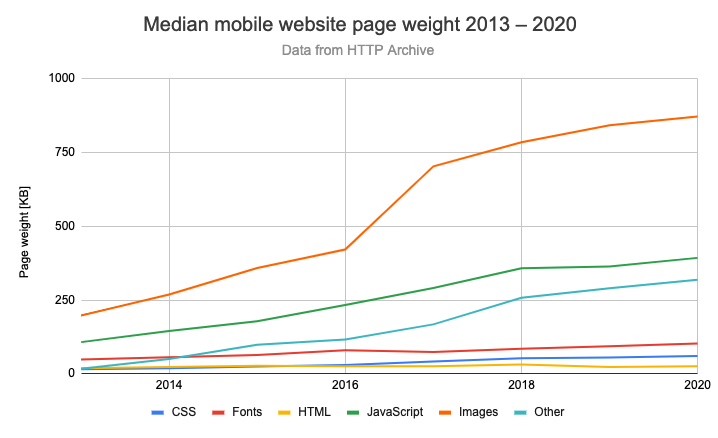
The chart starts in 2013 as HTTP Archive changed its methodology in October 2012. Before page weight was undercounted, as the test stopped when the page load event was triggered, even if more data was still being loaded.
JavaScript execution time
JavaScript would be the most likely culprit if pages are getting slower despite faster mobile networks. Unfortunately, HTTP Archive only started collecting this data in late 2017, and it seems to have been mostly stable since then.
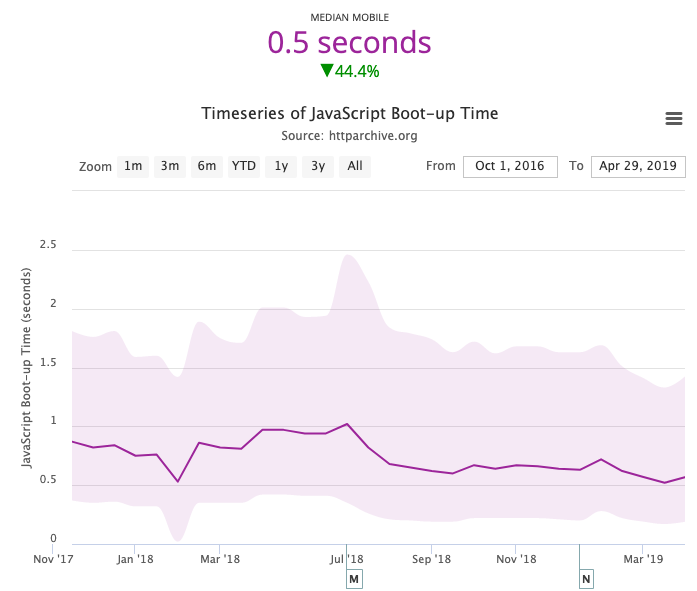
The drop in mid-2018 can probably be attributed to a URL corpus change.
Note that the absolute run duration (0.5s) is less than what you'd normally see in a tool like Lighthouse. These tools normally slow down JavaScript execution to emulate a mobile device, but this was broken for the HTTP Archive tests. So while this number might be realistic for mid-range phones, a common assumption is that budget phones are around 4x slower.
Answering whether the web has become slower
Has the web become slower? Well, it depends on what your device, network connection, and most-used websites are.
We'd need to weigh real-world performance data to get a distribution that shows how different users experienced the web over time. And should the experience of someone opening thousands of pages a day count as much as someone who only visits Facebook once a week?
I don't have detailed per-user data, but we can take a look at the question in a few different ways:
- Real-user data from the Chrome UX Report (CrUX)
- Naive modelling based on how websites and devices have changed
I also tried downloading old page versions from archive.org and testing them with Lighthouse, but wasn't able to get meaningful results in the time I had available. For example, often some images are missing from the page archive.
Data from the Chrome User Experience Report
The big limitation of CrUX data is that it's only been collected since late 2017. But we can still use it to see if the web has become slower in the last two and a half years.
Note that, unlike HTTP Archive, CrUX looks at the whole domain instead of just homepages.
The data we'll look at is the 75th percentile, meaning pages load at least this fast for 75% of users.
(I'm taking the average across websites rather than the median, which is not great.)
US page load times
CrUX data for the US does not show page performance getting worse.
The onLoad metric shows a slight improvement, maybe due to an increase in bandwidth. Or maybe more activity is now happening after the initial page load.
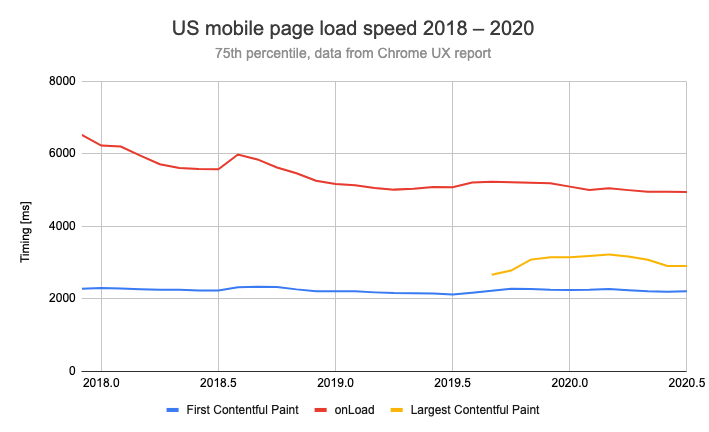
The paint metrics seem fairly stable. Largest Contentful Paint is a new metric that has only been collected since mid-2019.
The rest of the world
The downward trend in the US onLoad metric is matched by the global data. There are however significant differences in page load times across countries, with onLoad timings in India being almost twice those in South Korea.
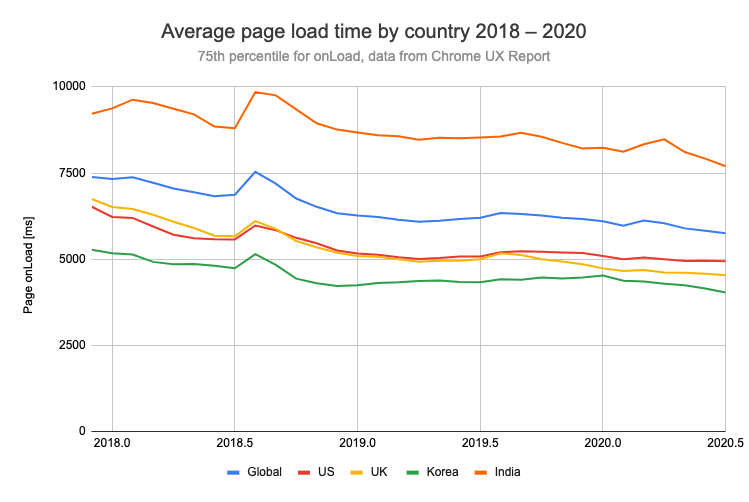
We can use CrUX data to put HTTP Archive data into perspective. In January 2020 HTTP Archive reported a median (50% percentile) load time of 18.7s, based on its synthetic data.
In contrast, CrUX suggests a load time of just 5.8s – and this is the 75th percentile.
(Note that the Global values here just take an average and are not weighed by population.)
Modelling page load times
We can create a theoretical model of how changes in devices, networks, and websites might affect overall performance.
This won't be a great model, but hopefully it will still provide some insight.
Theoretical page download time
Page weight has increased over time, but so has bandwidth. Round-trip latency has also gone down.
Downloading a file the size of the median mobile website would have taken 1.7s in 2013. If your connection hasn't improved since then downloading this much data would now take 4.4s. But with an average connection today it would only take 0.9s.
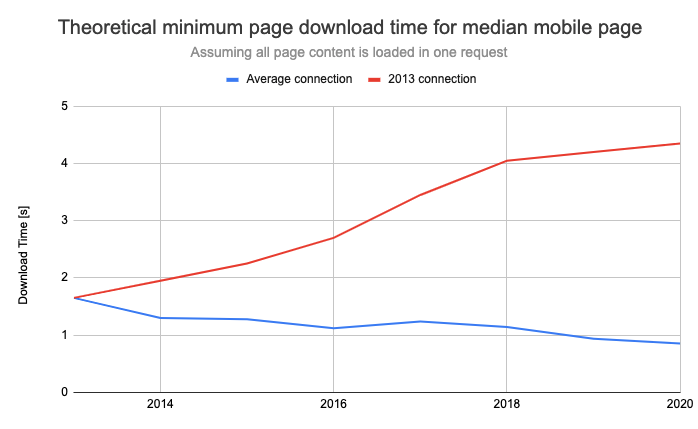
In practice, a website wouldn't consist of just a single request, and other factors like CPU processing or server latency would also affect how quickly the page loads. The onLoad times reported by HTTP Archive are 2-3 times this lower bound.
But we can still use this as an indicator that reduced latency and increased bandwidth have helped make websites load faster overall.
(I'm starting in 2013 rather than 2011, as the HTTP Archive page weight metric has only been measured consistently since then.)
CPU
I'm not quite sure how to think about this, but I'll make some guesses anyway.
Someone who used a Galaxy S4 in 2013 and now uses a Galaxy S10 will have seen their CPU processing power go up by a factor of 5. Let's assume that browsers have become 4x more efficient since then. If we naively multiply these numbers we get an overall 20x improvement.
Since 2013, JavaScript page weight has increased 3.7x from 107KB to 392KB. Maybe minification and compression have improved a bit as well, so more JavaScript code now fits into fewer bytes. Let's round the multiple up to 6x. Let's pretend that JavaScript page weight is proportional to JavaScript execution time.
We'd still end up with a 3.3x performance improvement.
Conclusion
Websites today run more code and are multiple times larger than websites 10 years ago. Still, I don't think the mobile web – as experienced by users – has become slower overall.
At the same time, a lot more people now experience the mobile web. This will drag down the overall experience people have with web performance.
The processing power of mobile devices is catching up to desktop devices, as is network bandwidth. At the same time, new cheaper low-end devices are introduced.
There are two ways to look at the data. On the one hand, the web is slowly getting faster. On the other hand, the improvements in networks and devices represent a missed opportunity for more significant performance improvements.
Make your website a fast one
Want to see how fast your website is? Run a test with our free page speed test. We'll tell you how fast your website is for real users and what you can do to optimize it.
If you're actively working on your website speed, we also offer a website performance monitoring service. Check that your optimization efforts are effective and get alerted to performance regressions early on.


Monitor Page Speed & Core Web Vitals
DebugBear monitoring includes:
- In-depth Page Speed Reports
- Automated Recommendations
- Real User Analytics Data