How to Minimize Main Thread Work
Large amounts of main thread work can slow down your website. This article explains what main thread CPU activity is, how to measure it, and how to reduce main thread work.
What is main thread work?
Computers divide work into different processes and threads that mostly run independently from each other. This also lets them take advantage of multiple CPU cores and split work between them.
When rendering a web page most of the work usually happens in the main thread. For example, this is where the page layout is calculated and where the different elements on the page are painted. By default, JavaScript also runs on the main thread, and user input is handled there.
Minimizing main thread work is important as the page can't respond to user input if the event handler code is blocked by other work. These performance problems are reflected in metrics like Total Blocking Time and Interaction to Next Paint.
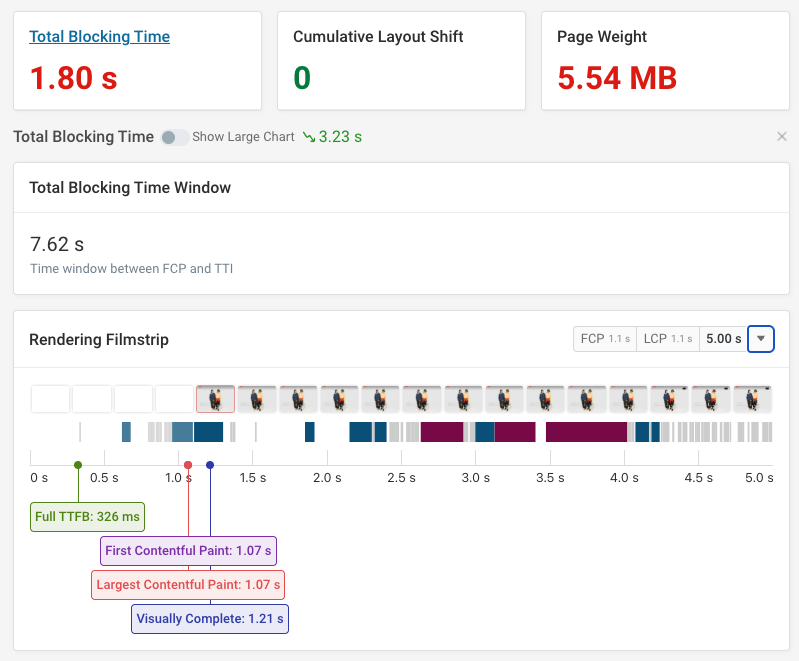
This screenshot from the DebugBear website speed test shows slow main thread CPU tasks along with the page rendering filmstrip.
A high amount of main thread work can also indicate that it takes a long time for the page to be fully rendered. For example, rendering a single page app (SPA) often requires a lot of time running JavaScript on the browser main thread.
However, not all work is done on the main thread. For example, these tasks might be done in separate threads:
- Compositing (combining separate painted layers)
- Parsing JavaScript code
- Running code in web workers
Work that's done off the main thread usually has a lower performance impact.
Do you need to minimize main thread work?
Before beginning to optimize, keep in mind that main thread work does not directly impact user experience. For example, Lighthouse shows it as a Diagnostic metric, but it doesn't impact the overall Performance score. Instead of looking only at main thread work, check user-centric metrics like the Core Web Vitals to see how these CPU tasks affect your site performance.
Two seconds of work done before the initial render of the page will significantly slow down your website. But if a chat widget loads five seconds after all other content is visible, that will have a much smaller impact on your users.
How to minimize main thread work
What causes CPU activity on the main thread depends on your app, so the best way to minimize main thread work is to understand what your app is doing. Usually creating a performance recording in Chrome DevTools is the best way to do this.
However, here are a few common issues that cause large amounts of main thread work and how to fix them.
Optimize single-page apps
JavaScript apps (e.g. using React or Angular) often consist of large amounts of custom code as well as many different libraries. Compiling and running this code can take a lot of time. You can reduce this by removing unused code and splitting your JavaScript app into separate bundles that can be loaded independently.
Note that with server-side rendering the page is rendered before the client-side app initializes. This way the amount of main thread work is the same, but the user impact is much lower as the page content becomes immediately visible.
Reduce third-party scripts
Many websites pull in resources from a variety of different providers, for example to show ads or a chat widget. Unlike with first-party code, you can't fix performance issues arising from these scripts yourself. Try contacting the customer support of the provider to see if they can help.
If that doesn't work, you have two options:
- Remove the third-party script, fixing the performance impact
- Create a "facade", e.g. by showing a placeholder for a chat widget and only loading the full widget when the user tries to interact with it.
You should also ensure that third-party code isn't render-blocking, to reduce the performance impact on the user experience.
The Partytown library can move third-party processing work off the main thread, speeding up page speed and user interactions.
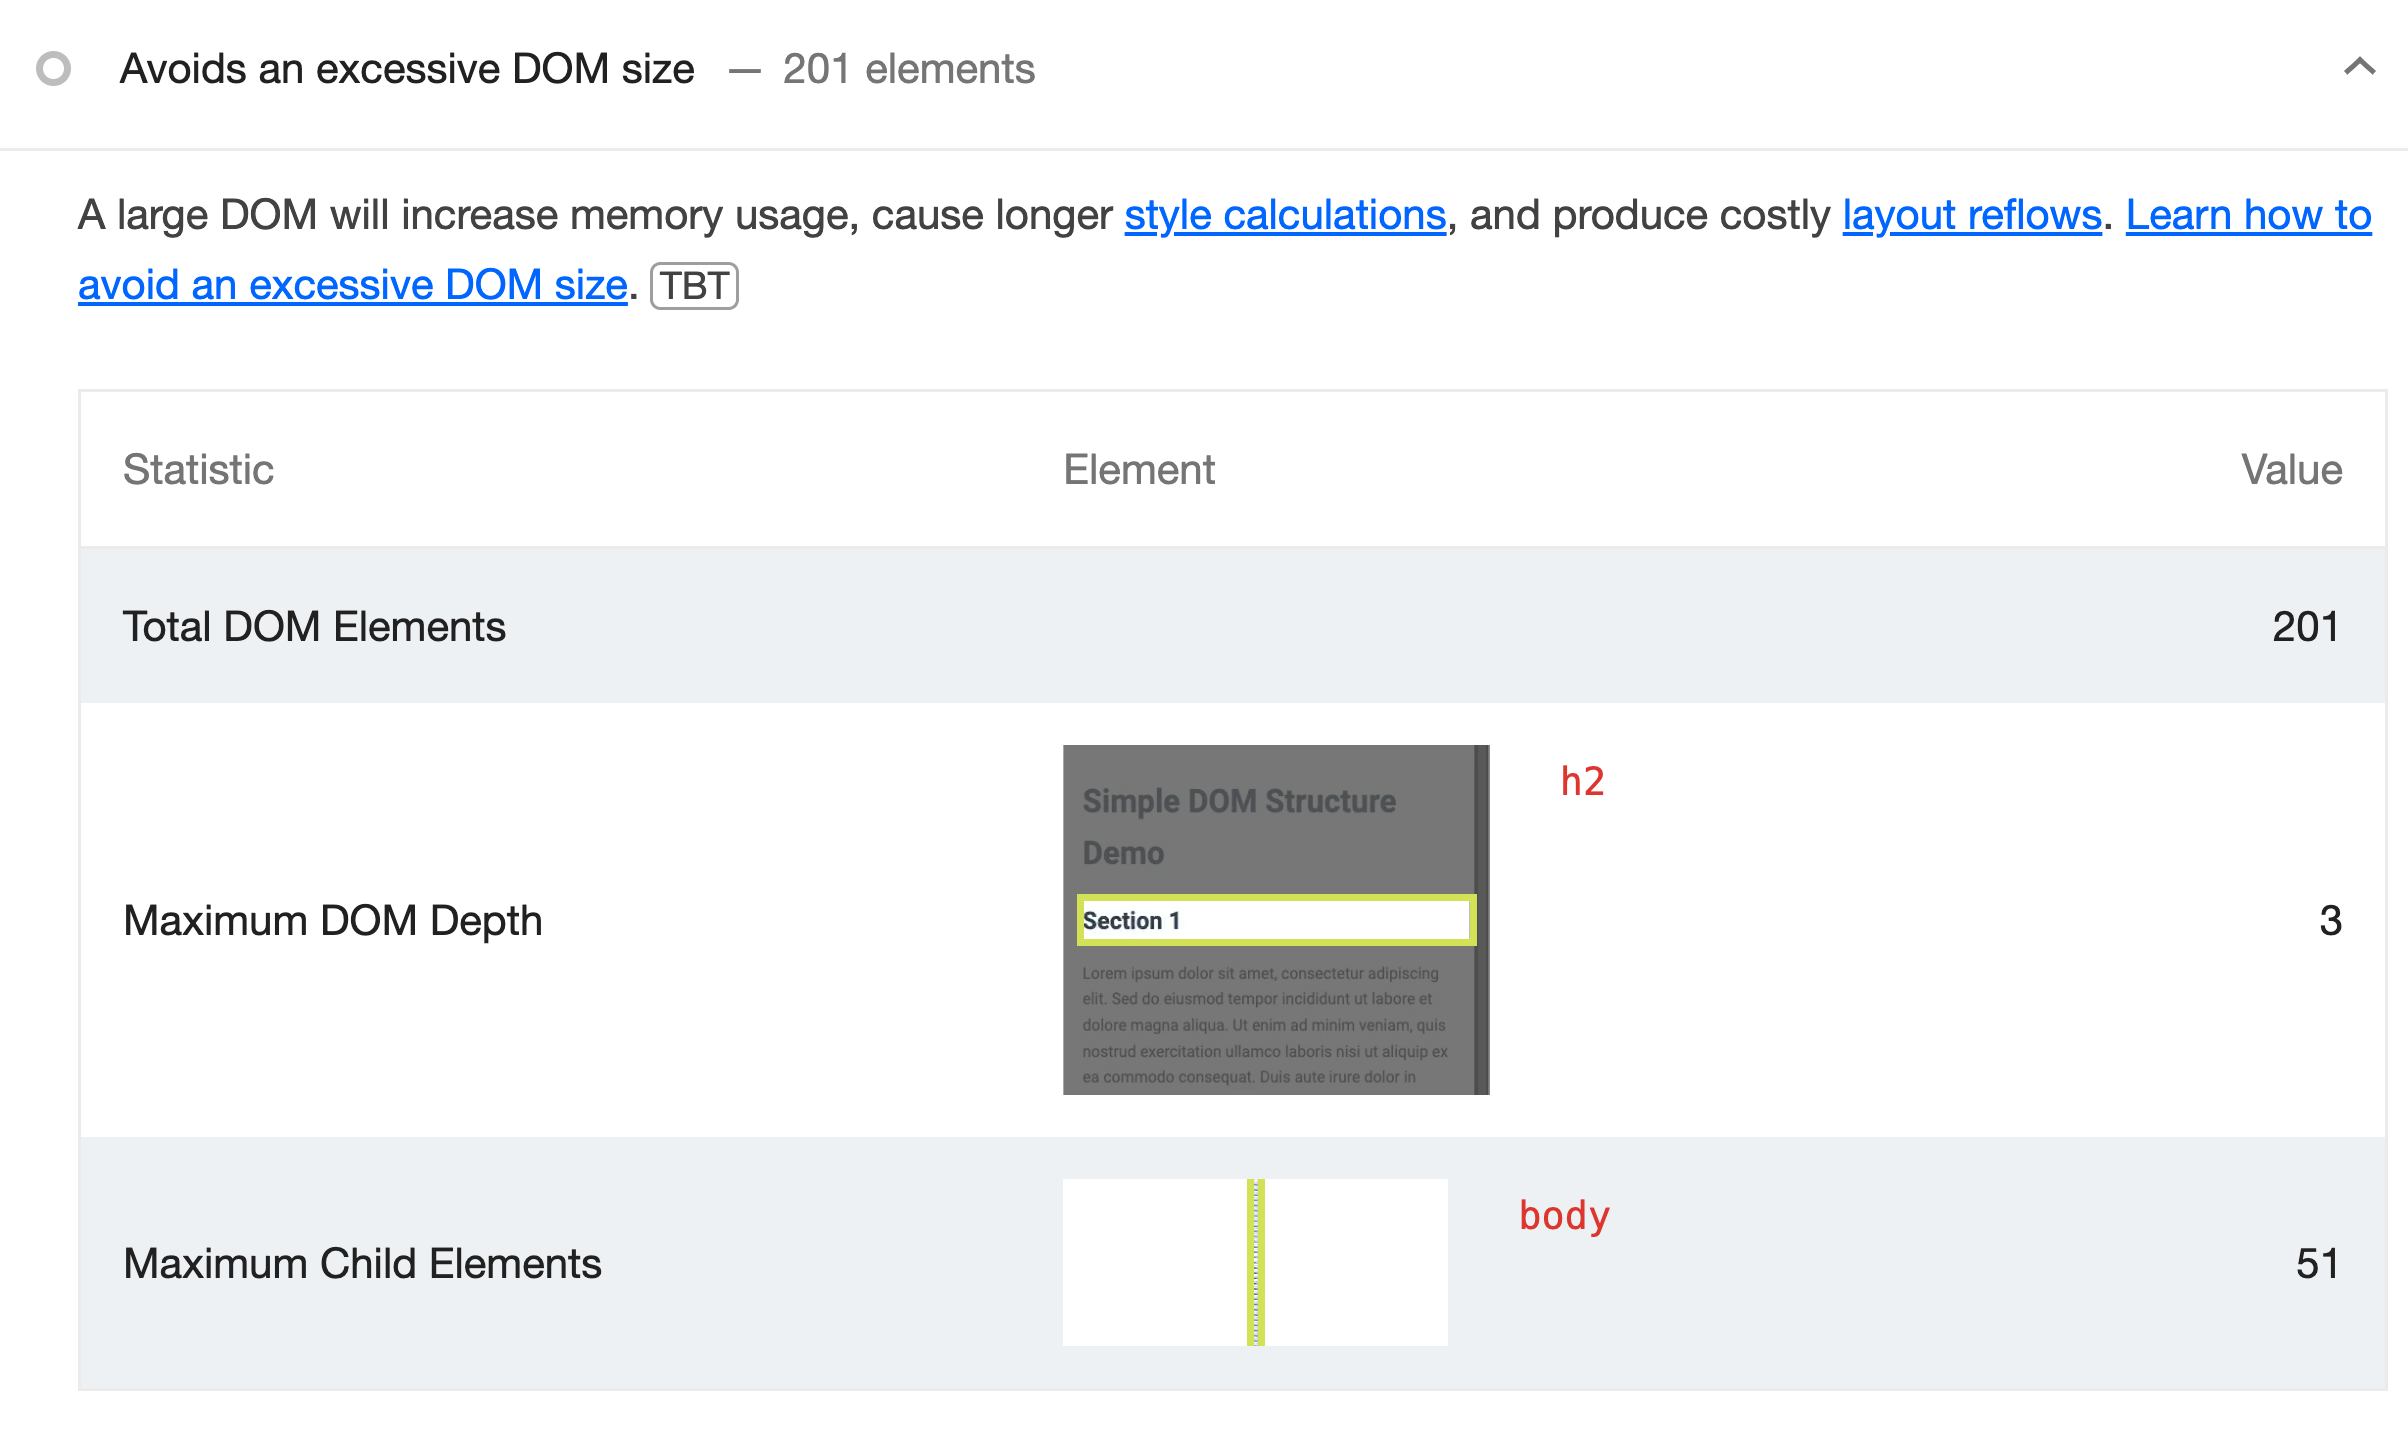
Reduce DOM size
The DOM is a representation of content on the page, based off the initial page HTML but with additional modifications made by JavaScript. The larger the DOM, the more processing is required for the browser to render page content.
By reducing excessive DOM size you can free up time on the main thread.
How to measure and analyze main thread work
There are a few tools that you can use to check main thread work on your website:
- Chrome DevTools
- Google Lighthouse
- DebugBear
Main thread work in Chrome DevTools
Chrome DevTools lets you see exactly what happens on the main thread, so you can identify what CPU activity can be avoided.
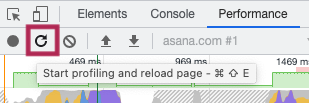
Start by opening DevTools, selecting the Performance tab, and collecting a performance profile.
The performance recording can be really complex, but we'll quickly narrow it down so we only need to look at main thread tasks.
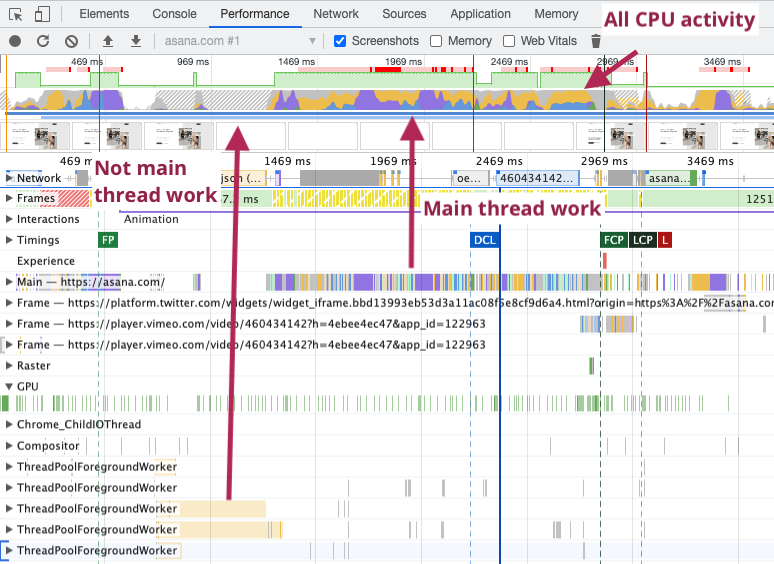
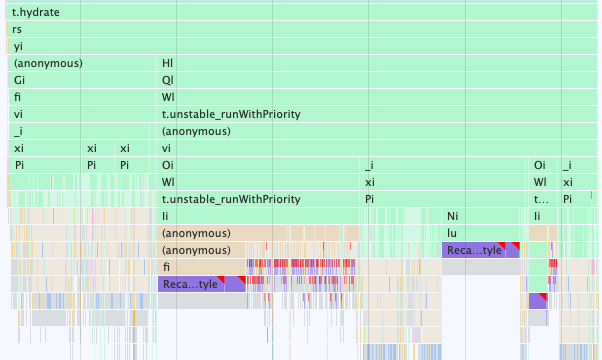
At the top of the recording we see all CPU activity. If Chrome shows a background with diagonal stripes the CPU task happened off the main thread. For example, in this recording there's a worker task that parses and compiles JavaScript code.
Main thread tasks are shown with a solid background. A different color is used for each type of CPU task, for example rendering the page or running JavaScript.
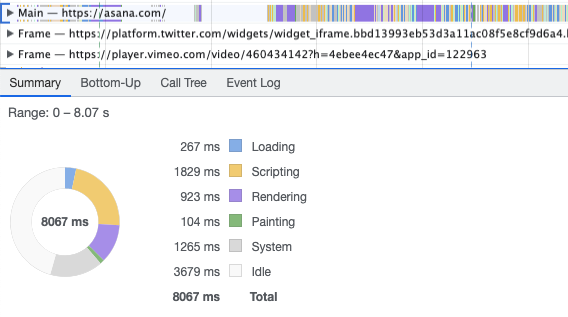
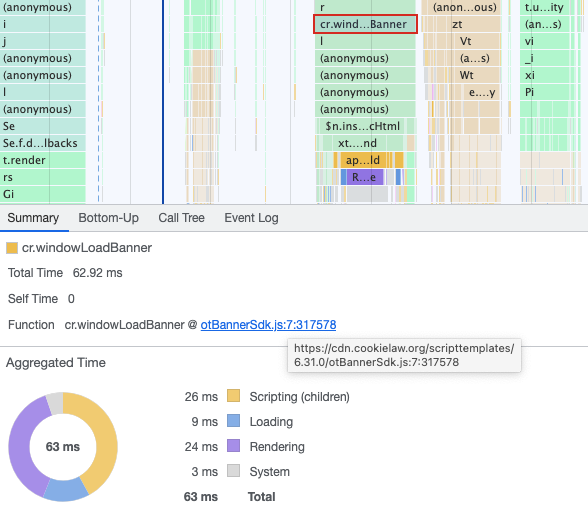
You can click on each lane in the performance recording to view more details. The blue bracket on the left indicates what lane is selected. After selecting the main thread lane DevTools shows an overall breakdown of main thread CPU activity on the page.
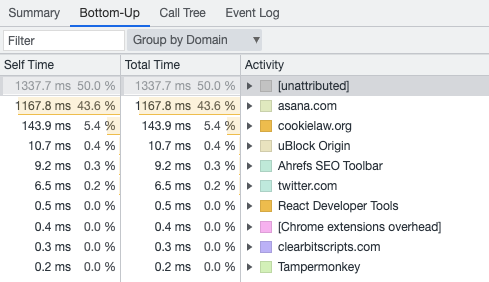
We can also select the Bottom-up view and group activity by domain in order to see whether our own code or third-party code is responsible for the CPU activity.
In this case the cookielaw.org domain also contributes to CPU activity, as well as several Chrome extensions that I've installed.
Click the arrow icon to expand each lane. For the main thread, this shows us a call stack with all the bits of code involved. Here we're looking at a public website with minified source code, so we get meaningless function names like y and c.O. For your own website, you or a developer you're working with can run a test without minification, which will be easier to interpret.
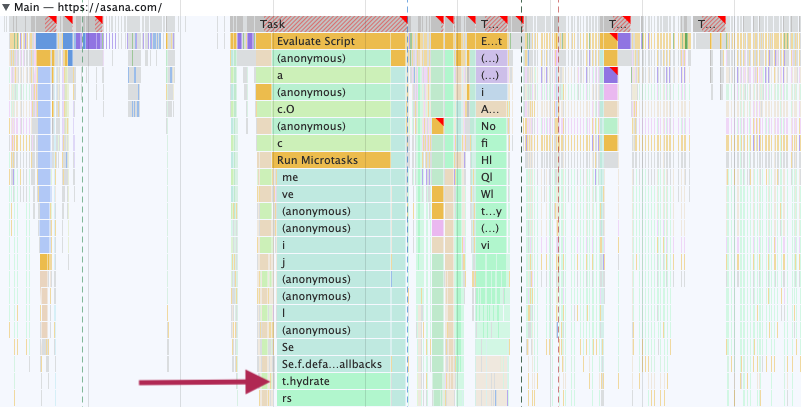
Despite the minified code we can see that a lot of work is done in a function called t.hydrate. This indicates that the page contains a client-side app that was pre-rendered on the server, and is then transformed from static HTML to an interactive app ("hydrated").
Zooming in shows that part of the hydration process involves repeated style recalculations (in purple). This is usually something to avoid, as work ends up being duplicated.
Let's look at the next big chunk of CPU work. After clicking on one of the CPU tasks, Chrome shows a breakdown of CPU activity for that task, as well as the URL that it's attributable to. In this case that's the OneTrust Banner SDK.
Read this article for an in-depth guide on how to profile your website using the Chrome DevTools Performance tab.
Main thread work in Lighthouse
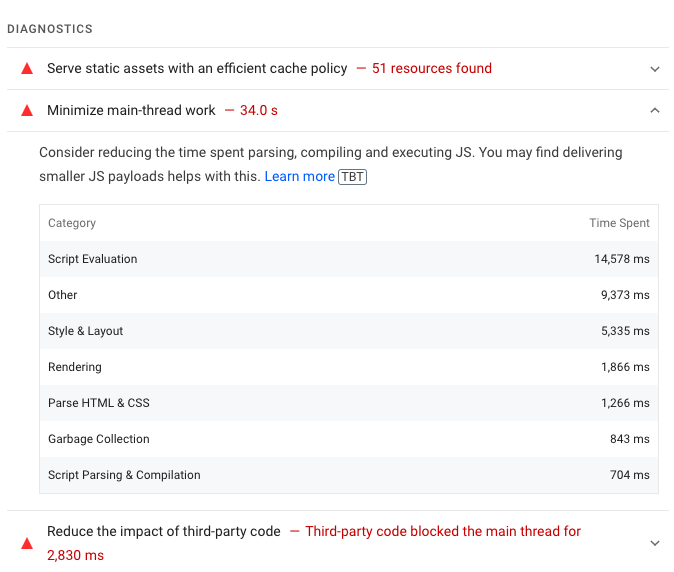
Google's Lighthouse tool, which also powers the PageSpeed Insights lab data, can give you a breakdown of main thread work by activity type. Long chunks of CPU activity will increase the Total Blocking Time metric.
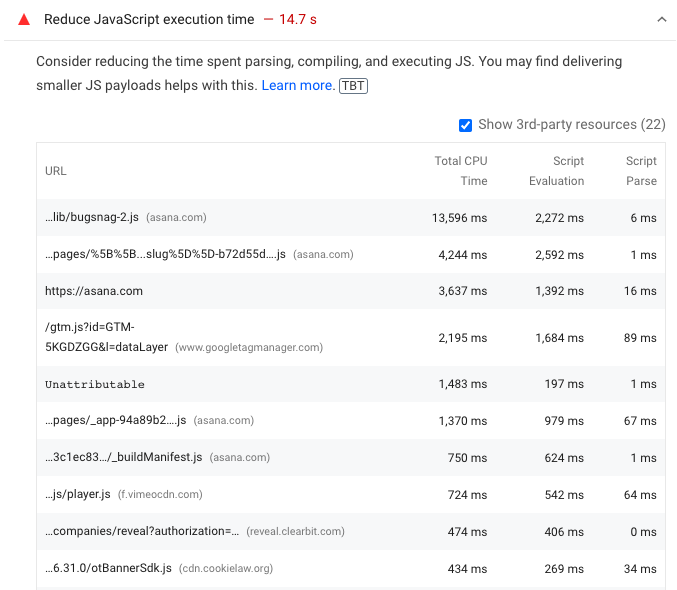
The "Reduce JavaScript execution time" audit also breaks down main thread CPU activity – work done off the main thread is not included.
The "Avoid long main-thread tasks" audit lists individual long CPU tasks to help you with "identifying worst contributors to input delay". Input Delay is one of the three components that make up your overall Interaction to Next Paint score.

Finally, Lighthouse can identify third party code that's used on your website. The "Reduce the impact of third-party code" shows what third parties were detected and how big their impact was. If a third-party JavaScript file has a big impact on performance you can reconsider whether it's worth the cost.
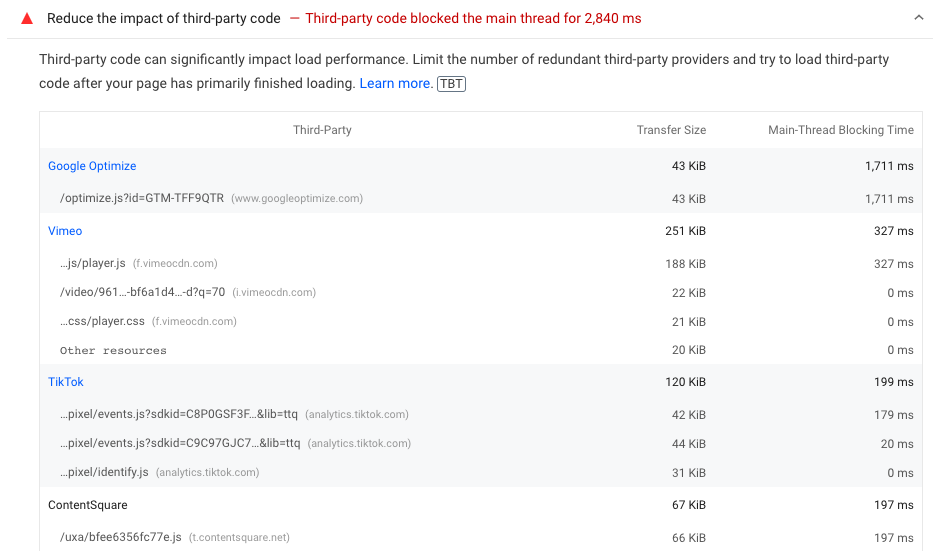
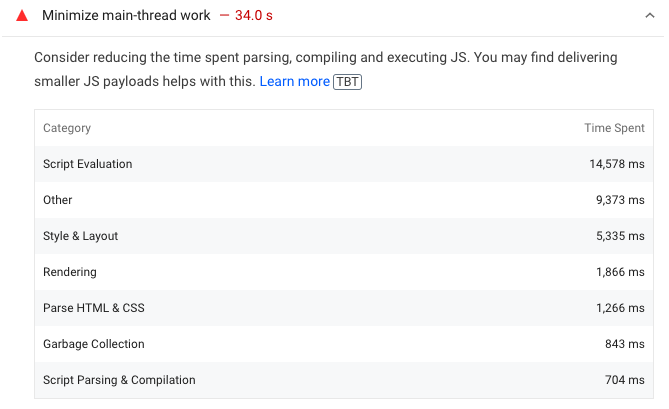
Lighthouse emphasizes that main thread work doesn't just come from JavaScript execution, but also from parsing and compiling JavaScript:
Consider reducing the time spent parsing, compiling, and executing JS. You may find delivering smaller JS payloads helps with this.
Main thread work in DebugBear
DebugBear can track CPU activity over time and alert you when there's a regression. Each test result also includes a full Lighthouse report.
Identify which of your own files slows down your website or what third-party scripts are causing problems.
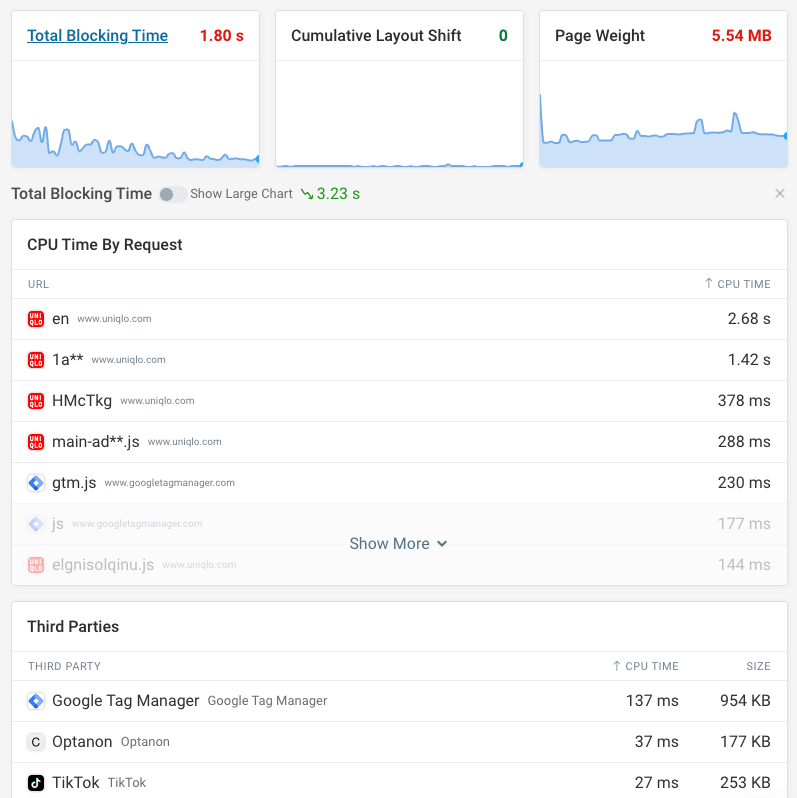
DebugBear also monitors the high-level performance metrics for your website, including data from Google's Chrome User Experience (CrUX) report which impacts SEO.

What are the different CPU activity categories used in Lighthouse?
Lighthouse uses the following categories:
- Script Evaluation
- Style & Layout
- Rendering
- Parse HTML & CSS
- Garbage Collection
- Script Parsing & Compilation
- Other
The Lighthouse source code shows exactly what's included in each category.
DebugBear also reports JS time, which combines JavaScript Parse/Compile time with Script Evaluation time.
You may see a large amount of "Other" activity for a visually complex page. Many web performance testing environments don't have a GPU, so additional CPU work is required instead.
Identify main thread tasks in real user data
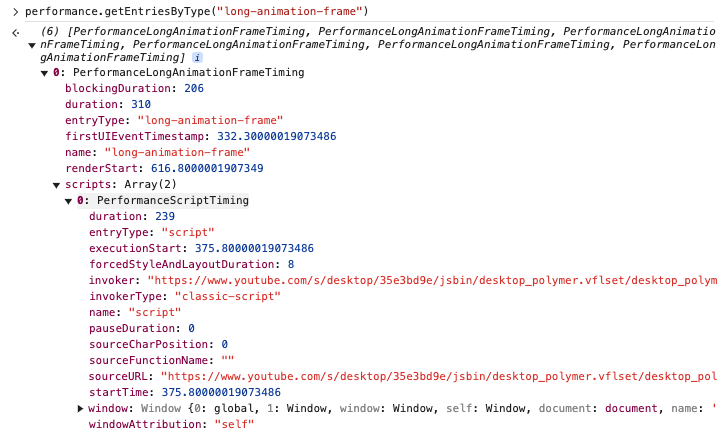
You can identify long CPU tasks that impact rendering in the browser by using the Long Animation Frames API in JavaScript.
performance.getEntriesByType("long-animation-frame");
By running this code you can get a list of frames along with script timing entries. Each script timing tells you the duration of the script execution as well as the script URL.
DebugBear real user monitoring also supports the Long Animation Frames API. When a page view is collected you can view any scripts that delayed a user interaction.

Main thread work and Interaction to Next Paint
Interaction to Next Paint measures how quickly your website responds to user interactions. Main thread tasks that are active when the user clicks on the page, or that run in response to the click event, delay the next paint and cause the page to appear frozen.
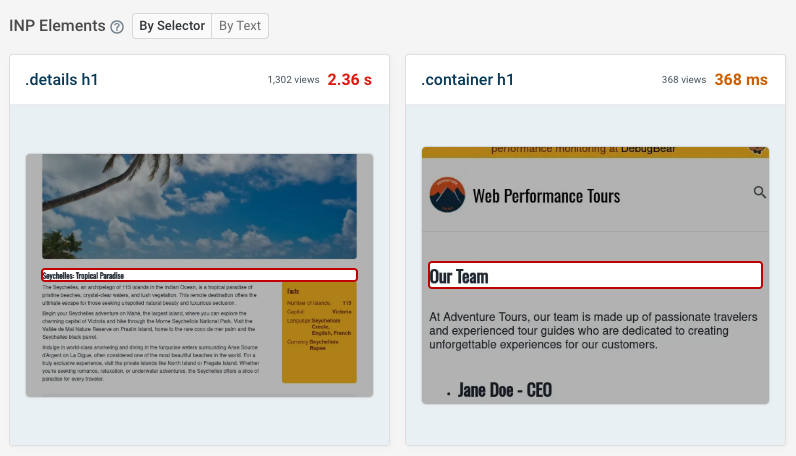
To debug Interaction to Next Paint issues you can set up real user monitoring, as interactions can't easily be tested in a synthetic environment. The first step to debugging slow interaction is identifying what elements users are interacting with!
DebugBear offers a handy breakdown of interactions and what their INP score is. You can view the data both as a visual view with screenshots, as well as manually reviewing CSS element selectors.
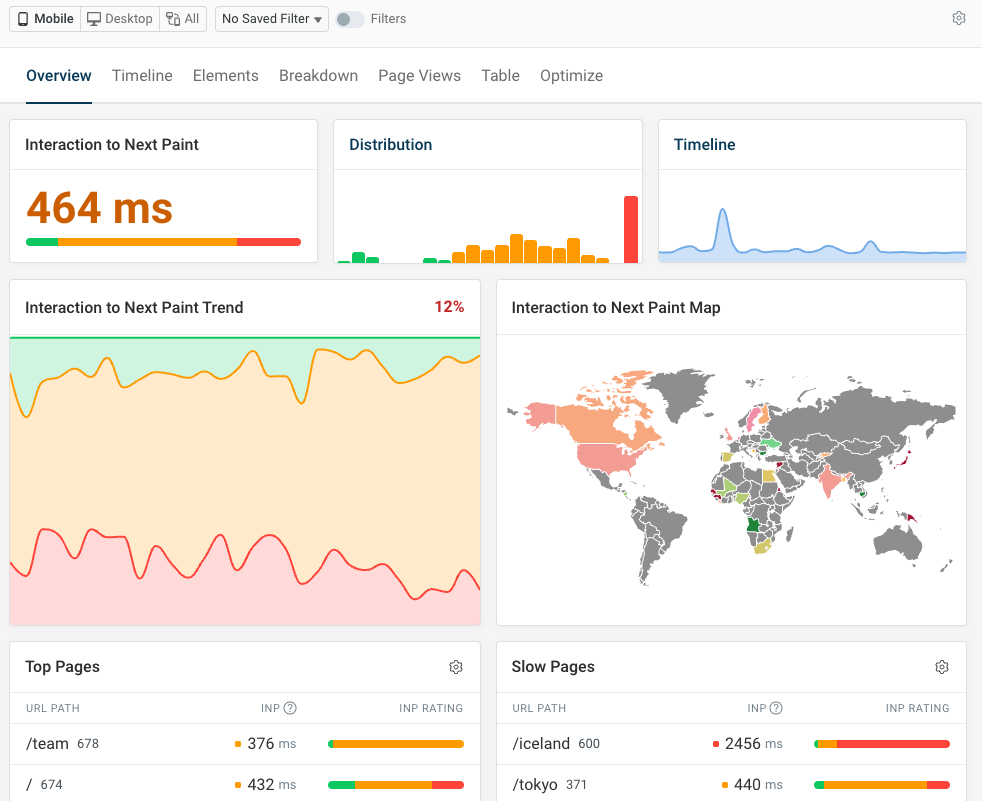
You also get a higher-level breakdown of INP and other Core Web Vitals across your website. That way you can identify slow pages that get a lot of traffic, where many visitors are impacted by the performance issues.


Monitor Page Speed & Core Web Vitals
DebugBear monitoring includes:
- In-depth Page Speed Reports
- Automated Recommendations
- Real User Analytics Data