Google released Lighthouse version 8 this week. This article looks at how the Performance score and Lighthouse report have changed compared to version 7.
Updated Performance score
The Lighthouse Performance score is made up of 6 different metrics. The weighting of each metric is adjusted over time.
In Lighthouse v8, Cumulative Layout Shift now accounts for 15% of the overall score, compared to just 5% in v7. Total Blocking Time has also increased in importance, from 25% to 30%. These changes reflect the increased focus on Core Web Vitals.
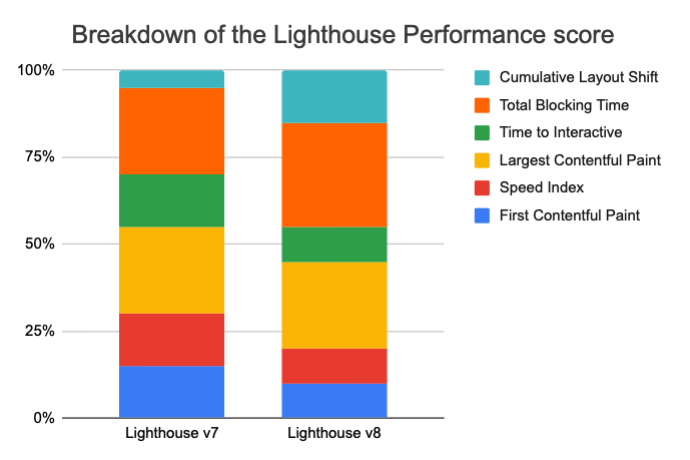
The metrics that have been deprioritized are First Contentful Paint, Speed Index, and Time to Interactive.
Metric score updates
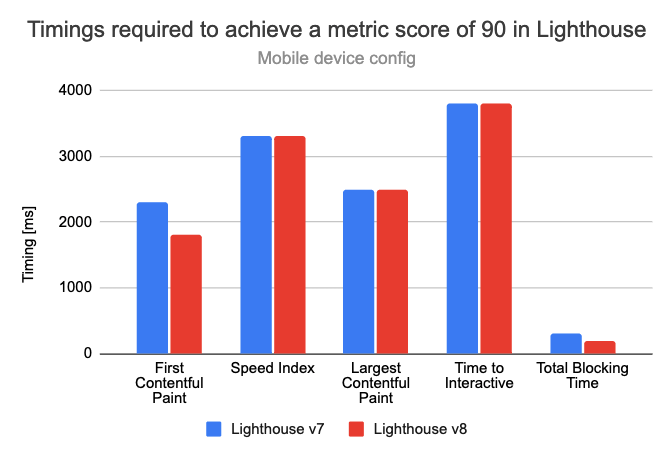
In addition to updating the weighting of each metric, the way individual metrics are scored has also changed for First Contentful Paint and Total Blocking Time.
In both cases scoring has become stricter. To get an FCP score of 90 a page now has to render within 1.8s, compared to 2.3s in Lighthouse v7.
Impact of these changes
Overall, Google says that 20% of sites will see a drop in their Performance score, 20% will see no change, and 60% will see an improvement.
Keep in mind that the Lighthouse Performance score is the result of a lab test. The Core Web Vitals that Google uses as a ranking factor are collected from real users.
Cumulative Layout Shift changes
Starting with Lighthouse 7.5, CLS not only counts layout shifts in the main frame but also in embedded iframes.
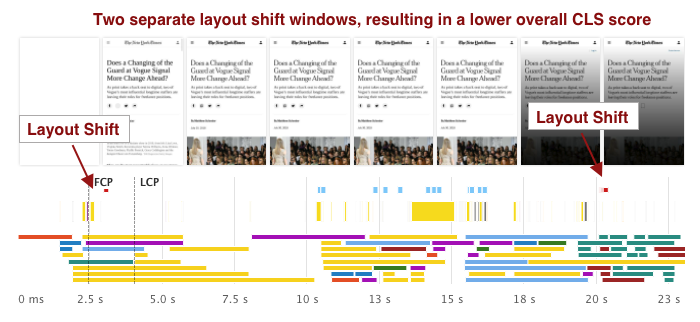
Additionally, Lighthouse 8.0 uses the new "windowed" definition of CLS. That means layout shifts that happen around the same time (in a window of up to 5s) are grouped together. The window with the greatest amount of layout shift is used to calculate the CLS metric.
This is in contrast to the previous definition, which added up all layout shifts throughout the entire existence of a page. On long-lived pages, for example in single-page apps, this approach resulted in inflated CLS values.
While the new CLS definition will mostly affect values collected from real users who interact with the page over a longer period of time, some pages also see improvements in lab-based tests. For example, this New York Times article saw a decrease in the CLS score.
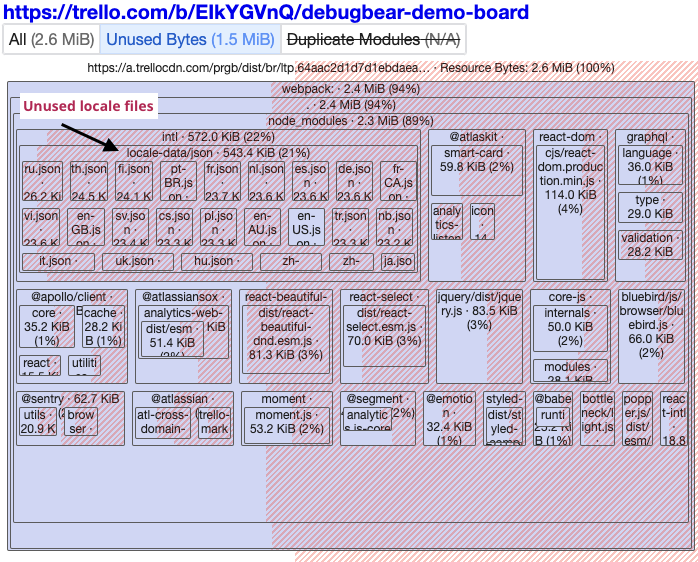
JavaScript treemap and code coverage
Lighthouse now includes a treemap view showing JavaScript page size across different bundles. You can access it through the View treemap button near the top of the Performance section.
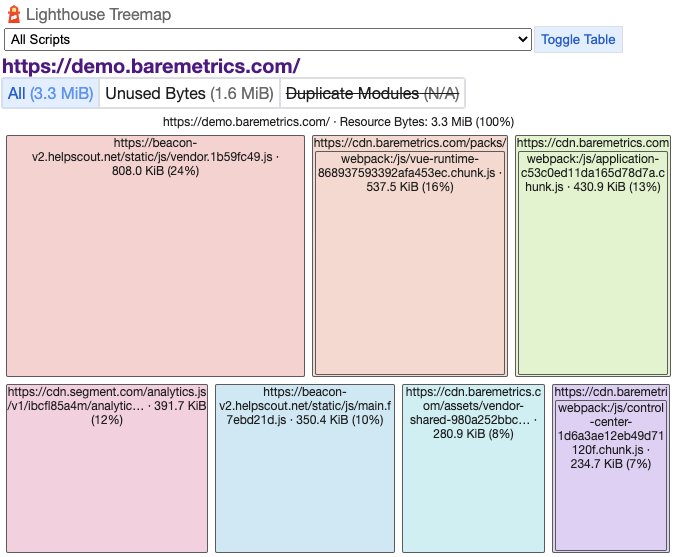
If your app provides public source maps Lighthouse will break down bundle size by source file. Chrome also collects code coverage data, showing which parts of the code are run and which parts are unused. Click Unused bytes to highlight the percentage of unused code in red.
In this example we can see that a JavaScript bundle from Trello loads the intl module. However, while over 10 languages are loaded only one is actually used by the page.
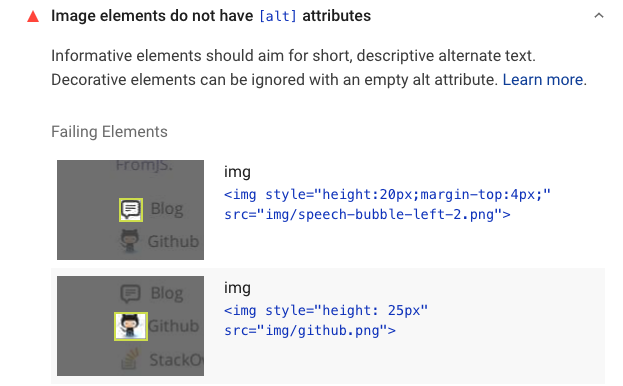
Element screenshots
Many Lighthouse audits report errors related to specific DOM elements. But sometimes it can be difficult to identify these just by their HTML code, so Lighthouse now includes screenshots highlighting the DOM element causing the issue.
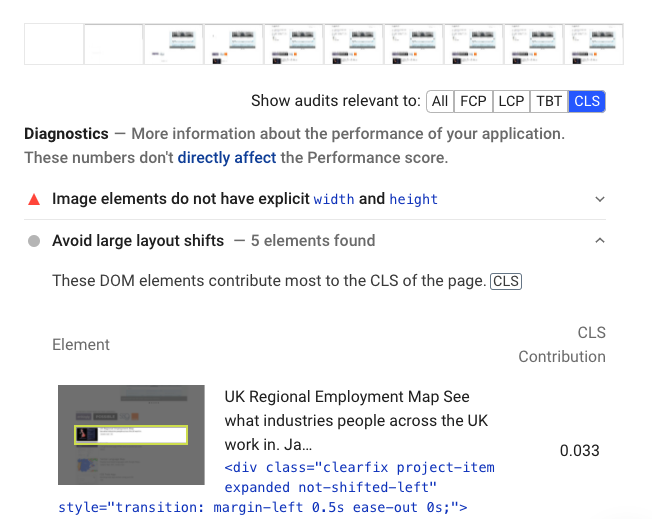
Metric filter
A small change, but a super handy one: if you're seeing issues with a specific performance metric you can now select it and view audits that highlight opportunities to improve the metric.
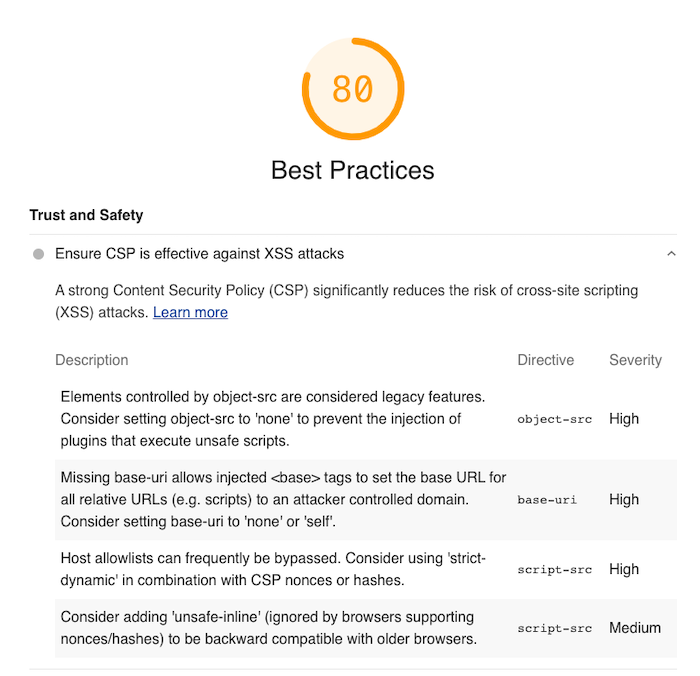
Content Security XSS Audit
A Content Security Policy (CSP) can prevent cross-site scripting (XSS) attacks, where an attacker can run their own code on your website and gain access to the data of other users.
The Lighthouse Best Practices category now checks if your website has a Content Security Policy, and shows how it could be improved.
Lighthouse 8.0 on DebugBear
DebugBear now runs Lighthouse 8.0 and continuously monitors Lighthouse scores and performance metrics. Get in-depth reports showing exactly what Lighthouse audits caused your scores to go up or down.
Start monitoring Lighthouse scores!