
Magento and Adobe Commerce are among the leading e-commerce platforms. Merchants love it because of how extensive the platform is thanks to its open-source nature.
Unfortunately, Magento doesn’t have the best reputation when it comes to site speed; its legacy JavaScript stack often falls behind modern competitors like Shopify, and installing too many custom modules can be heavy on server resources. A slow site can lead to higher bounce rates, lower conversion rates, and cart abandonment.
Despite these drawbacks, a Magento store can be optimized to score well in Google's page metrics and deliver a fast user experience.
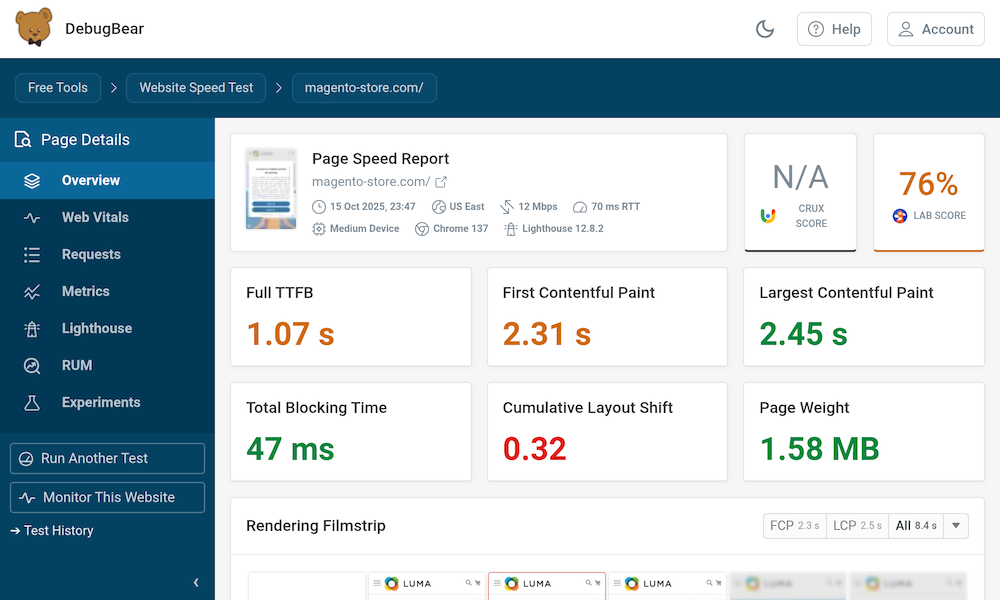
To get started, run your site through the DebugBear Free Website Speed Test to get a baseline of your current performance. Then, in this step-by-step guide, I will show you how to detect and resolve the most common performance issues that can affect your Core Web Vitals.
What Metrics Are Important?
Google uses various metrics to rank your page against other similar websites. Website performance is a key factor, so it’s important to continuously monitor your Core Web Vitals to ensure your site doesn’t drop in the page rankings. These vitals are:
- Largest Contentful Paint (LCP): Measures how quickly the main page content, like the primary product image or banner, renders. A slow LCP can make your site feel broken and cause users to leave before they've even seen your product.
- Cumulative Layout Shift (CLS): Measures the visual stability of the page. High CLS on an e-commerce site is particularly damaging, as it can cause a user trying to click "Add to Cart" to accidentally hit the wrong button when the layout unexpectedly shifts.
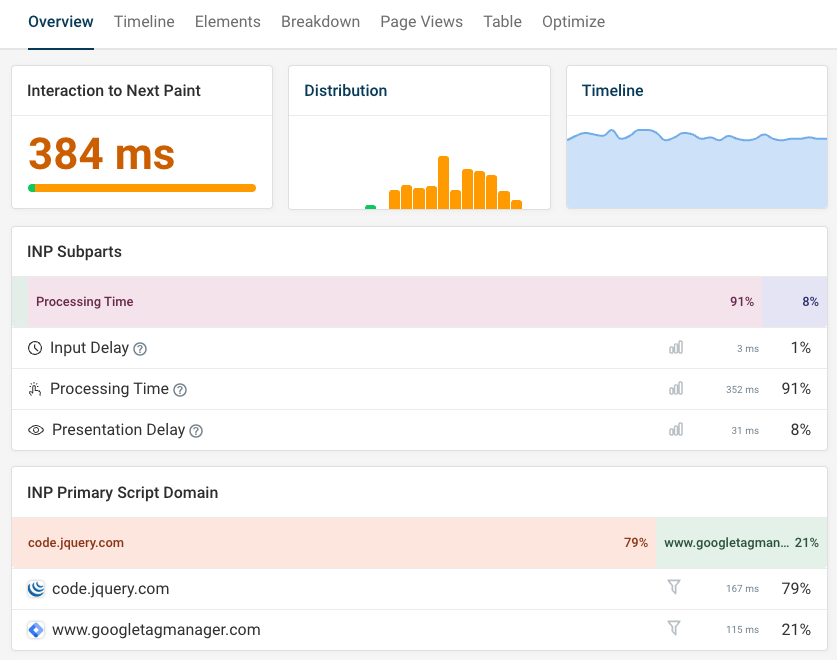
- Interaction to Next Paint (INP): Measures the latency for a user interaction, such as clicking a size selector or adding an item to the cart. A high INP makes the site feel sluggish and unresponsive, leading to frustration.
To learn more about optimizing online stores for search engines, check out our detailed guide to ecommerce SEO.
Identify Common Magento Performance Issues
After running an initial page speed test, you can begin to break down the common performance bottlenecks and how to fix them.
1. Slow Time To First Byte (TTFB)
Time To First Byte (TTFB) measures how long it takes for a browser to receive the first byte of data from your server. A high Full TTFB is a clear sign that your server is slow to process requests, which delays the entire page rendering process. This is often caused by backend issues in your Magento application.
Full Page Cache Not Working
A common issue is the full-page cache not working, meaning Magento has to build pages from scratch for every visitor. This is a problem because dynamically generating pages is resource-intensive, increasing server response time and leading to a poor user experience.
To check if your caches are enabled, go to the Magento admin under SYSTEM > Tools > Cache Management. A grid will show you all available cache types.
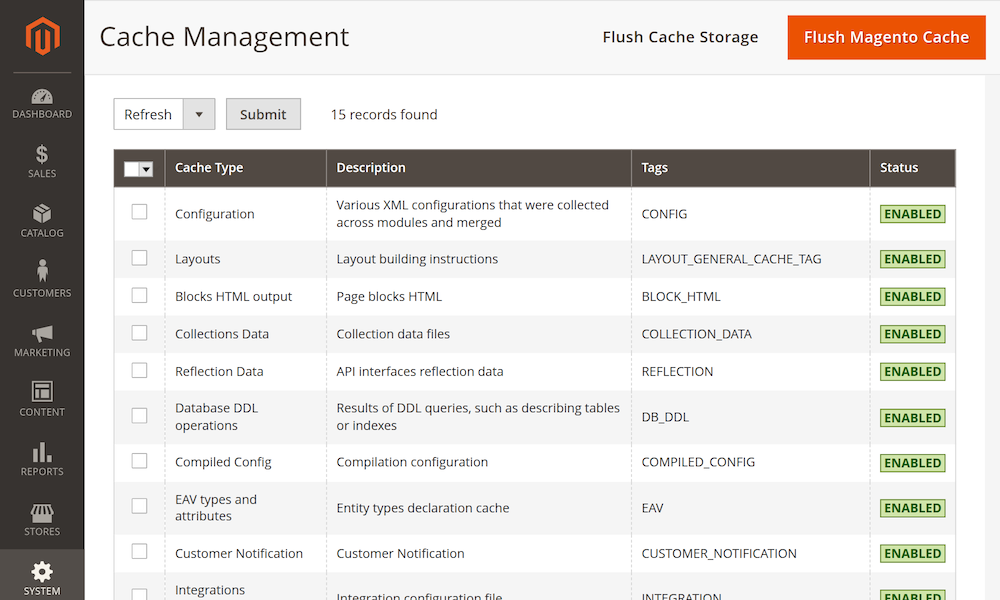
On a production site, all caches should be enabled for best performance. For a more technical check, inspect the response headers in DebugBear.
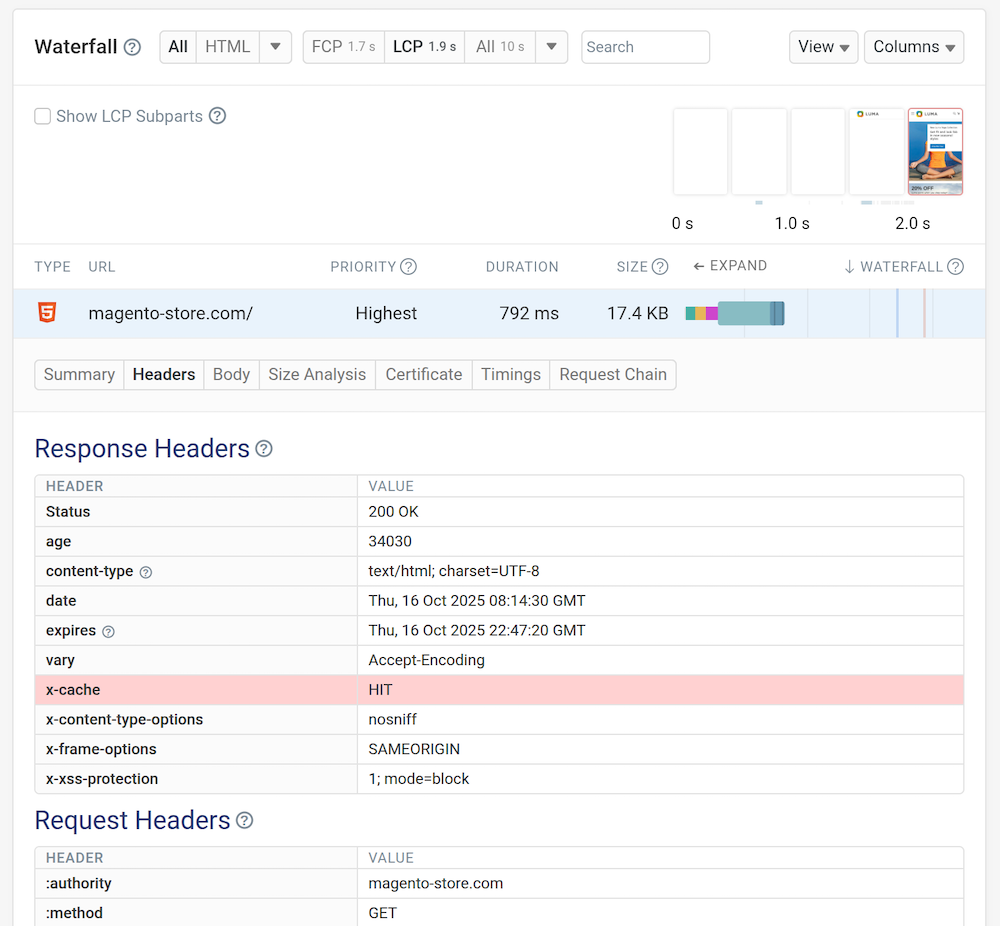
On a page test, select the Requests tab, click the first request, select “Headers” from the list and look for the x-cache header. A value of HIT means the cache is working, while MISS indicates it is not.
If the caches are all marked as "ENABLED" in green but you still suspect caching issues are slowing down your site, a custom module may be the culprit (often by setting cacheable="false" in a layout XML file), preventing certain pages from being cached. In this case, you should contact your development agency to resolve the conflict.
Varnish Cache Not Configured
Another potential problem is using Magento's default built-in cache instead of Varnish. Varnish is a dedicated reverse-proxy cache that stores fully-rendered pages in memory, serving them much faster than Magento's file-based cache and lowering TTFB.
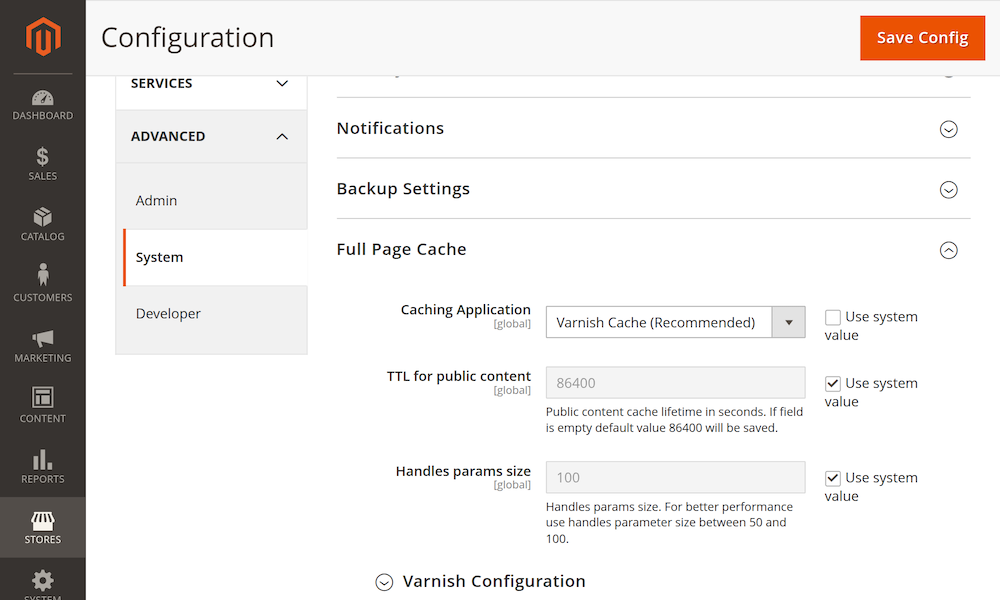
You can debug this by checking your caching application settings in the Magento admin under STORES > Configuration > ADVANCED > System > Full Page Cache.
The fix is to select Varnish as your caching application, but this first requires Varnish to be installed and configured on your server, a task for your agency or hosting provider. If you are on Adobe Commerce Cloud, then you don't need to do anything here as Varnish is already enabled for you.
Incorrect Application Mode
Your live Magento website might be running in an incorrect application mode. There are three possible modes: developer, default, and production. Only production mode is highly optimized for speed by pre-compiling code and enabling extensive caching; the other modes are intended for development and are very slow on a live site.
To debug this, access your server via the command line and run bin/magento deploy:mode:show. The command will display something like Current application mode: developer.
If it's not in production mode, fix it by running the command: bin/magento deploy:mode:set production. You might need to ask your Magento developer or agency to help you with that.
Bloated Database
A bloated database cluttered with unnecessary data like historical orders and disabled products can also slow down your site. The larger your database tables, the slower the database queries become, which directly increases TTFB.
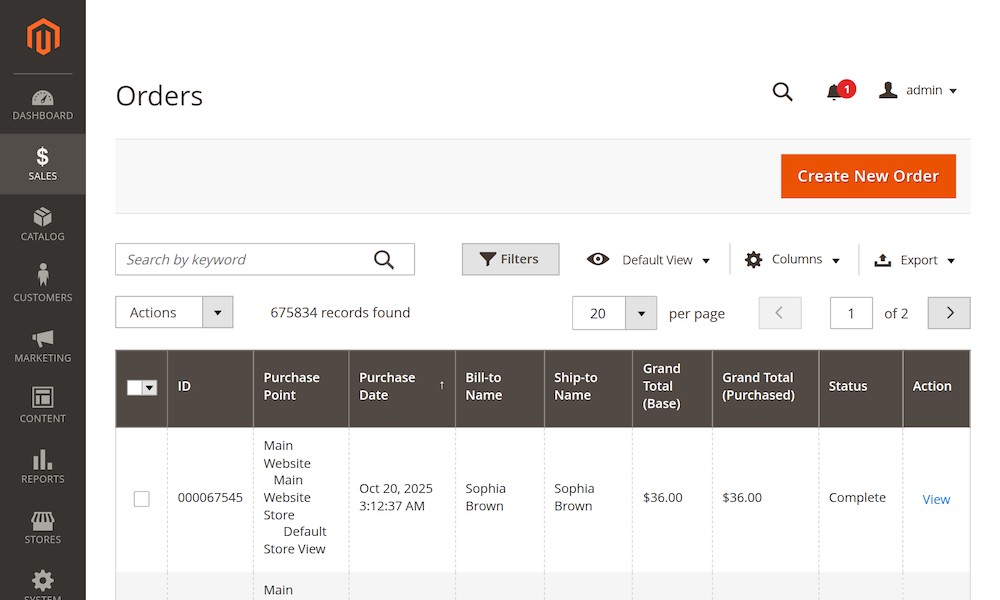
You can get an idea of your database size by checking the number of records in your Magento admin. Go to Sales > Orders and Catalog > Products to see how many total records you have.
The exact number that can cause issues depends on your server, but having many thousands of orders or products can start to cause performance problems.
The fix is to regularly clean your database. Consider removing products that are no longer for sale and have been disabled. For historical orders, you could move them to a separate system to take the load off Magento.
For stores on Adobe Commerce, you should use the built-in order archiving feature to keep your primary sales tables performant for processing current orders.
Suboptimal PHP Configuration
Finally, for TTFB, suboptimal PHP settings on your server can be a problem.
OPcache improves performance by storing pre-compiled code (a ready-to-execute version of the script) in memory, avoiding the need for PHP to load and parse scripts on every request. Without it, your server works much harder.
You can debug this by checking if OPcache is enabled. Run php -v on the server; if OPcache is enabled, it will be mentioned in the output:
PHP 8.4.13 (cli) (built: Sep 29 2025 23:51:38) (NTS)
Copyright (c) The PHP Group
Zend Engine v4.4.13, Copyright (c) Zend Technologies
    with Zend OPcache v8.4.13, Copyright (c), by Zend Technologies
You can inspect PHP configuration by running php -i | grep ^opcache; the output will be all possible OPcache configuration properties. You should ensure they match Adobe's recommendations.
If OPcache is disabled or the configuration does not match the recommendations, you can fix that by editing your php.ini file, which is often located at /etc/php/php.ini. Specifically, ensure the PHP OPcache module is activated by adding a line: zend_extension=opcache and that opcache.memory_consumption is set to at least 2 GB, as recommended by Adobe. Have a developer review your full PHP configuration against Adobe's best practices. An optimal configuration should look something like this:
zend_extension=opcache
opcache.memory_consumption=512
opcache.max_accelerated_files=60000
opcache.consistency_checks=0
opcache.validate_timestamps=0
opcache.enable_cli=1
2. Identify Render-Blocking Assets
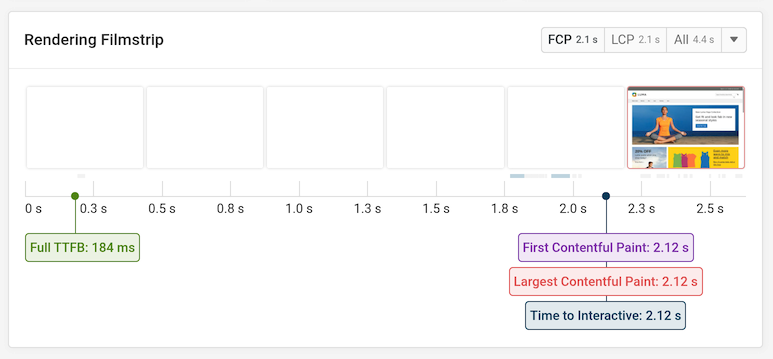
Render-blocking assets are another common problem, where JavaScript and CSS files load before the main content and block the page from rendering. This leads to a blank screen for the user and a poor First Contentful Paint (FCP) metric, often indicated by a large gap between TTFB and FCP.
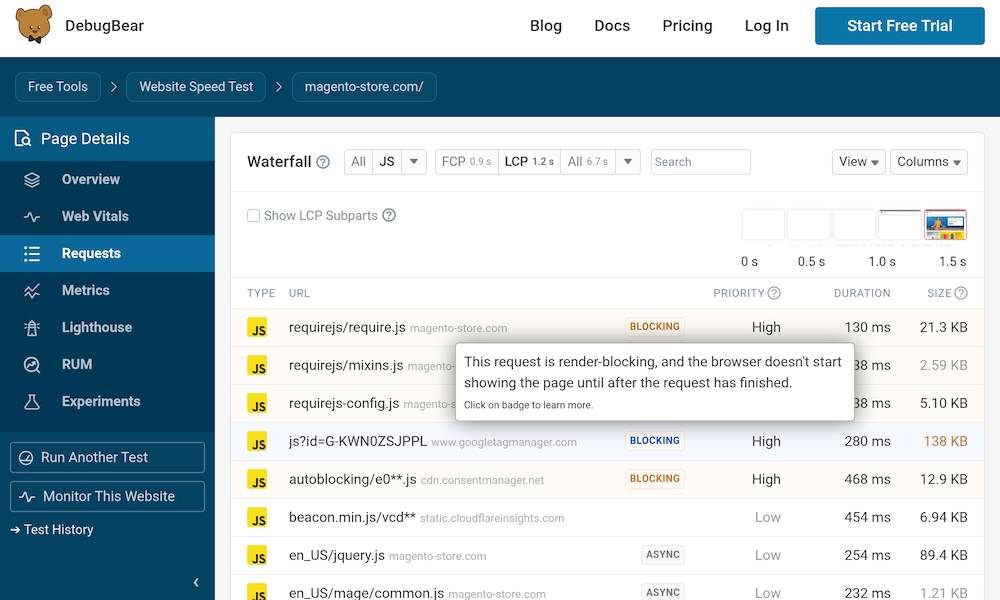
While some blocking JavaScript is required for Magento to function properly, scripts that can be optimized often include third-party marketing trackers, live chat widgets, and A/B testing tools.
You can debug this in DebugBear’s Request Waterfall by looking for scripts or CSS files with a "blocking" tag. To fix this, add defer or async attributes to non-critical JavaScript tags. You can also install a free PartyTown module which can run them in a background web worker, preventing them from blocking the main page render.
3. Diagnose and Fix Layout Shifts (CLS)
Layout shifts occur when elements like images or banners load without reserved space, causing content to jump around as they appear.
Cumulative Layout Shift (CLS) is a Core Web Vital because layout shift creates a jarring user experience and can cause users to click on the wrong thing, making the site feel unstable. Imagine a customer trying to click "Add to Cart," only to have a banner load and push the button down, causing them to click something else instead.
You can debug this using the Layout Shift visualizer in DebugBear or Lighthouse to see which elements are causing the score to increase. The fix usually involves reserving space for these elements. For images, always specify width and height attributes which allows the browser to pre-allocate space for the image.
For content injected by JavaScript, like reviews, wrap them in a container <div> and give it a min-height via CSS to reserve space before it renders. For more details, read our guide on how to Measure and Optimize Cumulative Layout Shift (CLS).
<div style="min-width: 1280px;min-height: 300px;">
  <div id="service-reviews-widget"></div>
  <script
    type="text/javascript"
    src="https://api.reviews.com/api/javascript/7a4d3f9e-c2b1-4f8a-9d6e-0f1c3b5a7e9d"
    data-merchant-id="7a4d3f9e-c2b1-4f8a-9d6e-0f1c3b5a7e9d"
    data-review-widget-id="service-reviews-widget"
    async
  ></script>
</div>
4. Optimize Images and Assets
Serving large, unoptimized images is a significant problem that consumes bandwidth and slows down page loads. Because images are often the heaviest part of a page, they can directly harm your LCP score and the overall user experience, especially for users on mobile data.
While Magento automatically optimizes product images, CMS images, like banners on your homepage or promotional graphics, are not optimized by default.
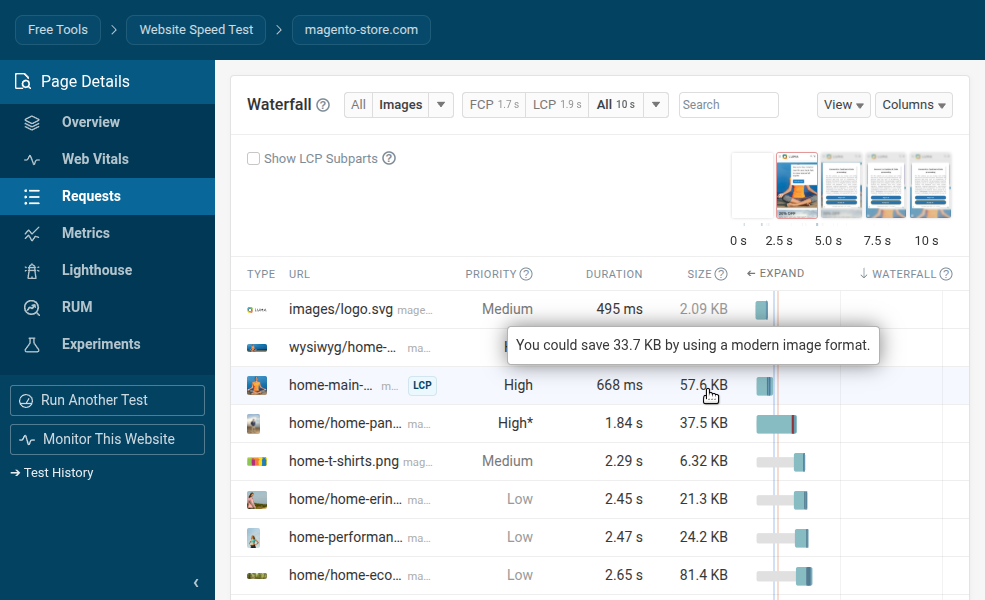
To debug this, use the DebugBear waterfall chart and filter by "Images" to see file formats and sizes; hovering over an image will show potential savings from conversion to modern formats like WebP. To fix this, convert images to WebP or AVIF and compress them before uploading.
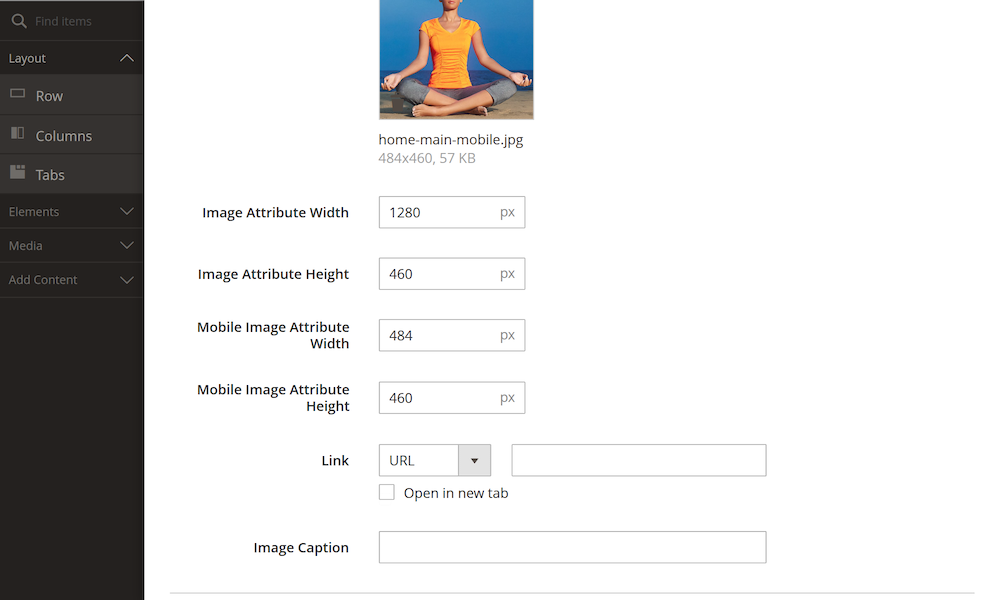
Use Magento Page Builder's features to serve smaller, appropriately sized images on mobile devices. To help automate this process, you can use one of the many free and paid Magento extensions that automatically convert images to modern formats and apply compression. For more advanced techniques, see our article on Optimizing Images for Web Performance.
5. Implement Lazy Loading Correctly
Lazy loading is a technique that defers loading of "below-the-fold" content until the user scrolls down enough to make it visible.
However, a common mistake is to lazy-load images that are "above-the-fold," meaning immediately visible to the user. This can be especially bad if you are lazy-loading your Largest Contentful Paint (LCP) image. Applying lazy loading to it tells the browser to delay loading the most important visual content on the page, which directly harms your LCP score and makes the page feel slower.
DebugBear can automatically identify your LCP image for you. Click on the page you performed a test against, scroll down, and you should see the following section:
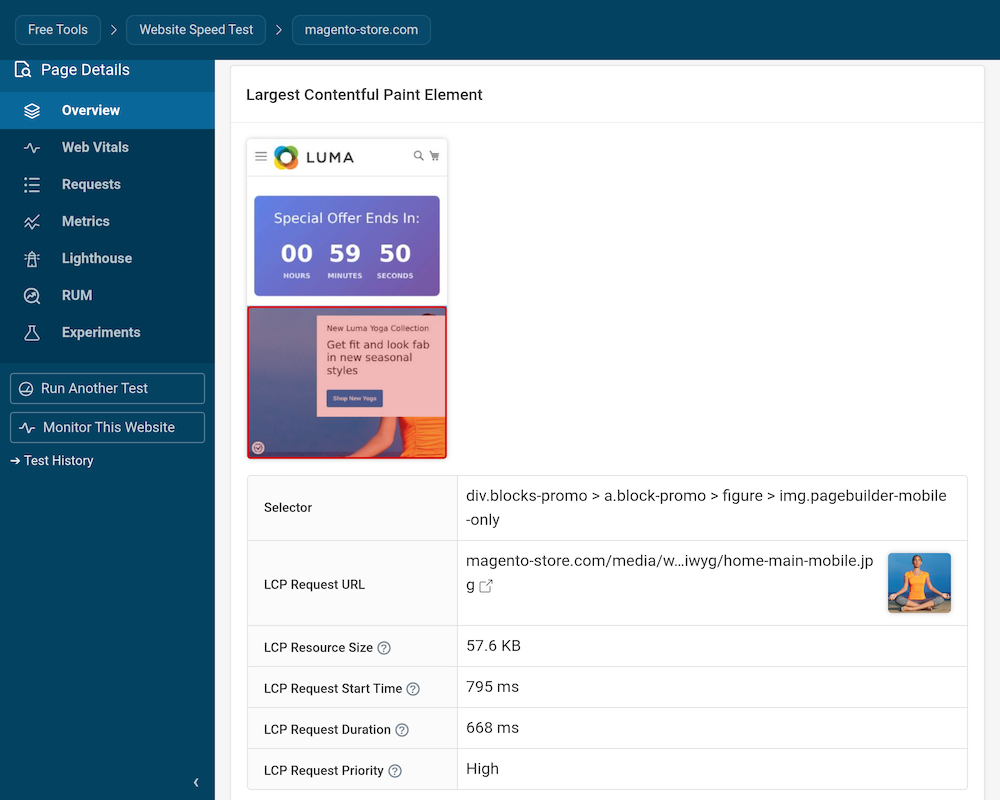
Have a look at your LCP Request Priority. If it says Low or Medium, it can be improved easily by ensuring your LCP image loads before other content. This can be done by adding the fetchpriority="high" attribute to the image and ensuring it's not lazy-loaded with the loading="lazy" attribute. You might want to ask your front-end developer to help you with that.
6. Utilize a Content Delivery Network (CDN)
Serving all your website's assets from a single server location is a problem because the distance (latency) increases download times for visitors who are far from your server. A single server can also become overwhelmed during traffic spikes, such as during a Black Friday sale.
DebugBear's free global TTFB test can show you how your website performance varies across the world:
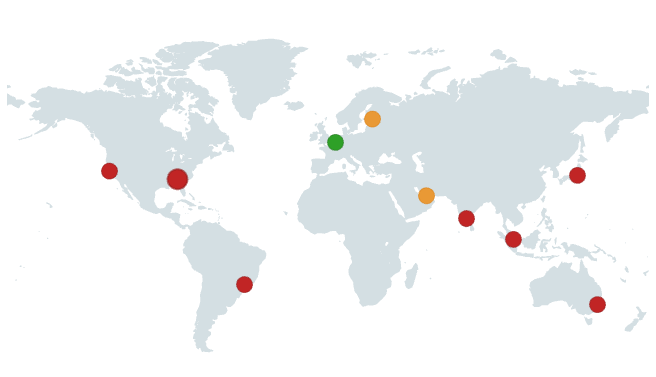
A Content Delivery Network (CDN) provides globally distributed infrastructure to serve your website content. This can have a big positive impact on your page speed.
To check if you're already using a CDN, you can use a free tool like Check for Cloudflare.
It might help to use a CDN like Fastly or Cloudflare to distribute your assets to servers closer to your customers. It helps deliver assets to your customers more quickly, reduces stress on your main server, and adds security benefits.
If you use Adobe Commerce Cloud, the Fastly CDN is already included.
Next Steps: Set Up Continuous Monitoring
Once you've made these initial optimizations, the next step is to set up continuous performance monitoring to track your progress and catch new issues before they impact your users.
While tools like Lighthouse and PageSpeed Insights are great for one-off recommendations, they don't provide the continuous monitoring that e-commerce platforms like Magento need. If you'd like to learn more, check out our article on PageSpeed Insights vs. Lighthouse: What's the Difference?.
DebugBear runs periodic scans of your website and can alert you when your score suddenly drops, ensuring your site doesn’t slow down during high traffic or over time. It also offers features like web performance experiments and Real User Monitoring (RUM).
Sign Up for DebugBear
First, sign up for the free trial on the DebugBear website.
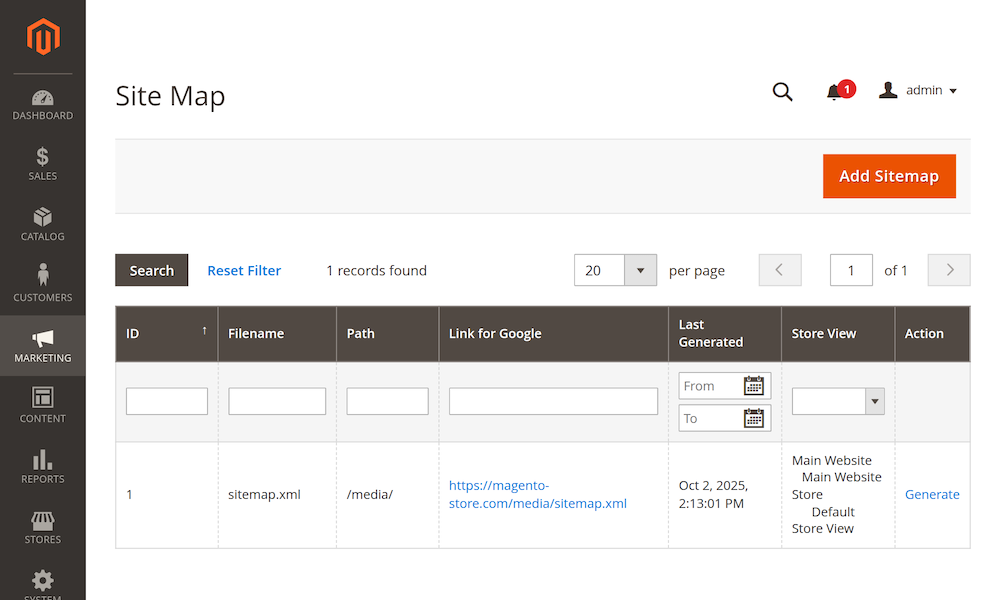
Before adding your website, ensure you have sitemaps enabled in Magento. This is not only an SEO best practice but also a requirement for DebugBear to discover all your pages. To do this, log in to your admin area, then go to MARKETING > SEO & Search > Site Map and ensure a sitemap is generated for each of your Store Views.
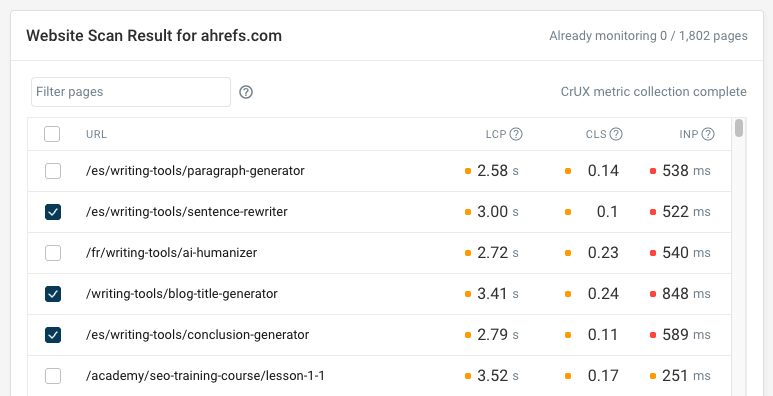
Next, follow the Test Scheduling tutorial to set up periodic lab tests. You can either provide a specific set of URLs to monitor or scan your website sitemap to automatically discover page URLs with the website scan feature.
If your website gets enough traffic, Google will also report data in the Chrome User Experience Report (CrUX), and the DebugBear website scan can identify slow pages for you.
Set Up Real User Monitoring (RUM)
To get invaluable insight into how real users are experiencing your site's performance, set up Real User Monitoring (RUM). This data complements lab tests by showing you what your actual customers see.
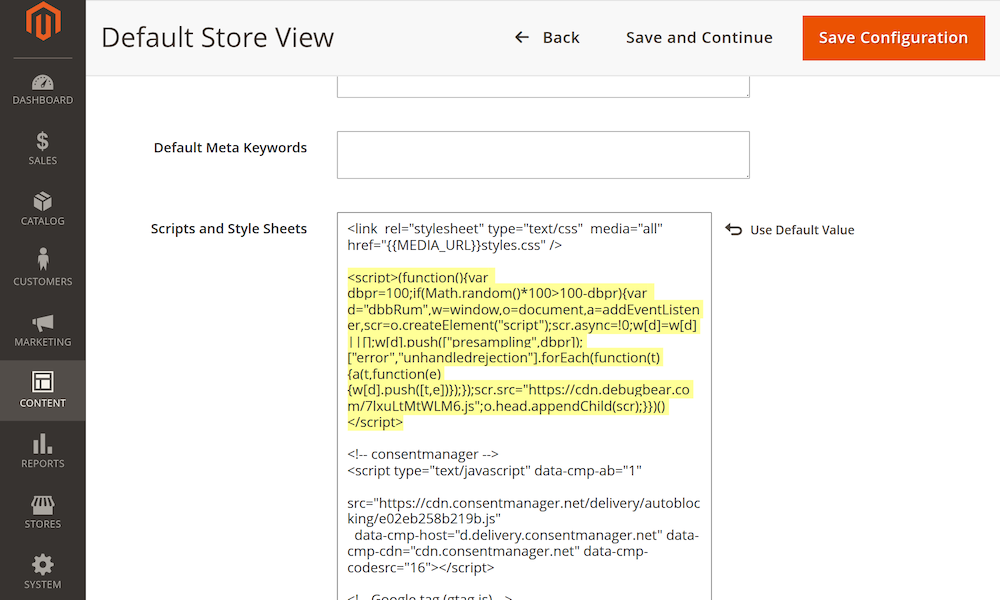
To add the RUM script, navigate to the RUM tab in your DebugBear dashboard and click "Get Started." Copy the generated script.
Then, in your Magento admin, go to CONTENT > Design > Configuration. Choose the correct theme, expand the Other Settings > HTML Head section, and paste the script into the Scripts and Style Sheets field.
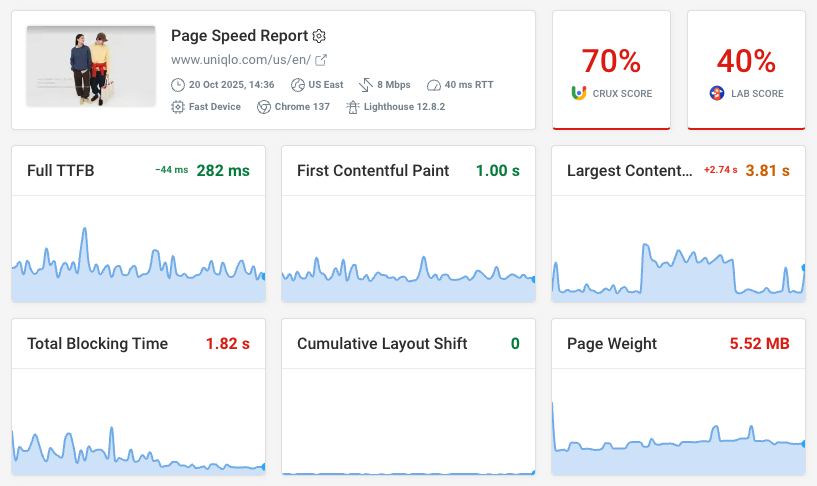
You can then track Core Web Vitals and other metrics across your website. Identify what metrics you're struggling with and what specific pages are slow.
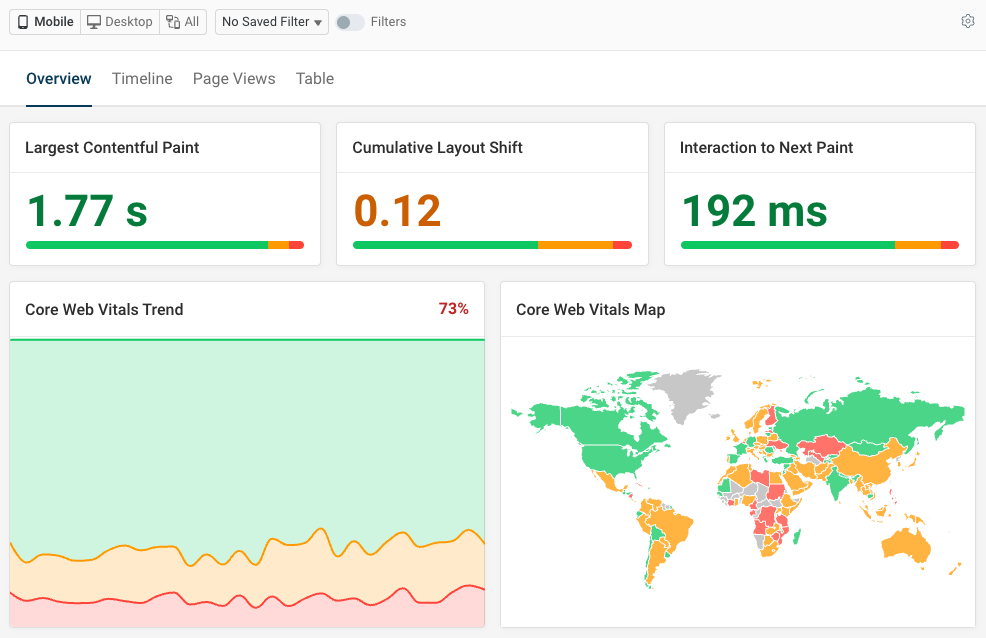
You can also explore the performance of specific pages in detail to identify what visitor segments are impacted and what requests or scripts are slowing down your site.
DebugBear combines real user data along with detailed scheduled test reports from synthetic monitoring.
Comprehensive web performance monitoring data makes it easy to find high-impact optimizations and get alerted when new problems come up.


Monitor Page Speed & Core Web Vitals
DebugBear monitoring includes:
- In-depth Page Speed Reports
- Automated Recommendations
- Real User Analytics Data