Alternative to Calibre Analytics

Monitor Core Web Vitals in the lab and for real users.

Improve Lighthouse scores, user experience, and SEO.
➔ Start Free Trial
No card required. Get set up in minutes.
Calibre Analytics alternative page speed dashboard
”We've updated around 15,000 pages and saw some nice gains from it. "Good URLs" and their impressions have increased 3x since implementation.“
Web performance monitoring user profile picture
Rafayel Begoyan
Senior SEO Specialist at CoinStats
CoinStats logo
”We love DebugBear. It has proven useful time and time again. I evaluated the different competitors and DebugBear was the best overall product.“
Web peformance monitoring user profile picture
Rafael Corral
Senior Software Engineer
Medium logo
Trusted By Hundreds Of Happy Customers
DebugBear Customers DebugBear Customers

Synthetic Website Monitoring

Track page speed continuously

Run page speed tests on a schedule and get alerted to regressions.

Go beyond Lighthouse scores

DebugBear is built on top of Google's Lighthouse tool, but it provides lots of custom insight and performance recommendations.

Stay ahead of the competition

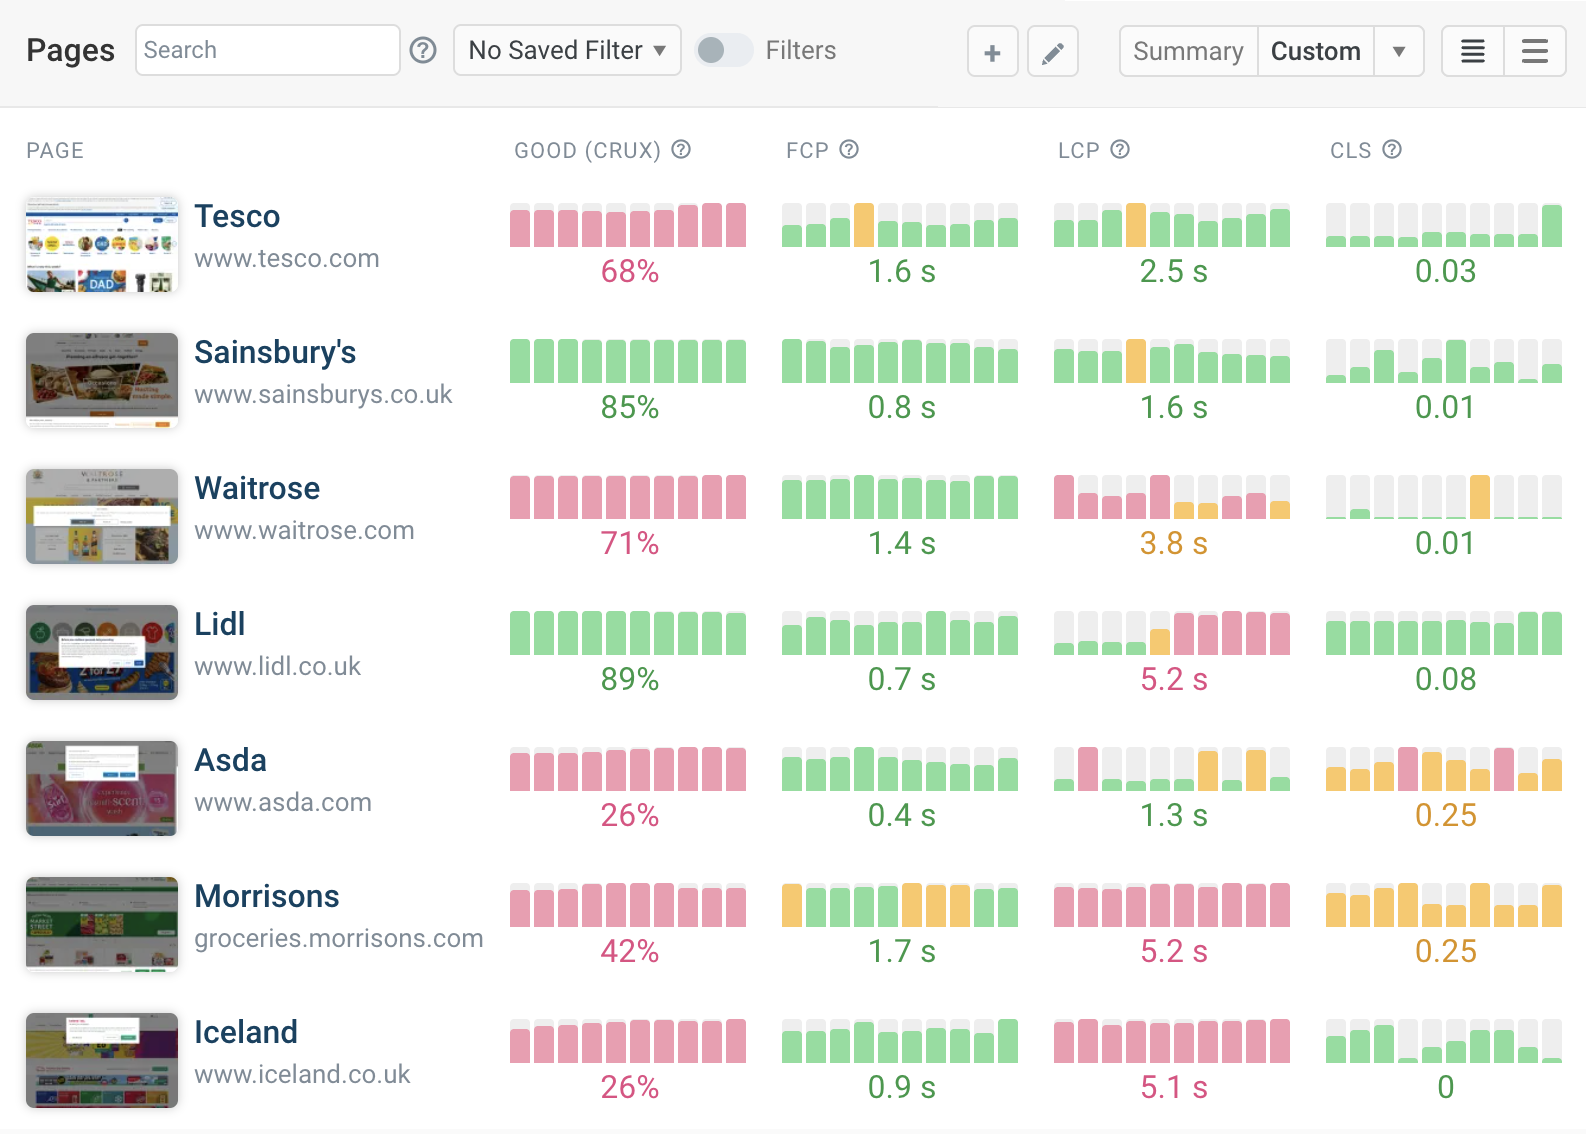
Monitor your own website and those of your competitors.

DebugBear RUM dashboard

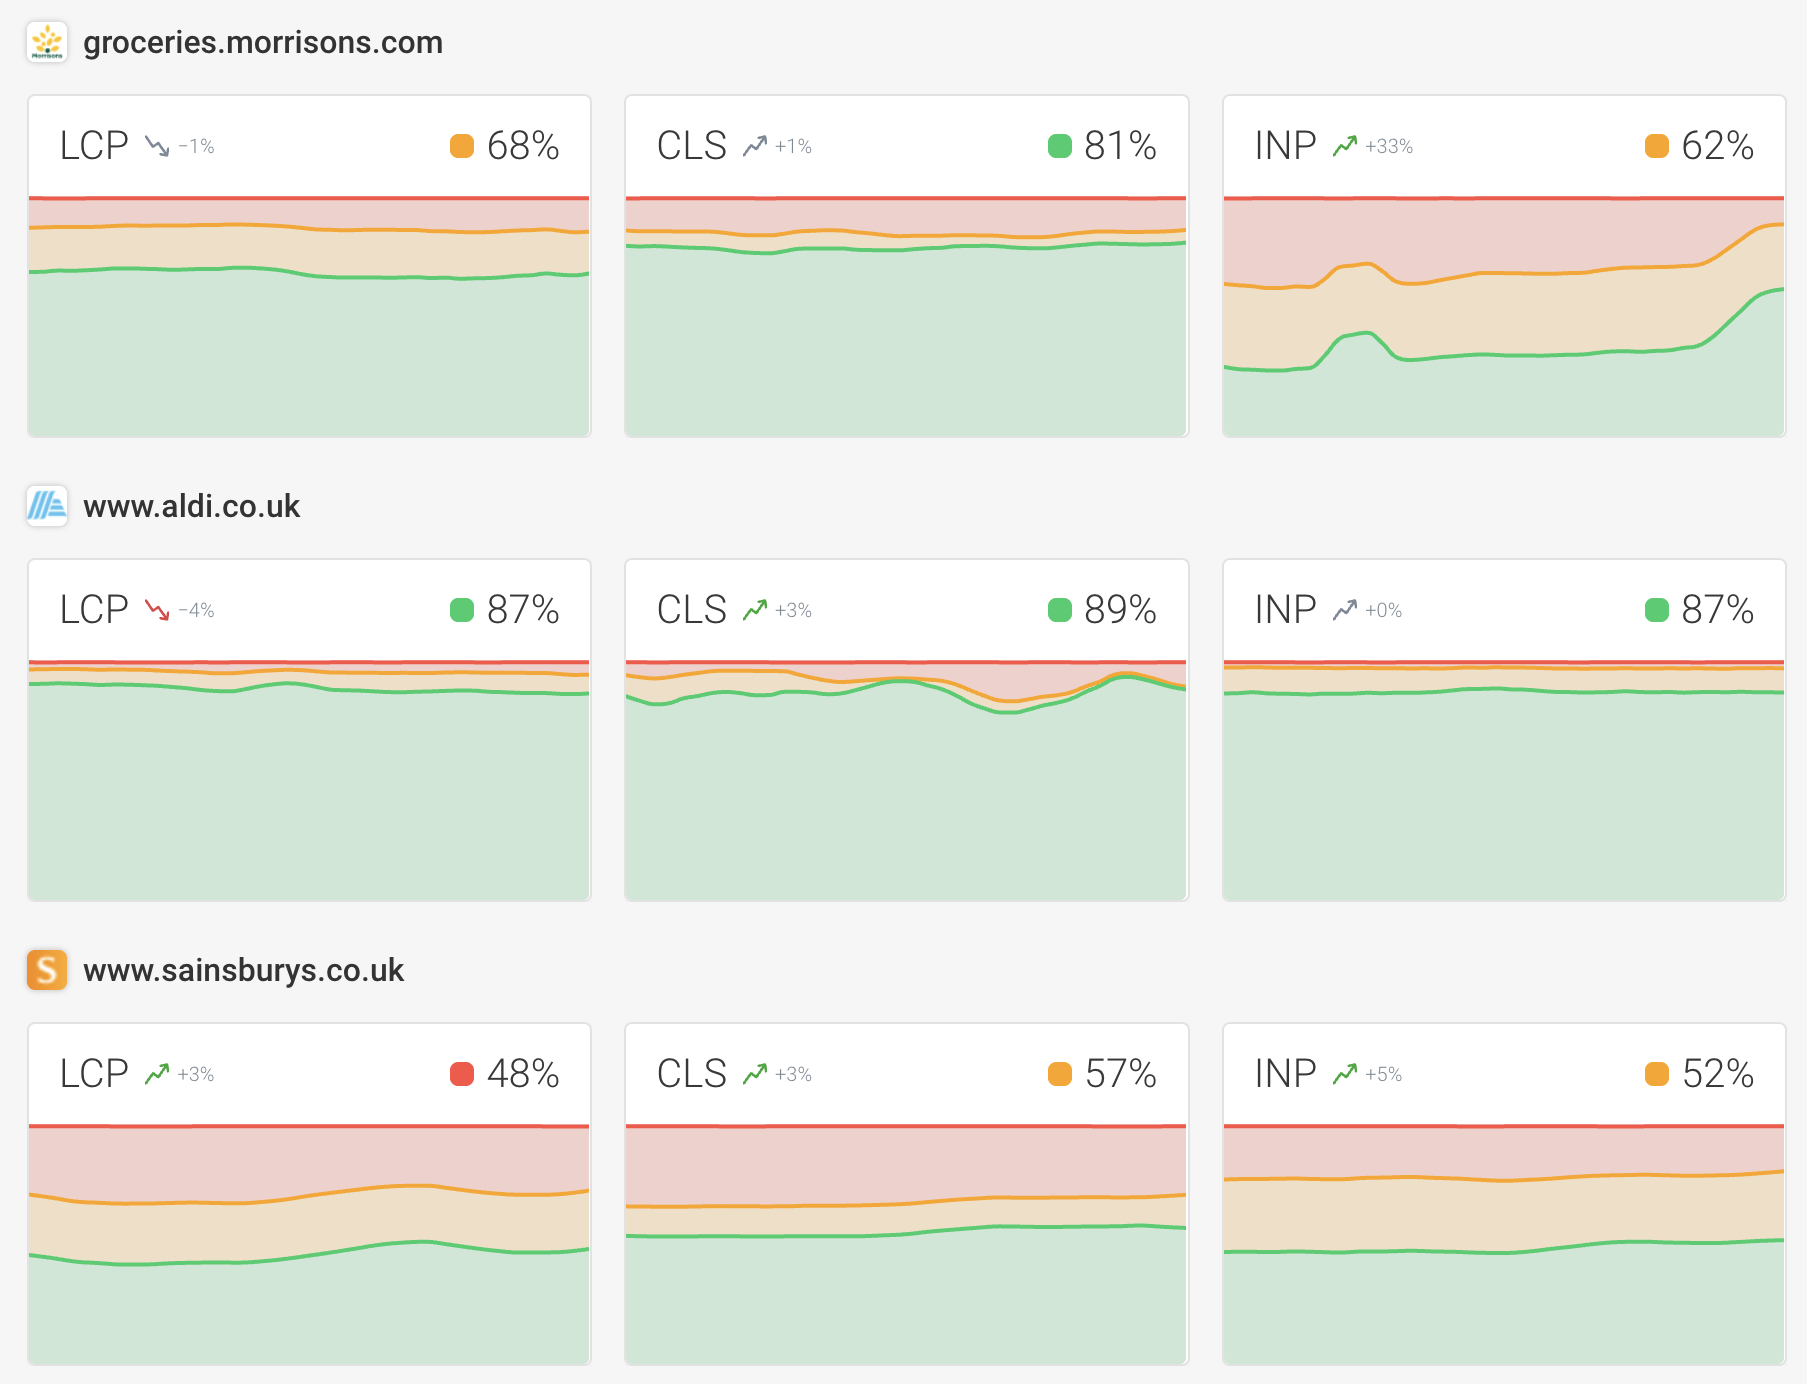
Google CrUX data

Monitor the data that impacts SEO

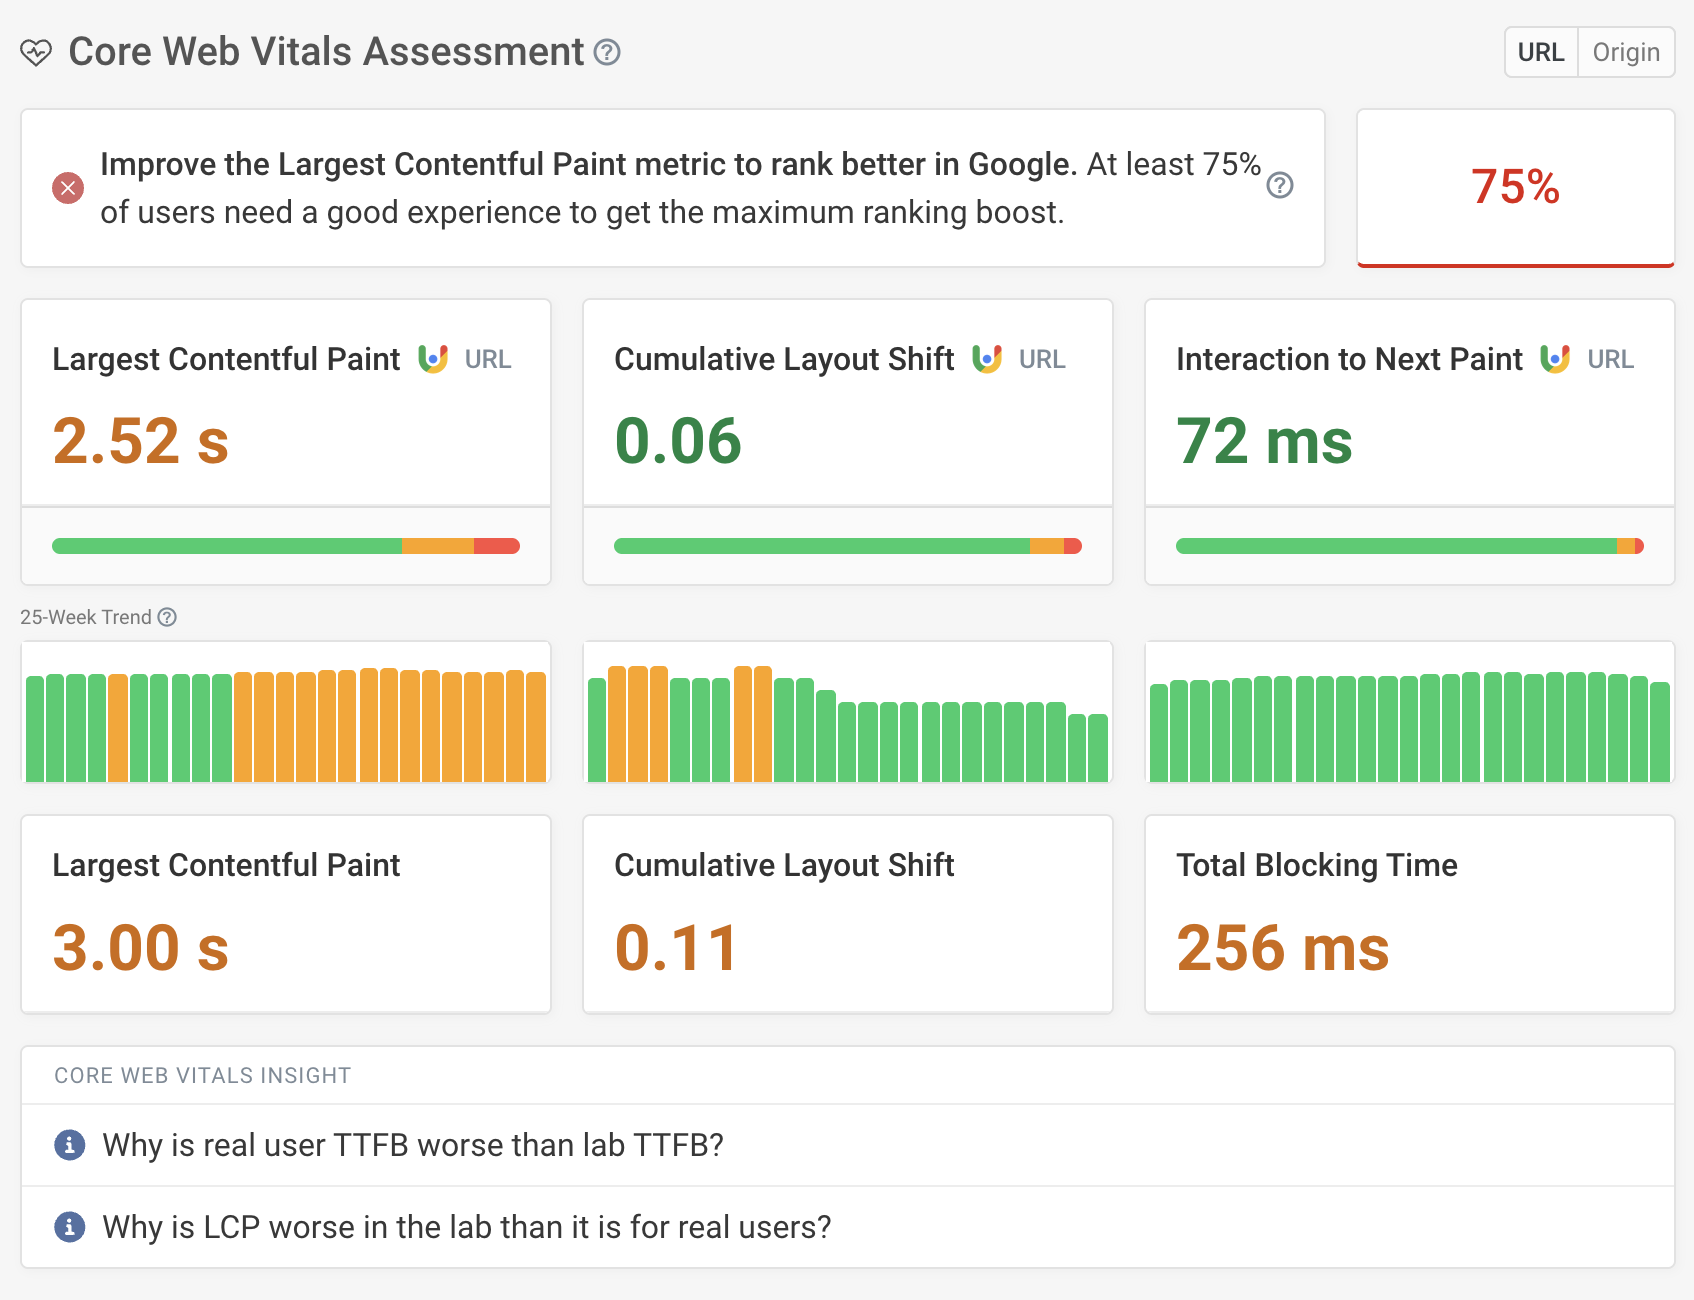
Each DebugBear test result includes data from Google's Chrome User Experience Report (CrUX). This data is used as a ranking factor.

See how real users experience your website

Unlike synthetic data, CrUX data comes from real users. See how many users have a good experience, and how common it is for your website to load slowly.

Google CruX trendline data

Real User Monitoring (RUM)

Collect detailed real user reports

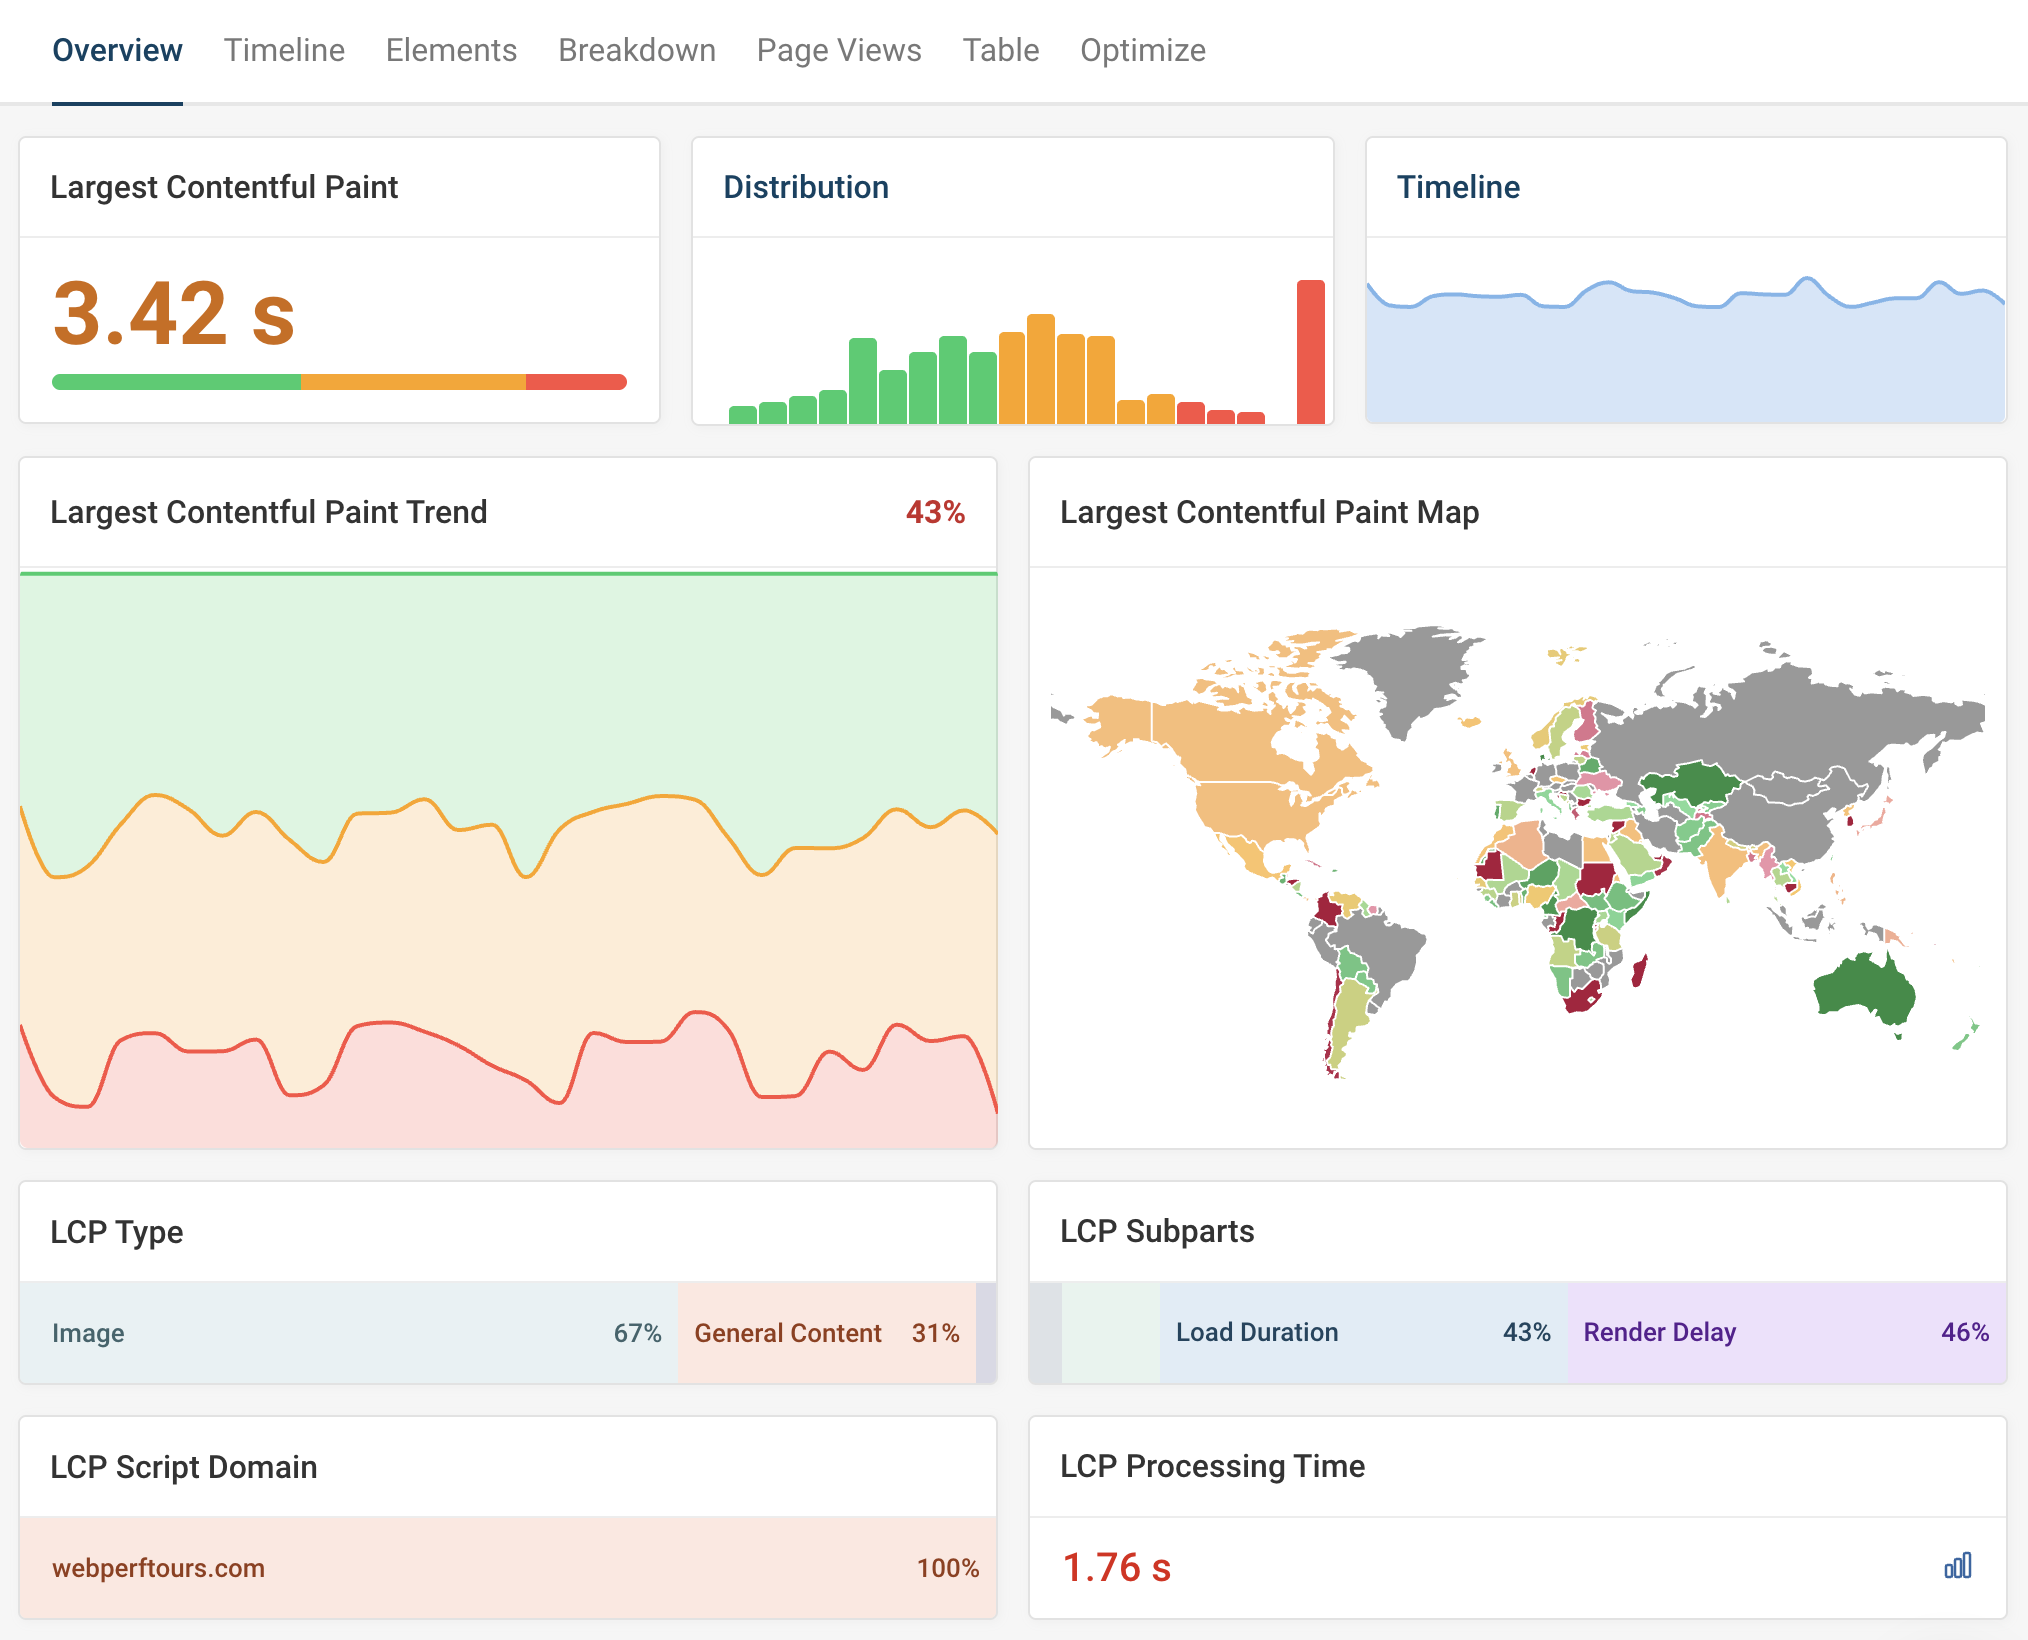
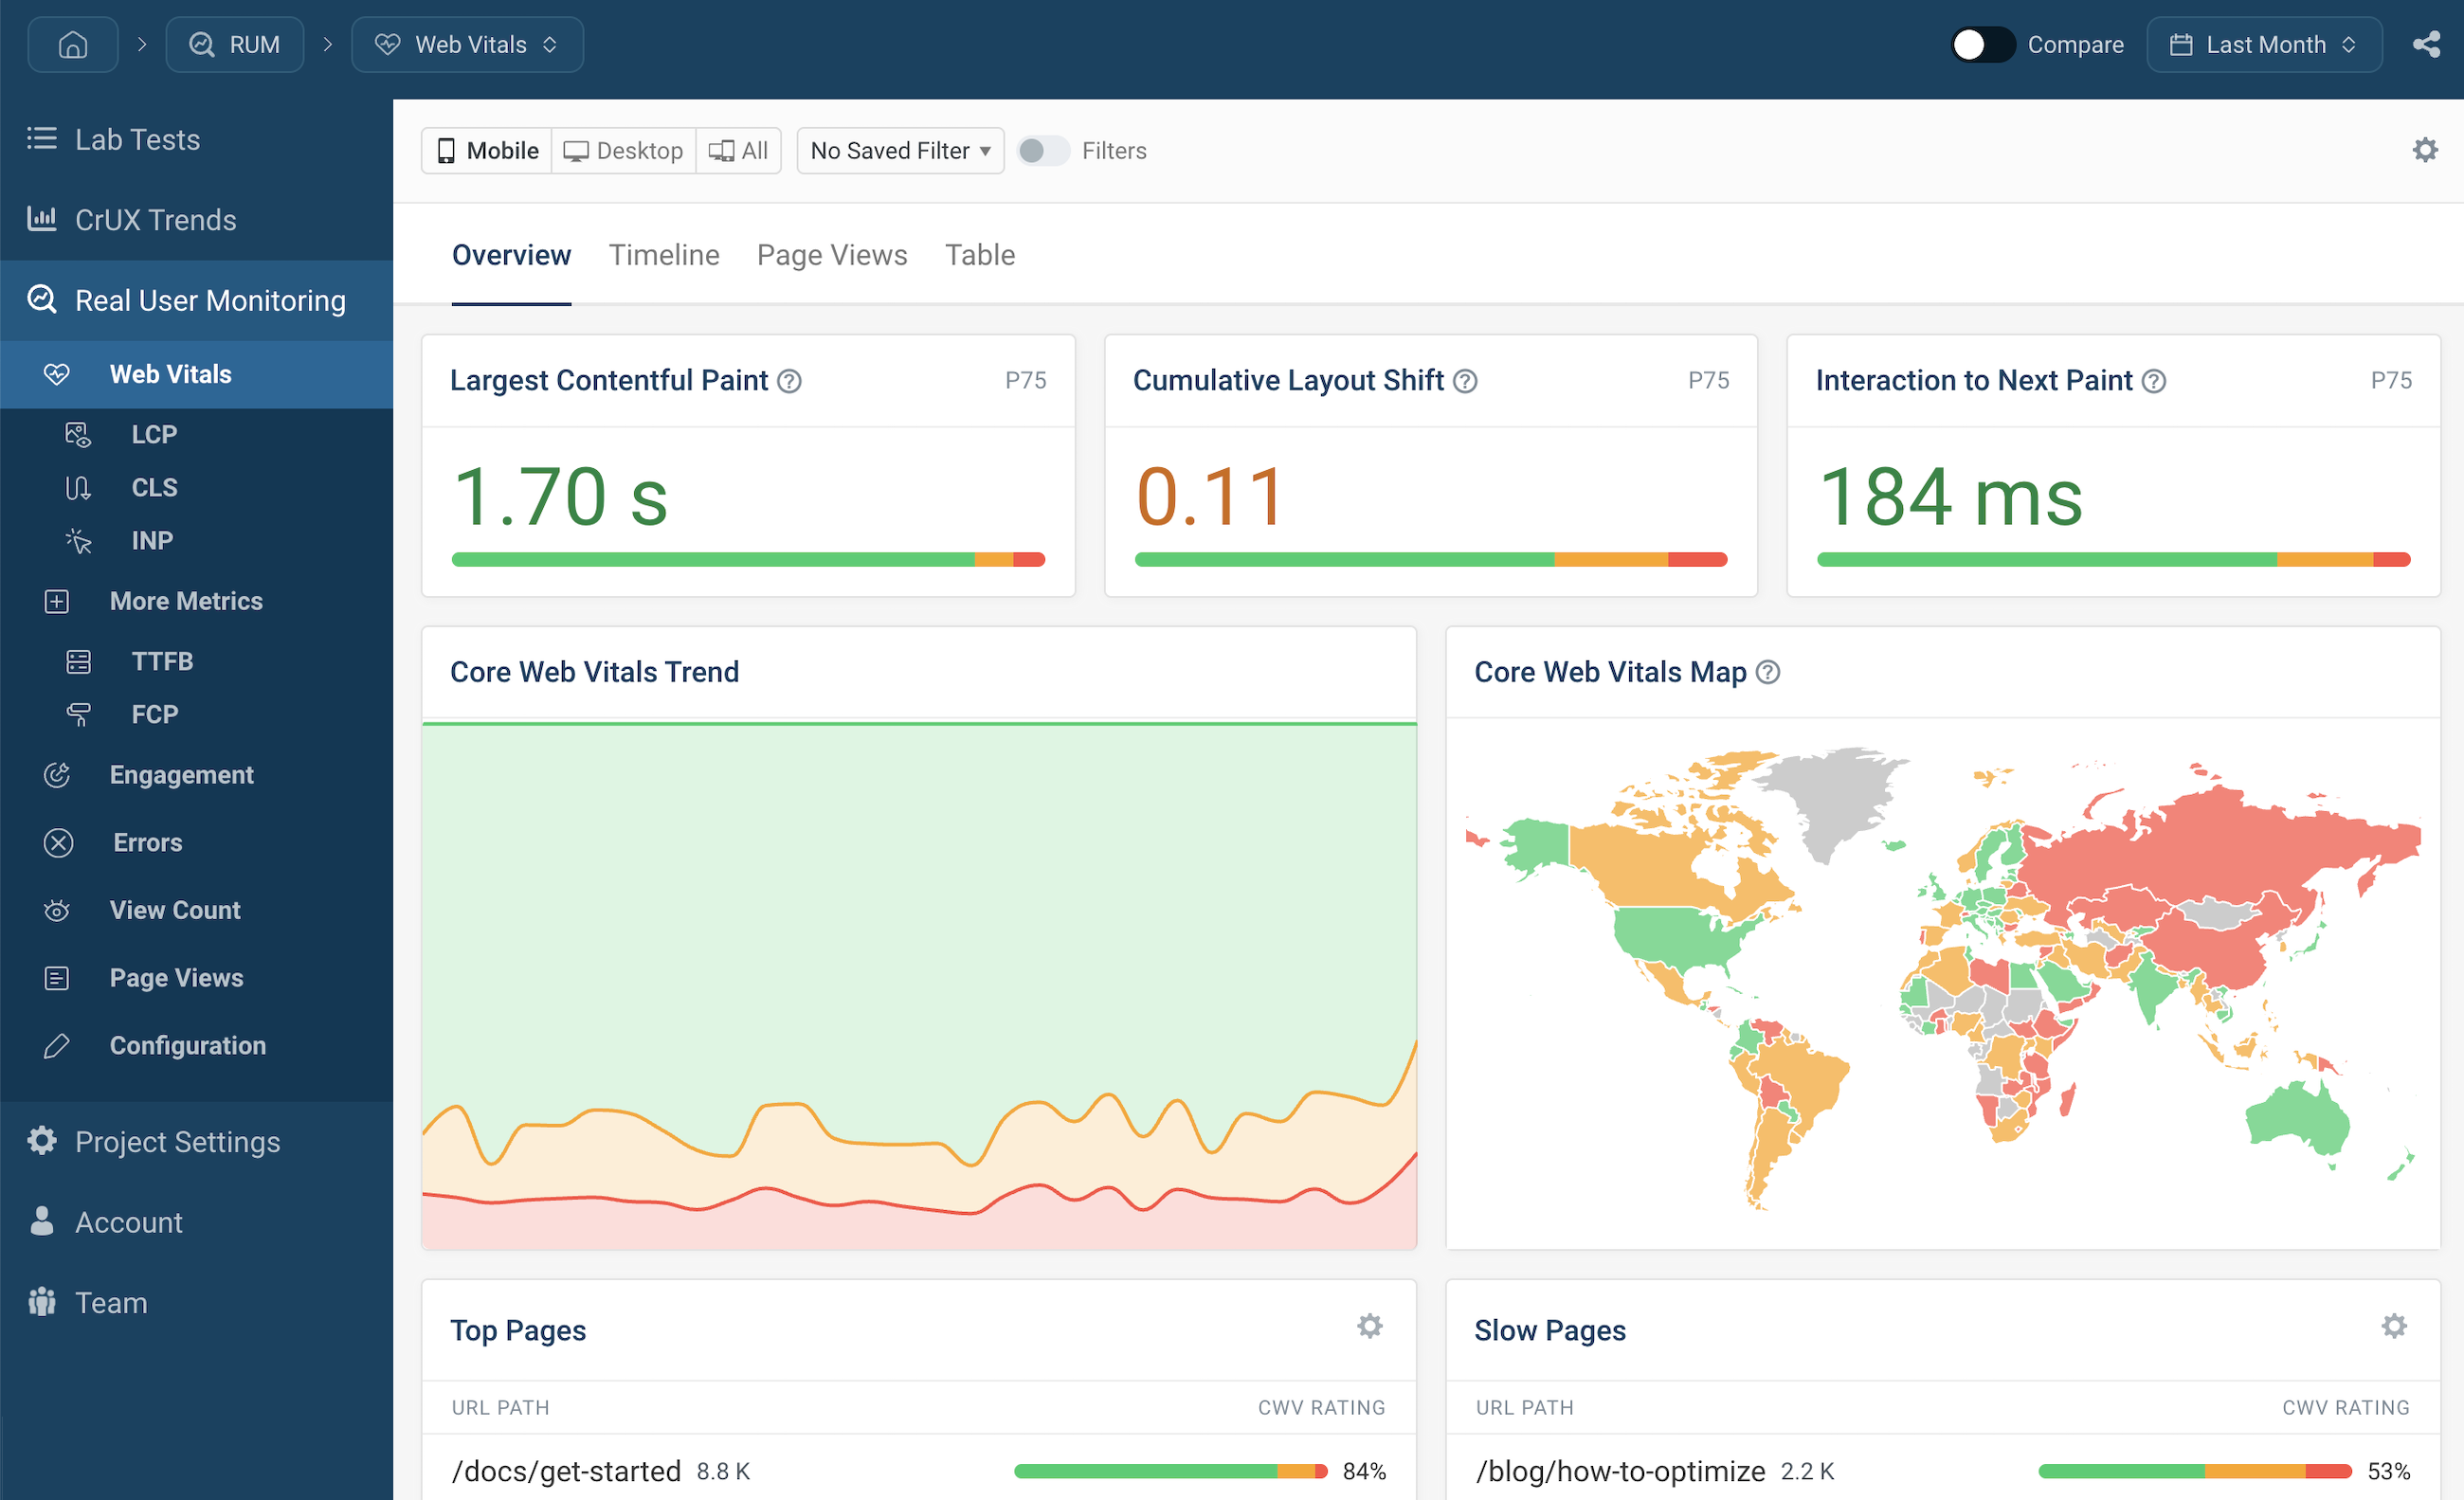
Unlike CalibreApp, DebugBear also offers its own real user monitoring solution. This data doesn't have the usual 28-day delay that comes with CrUX data, and the performance metrics are accompanied by detailed analysis data.

In-depth INP reporting

See what elements and scripts are contributing to Google's Interaction to Next Paint metric.

Real user web vitals dashboard in DebugBear

In-depth technical analysis

Advanced synthetic test results

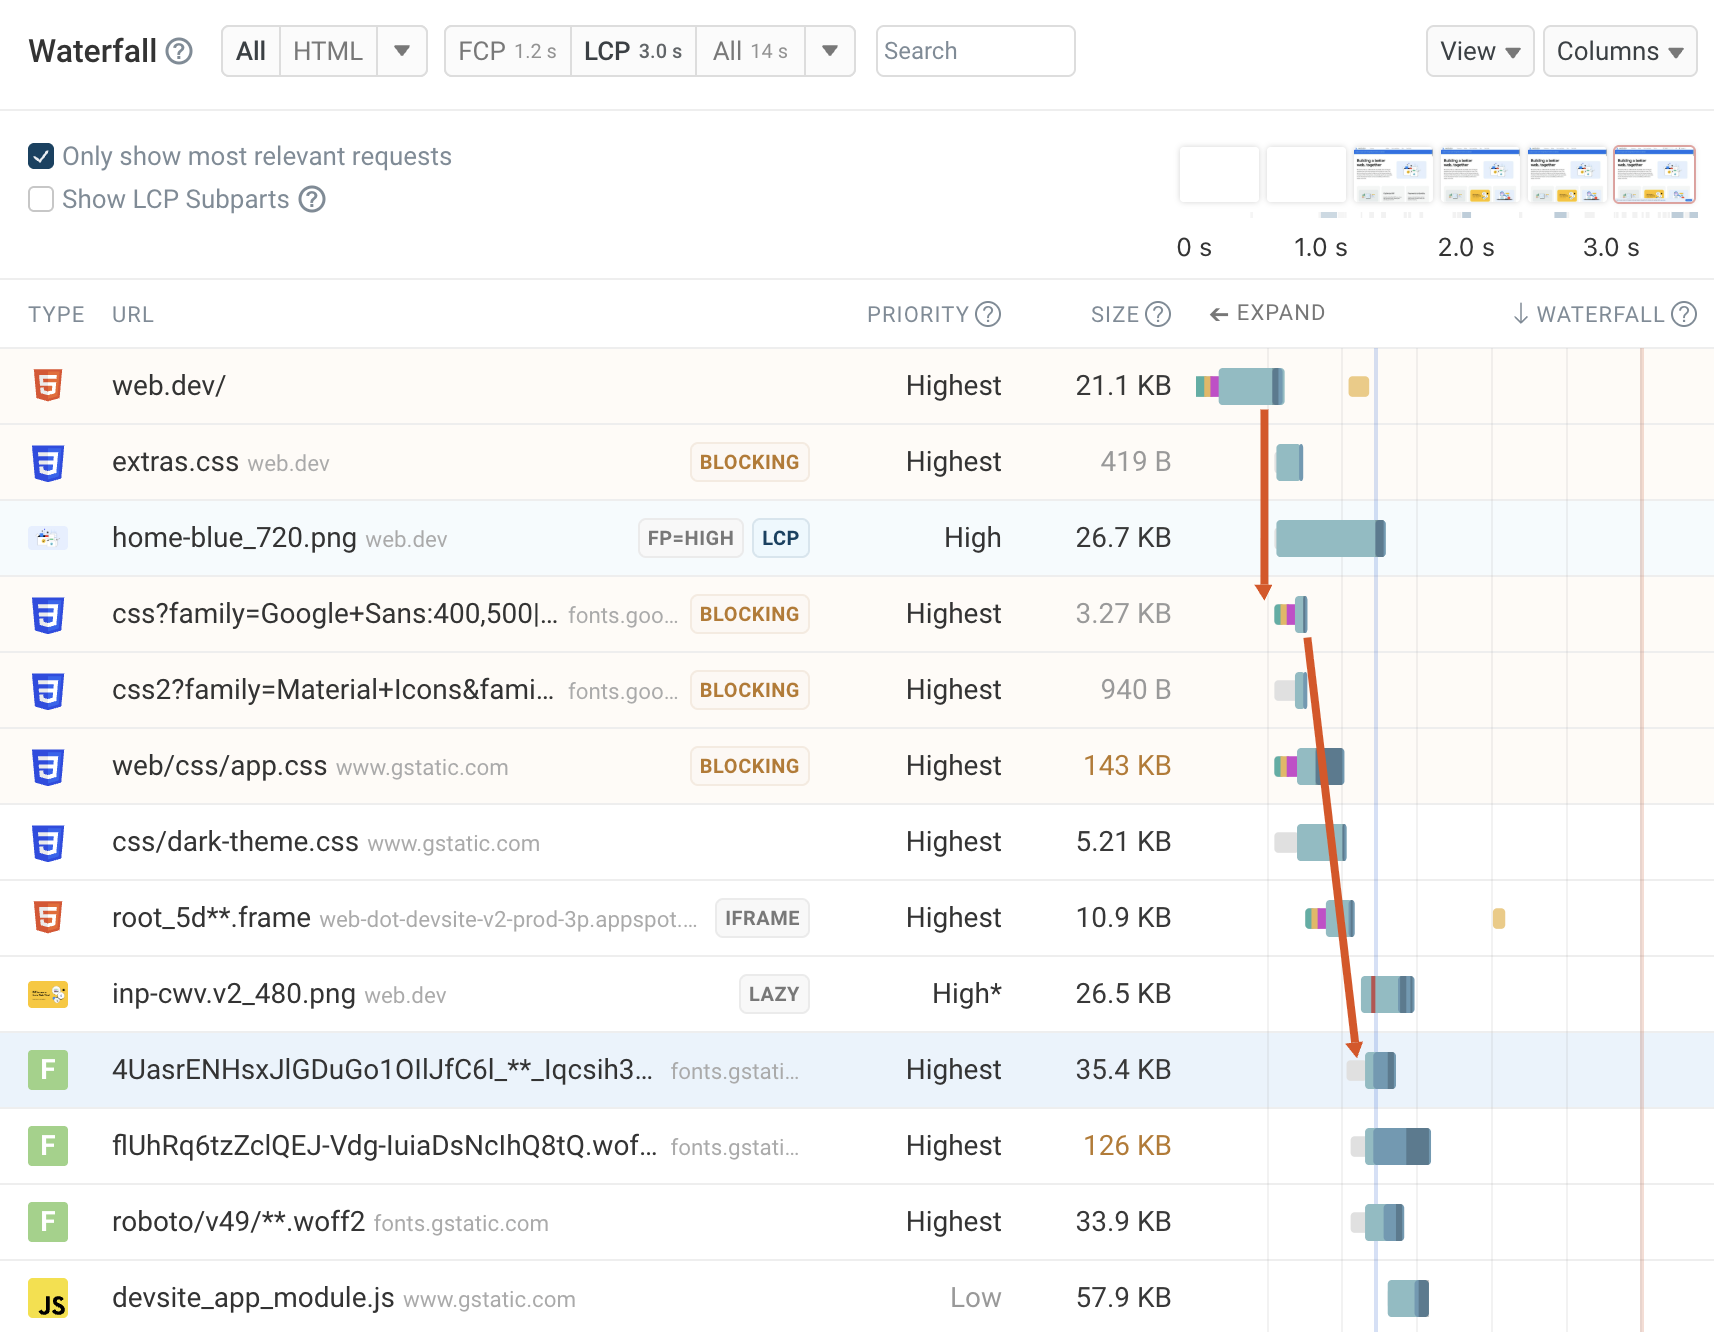
See a full network request waterfall for each test to learn why content appears and when.

Page speed data you can trust

DebugBear uses packet-level throttling and real CPU throttling to provide accurate data to base your decisions on.

Investigate regressions

Not sure why your website got slower? Compare tests results to the day before and see exactly what changed.

Lab test waterfall chart

Get set up in minutes.

No credit card required.
Start Free 14-Day Trial

You are using an old browser that is not supported anymore. You can continue using the site, but some things might not work as expected.