Web performance browser APIs help developers understand what causes slow experiences for real users on their website. The proposed Long Animation Frames (LoAF) API surfaces debug data about long CPU tasks and unresponsive page interactions.
LoAF would be especially useful to debug Google new Core Web Vitals metric, Interaction to Next Paint.
What is a long animation frame?
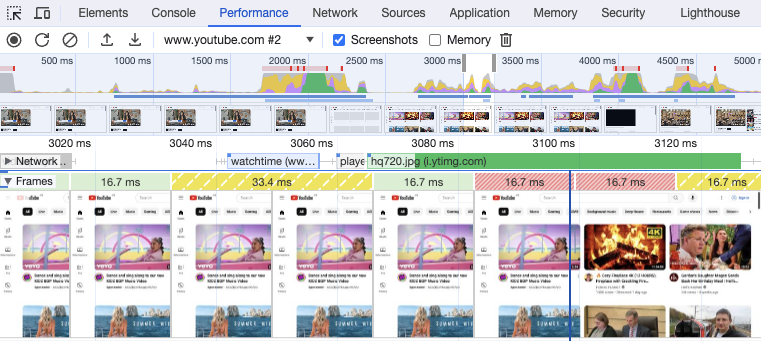
For a website to feel fast the browser needs to be able to update content quickly. Each update that's shown to the user is a frame. However, CPU tasks on the browser main thread can delay rendering resulting in long animation frames.
You can see rendering frames in the Chrome DevTools Performance tab. The red entries in the recording show dropped frames and the yellow entries show partially presented frames.
What is the Long Animation Frames API?
The Long Animation Frames API lets developers measure long frames on their websites, for example to monitor and understand page speed for real users.
The API provides insight on delayed the frame and what scripts on the page are responsible for the delay.
LoAF API implementation status
The Long Animation Frames API is now available in Chrome stable from Chrome version 123 onwards.
Example use of the Long Animation Frames API
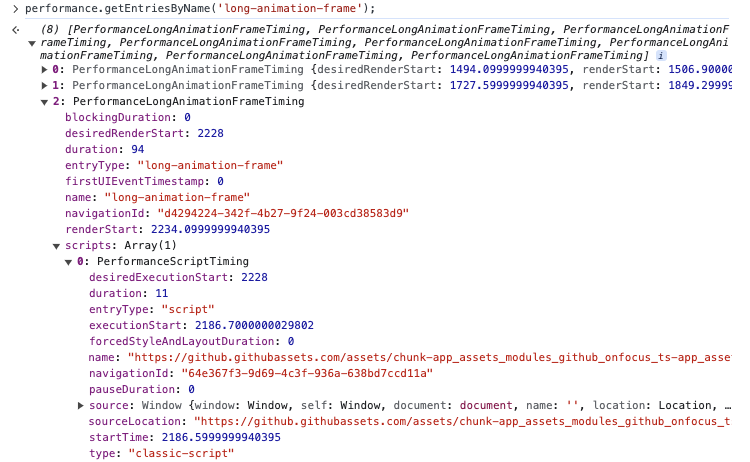
Once the API has been enabled long-animation-frame entries will be collected and returned by performance.getEntries().
A deeper look at LoAF data
Let's look at a long animation frame during the initial render of the Asana homepage. We can compare the LoAF data to what we see in the DevTools Performance tab.
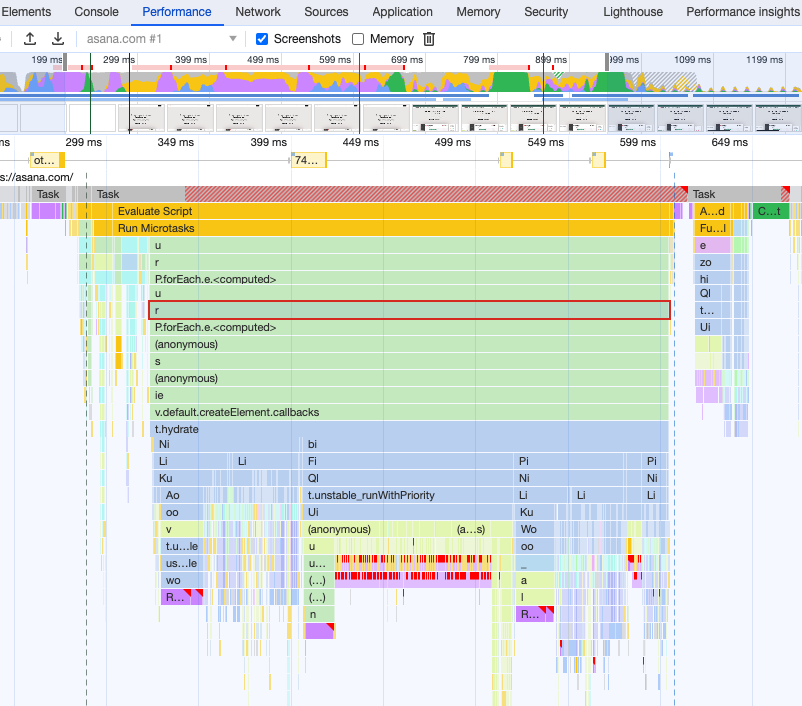
Script Attribution
We can look at the scripts entry of the performance entry to the duration of individual tasks.
const loafEntry = performance
.getEntriesByName("long-animation-frame")
.filter((e) => e.duration > 200)[0];
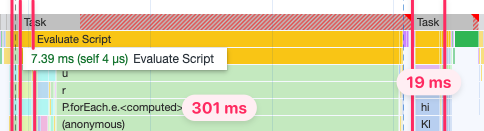
console.log(loafEntry.scripts.map((s) => s.duration));
// [7, 10, 301, 19]
You can see that this matches the data reported by DevTools.
The name property of each script tells us what triggered the script to run. In this case the script URL is shown in most cases because we are looking at the initial load of the JavaScript bundles on the page.
console.log(loafEntry.scripts.map((s) => s.name).join("\n"));
/*
https://asana.com/_next/static/chunks/main-381f053c1076c06e.js
https://asana.com/_next/static/chunks/pages/_app-56ef24c772d01e47.js
https://asana.com/_next/static/chunks/pages/%5B%5B...slug%5D%5D-2a55f03d1dccb1ac.js
FrameRequestCallback
*/
FrameRequestCallback is different, it indicates a requestAnimationFrame call on the page. We can look at the source location data for the script to find where this callback is scheduled.
const script = loafEntry.scripts[3];
console.log(script.sourceURL);
console.log(script.sourceFunctionName);
console.log(script.sourceCharPosition);
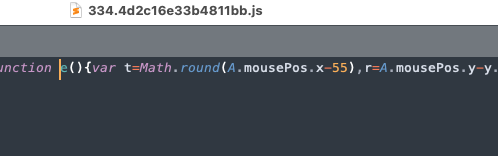
// https://asana.com/_next/static/chunks/334.4d2c16e33b4811bb.js
// e
// 4371
If we look for the 4371st character in the script we find the e function that's used as the requestAnimationFrame callback.
The name property can also identify event handlers like DOMWindow.onresize when the window size changes.
Identifying a forced synchronous layout
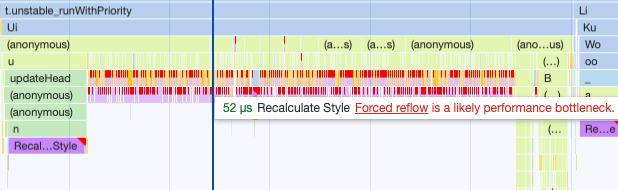
Looking at the longest script in more detail find that 112 milliseconds are spent on forcedStyleAndLayoutDuration.
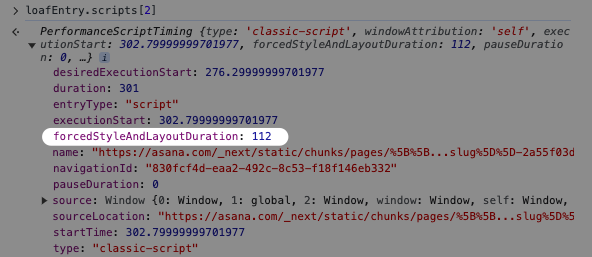
This matches the forced synchronous layout reported in DevTools.
Understanding LoAF data for a simplified scenario
We've created a simple page with two slow click event handlers attached to a button:
- The first click handler in
script-2.jsruns for 1 second - The second click handler in
script-3.jsruns for 2 seconds
Both call a blockCPU function in script-1.js.
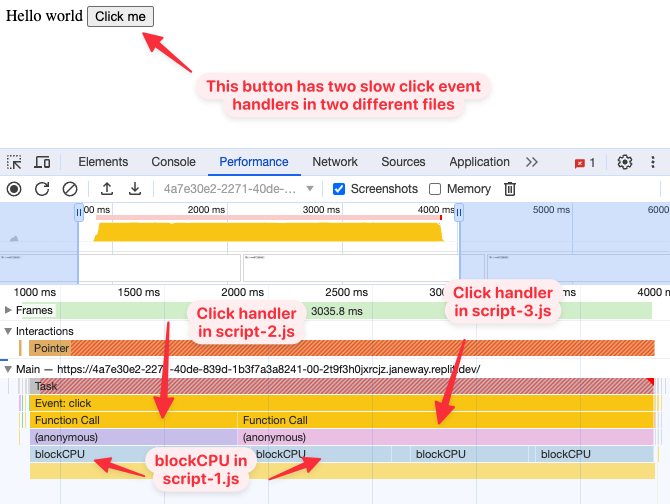
What does the LoAF data say? We can see that all activity is attributed to script-2.js and script-3.js. LoAF attribution looks at how a task is triggered, not what file most time is spent in.
When the button is clicked Chrome knows that it should run both handlers. But it takes a while before the second handler can run, so we see a one second delay between the desiredExecutionStart and the executionStart of script-3.js.
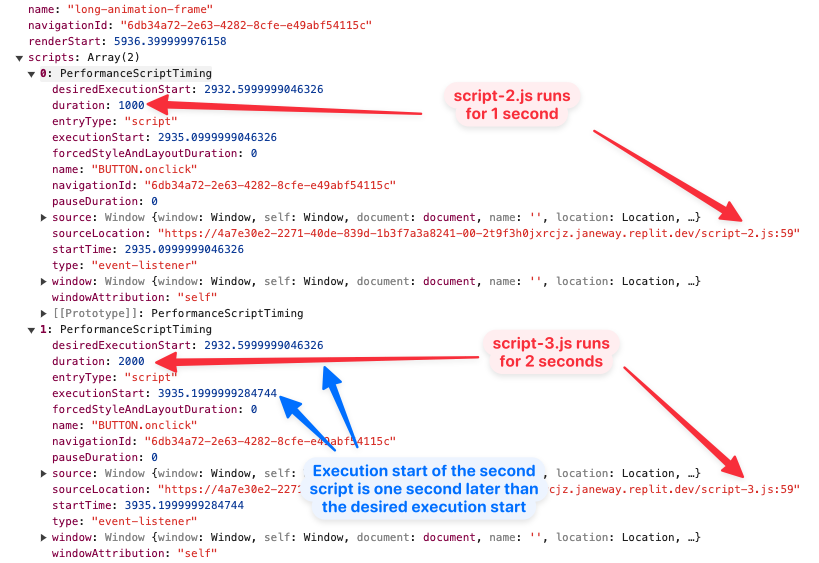
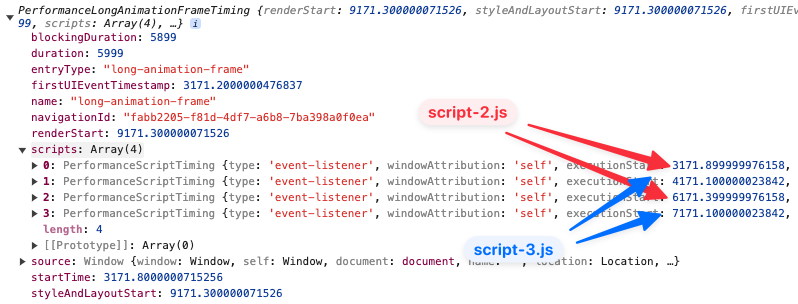
What if we click the button a second time while the first event handlers are still running? We now get four entries in the scripts array, one for each time an event handler starts running.
Long frames caused by user interactions
If an event handler is slow you will see the element selector and event type shown in the script invoker name, for example BUTTON#example3.onclick.
You can also look at the firstUIEventTimestamp value of the LoAF entry to identify whether an event was handled. If that value isn't zero the animation frame likely causes slow Interaction to Next Paint.
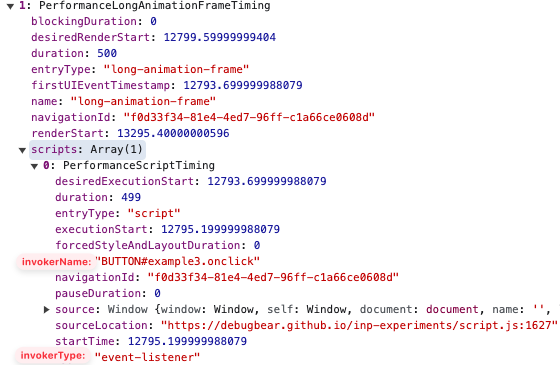
invokerName used to just be called name and invokerType used to just be called type
Long animation frames in DebugBear
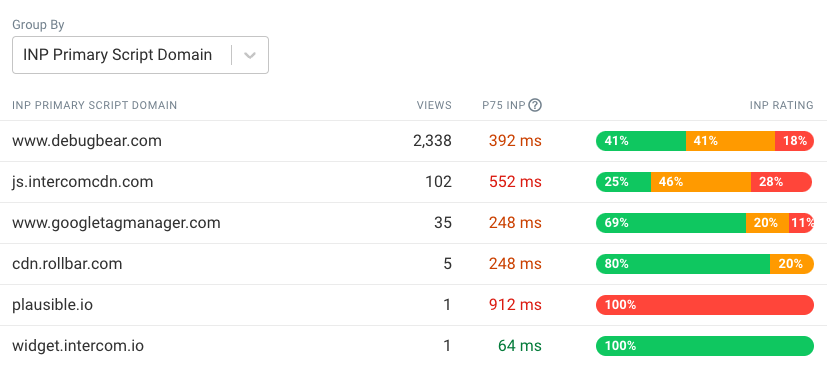
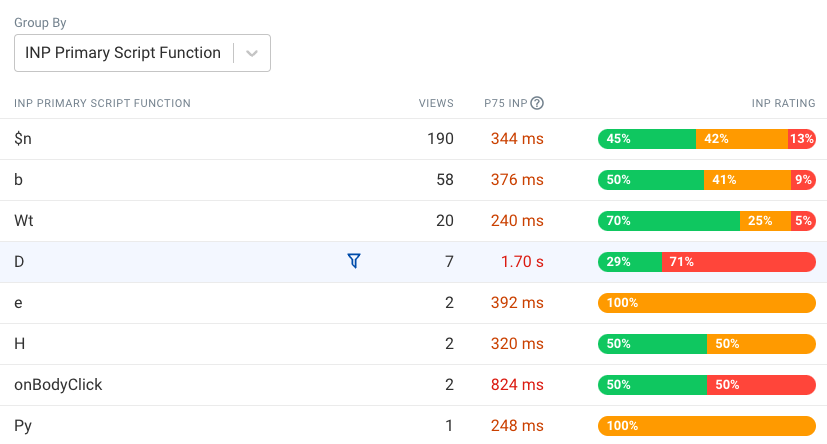
DebugBear real user monitoring uses the Long Animation Frames API to show you which scripts have the biggest contribution to your Interaction to Next Paint score.
We identify the longest LoAF script for the INP interaction and break it down either by script domain or by script URL. Looking at the domain breakdown is a great way to see if slow interactions are caused by your own code or by a third-party script embedded on your website.
You can also view the function name for the script. Since most production code is minified the name by itself won't be all that informative. So to debug it you can hover over the row, click on the funnel icon, and then switch to the Elements or Page Views tab to learn more the matching interactions.
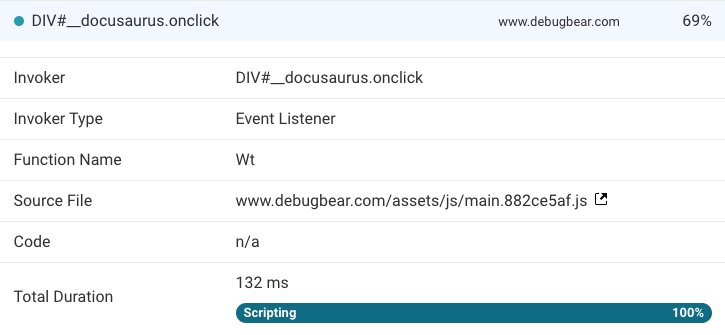
When looking at a specific page view you can see the element that the user interacted with as well as all the scripts involved in the long animation frame.
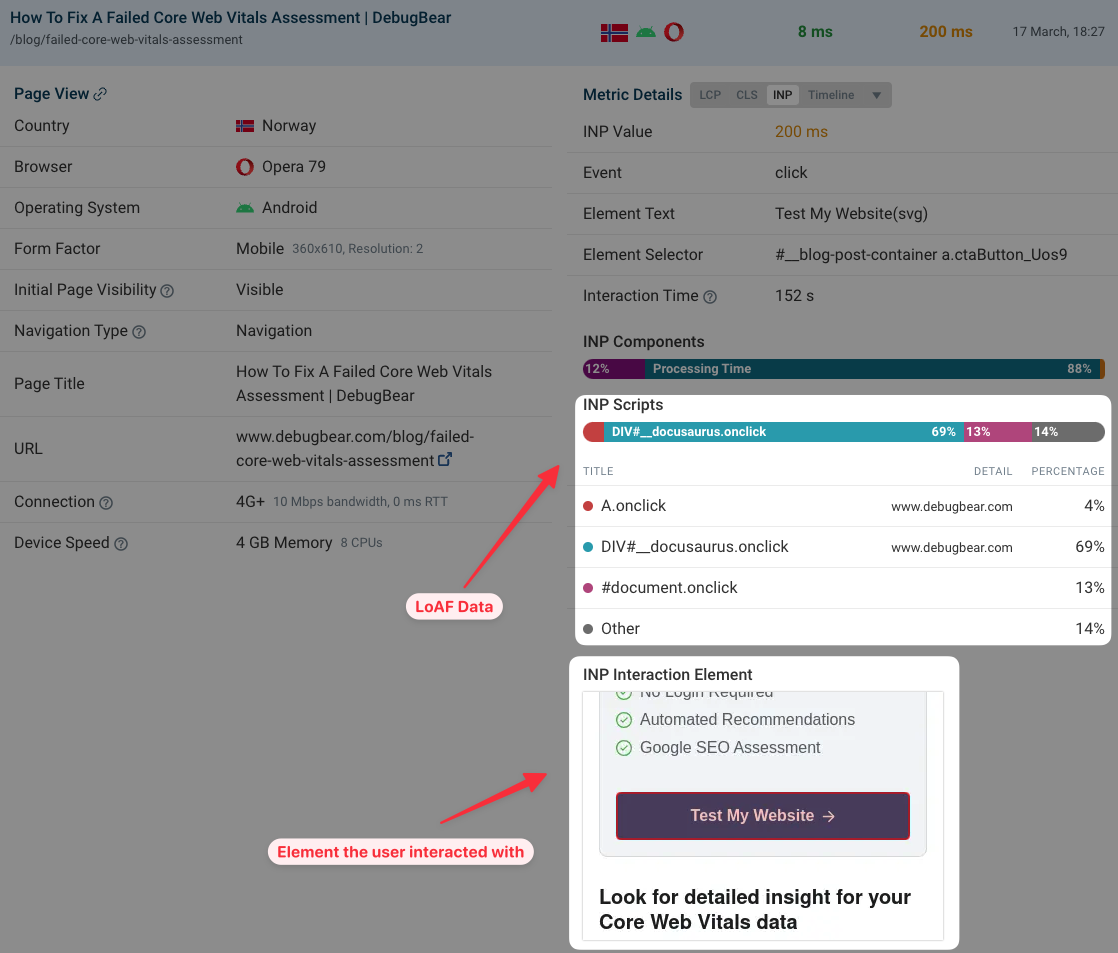
Each script can be expanded to show the source location as well as what type of processing the browser is performing, for example running JavaScript or synchronous style recalculations.
You can try DebugBear RUM for free by signing up for a trial here.