RUM Page Views Tab
The RUM Page views tab allows you to take a closer look at individual visits to your website.
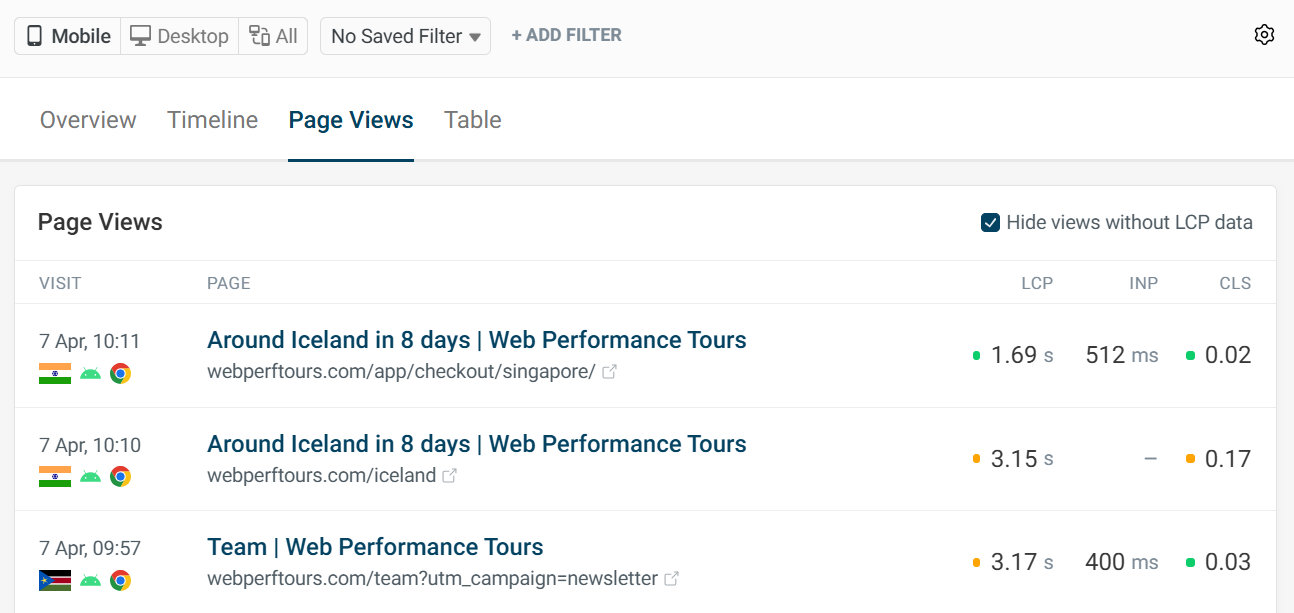
List of Page Views
The overview shows a list of page views with this information:
- Page title and URL
- Browser
- Device
- Location
- Core Web Vitals scores
Individual Page Views
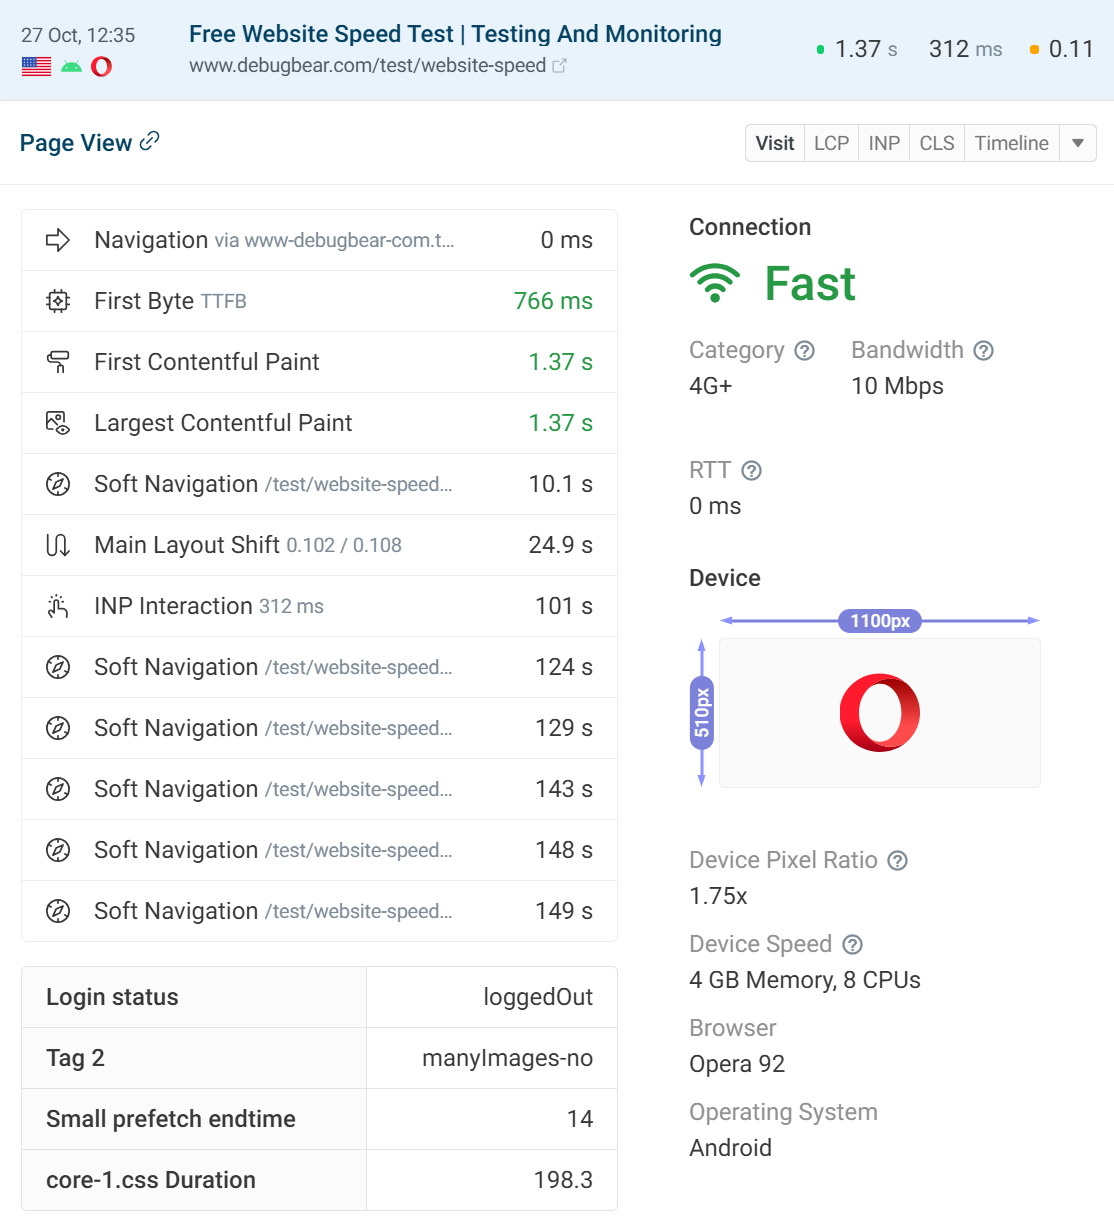
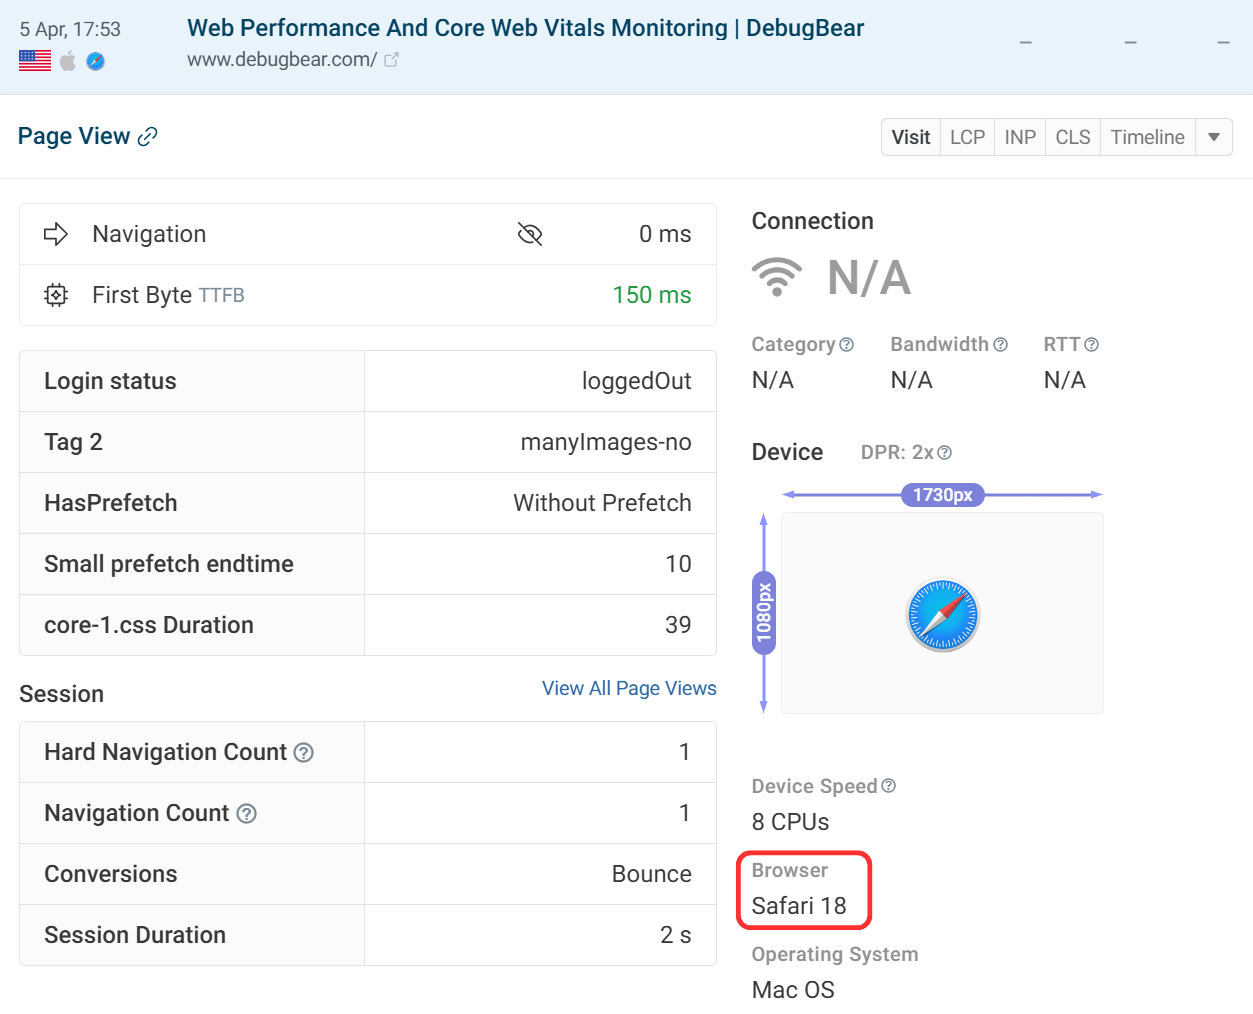
Clicking into an experience will present more data on the visit. The visit tab shows information on the browser version and also how the user navigated to the page.
It is useful to know details about the user experience because it can have an effect on results. A poor connection will result in worse scores for a particular user.
If you notice bad scores from a visitor with a fast connection, then optimization may be needed and you could see similar results from other visitors in the experiences overview.
Navigation type can also affect a metric score, if a page is reloaded then LCP may be scored better due to caching. Back and forward navigations (BFCache) can also affect scores.
Some metric data is available in the timeline tab such as Time to First Byte and First Contentful Paint. As well as soft navigations for SPAs.
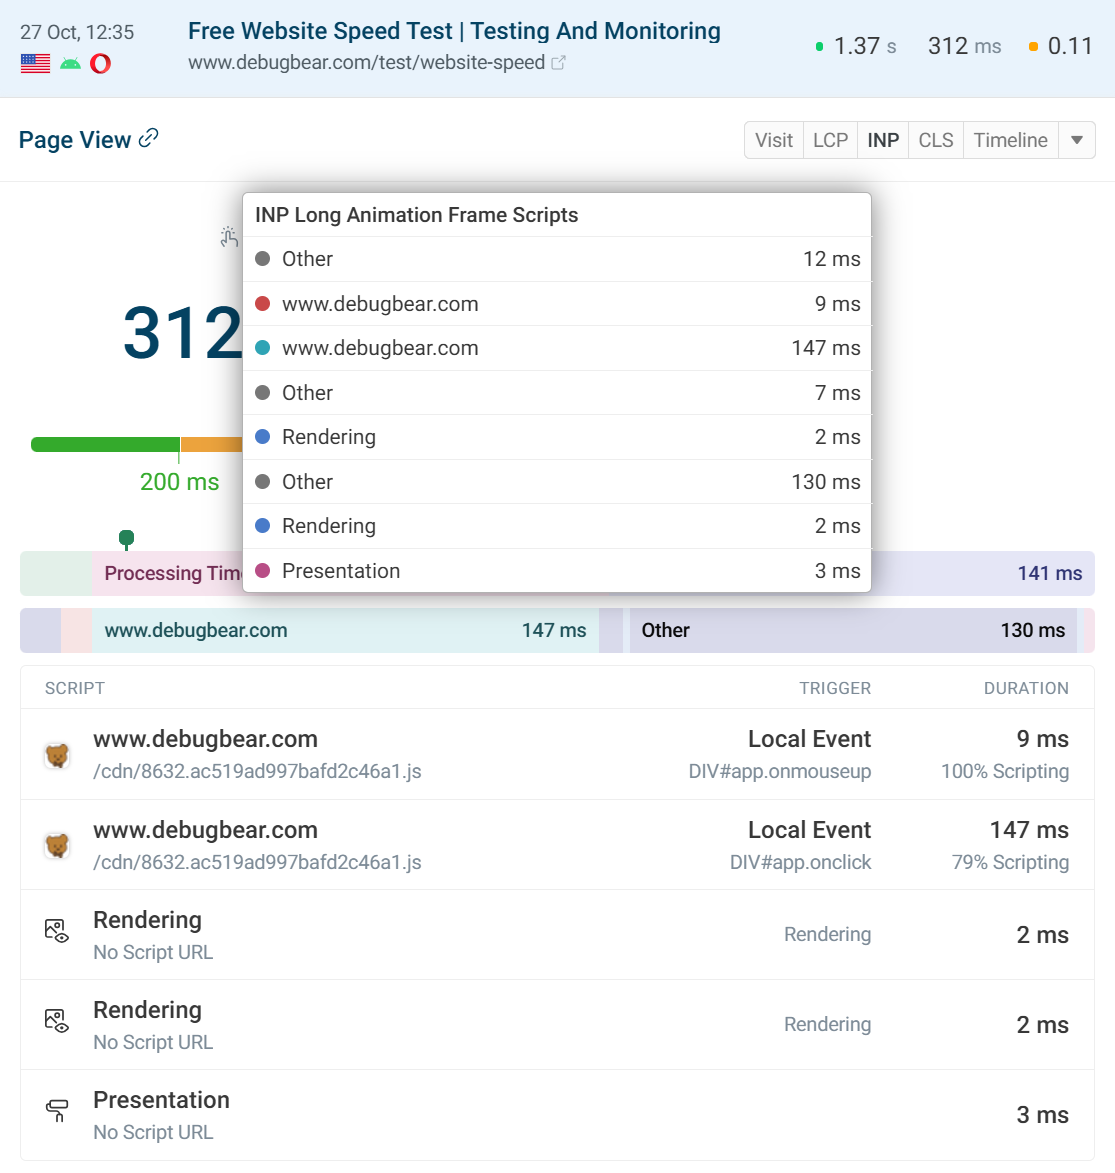
Some experiences may include a Long Animation Frames breakdown included in the Interaction to Next Paint tab.
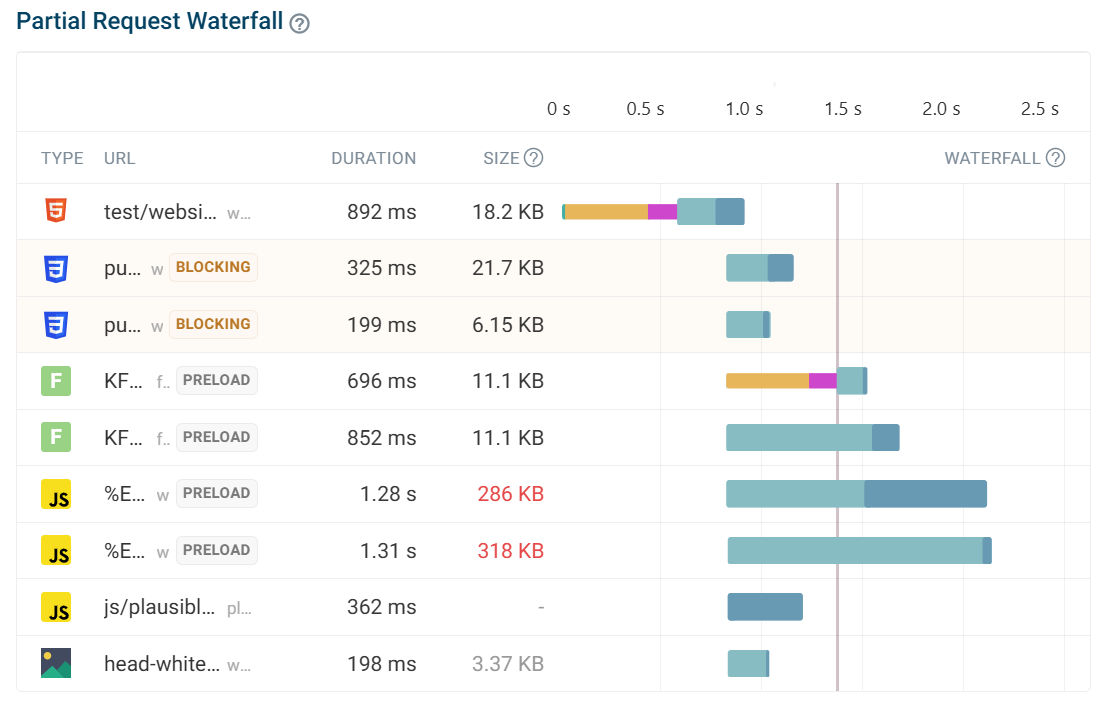
A partial request waterfall is available below with the 10 most important requests.
Missing Core Web Vitals in Non-Chromium Browsers
Core Web Vitals have historically been a Chromium-only feature, which means some visitor sessions may not include complete metrics data.
Browser support has expanded over time: Safari added LCP and INP support in version 26.2, and Firefox introduced INP support in version 114. For a full breakdown of which metrics are supported in each browser, see our Core Web Vitals browser support guide.
Visitors using older browser versions will not report metrics that weren't yet supported at the time of their release, so gaps in data are expected for those sessions.
Debugging Experiences
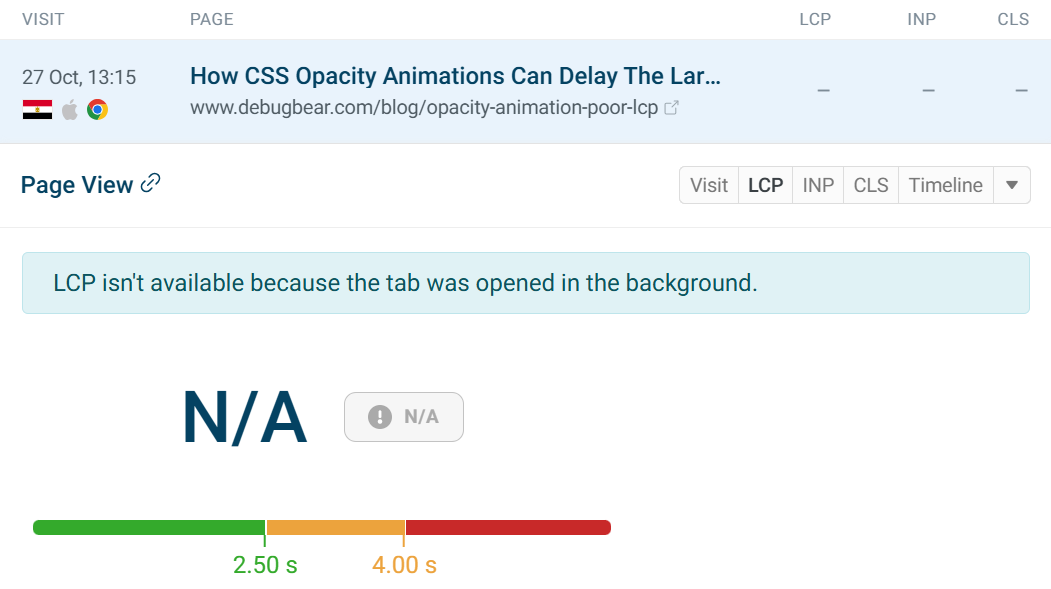
Viewing individual page views can provide insight into what is causing a metric score. In this example we have an LCP score that has not been recorded, despite the visit being from Chrome.
This is due to the initial page visibility being hidden, as the tab was opened in the background. If a page is not viewed, LCP cannot be recorded, or the page may have been viewed after monitoring was complete.
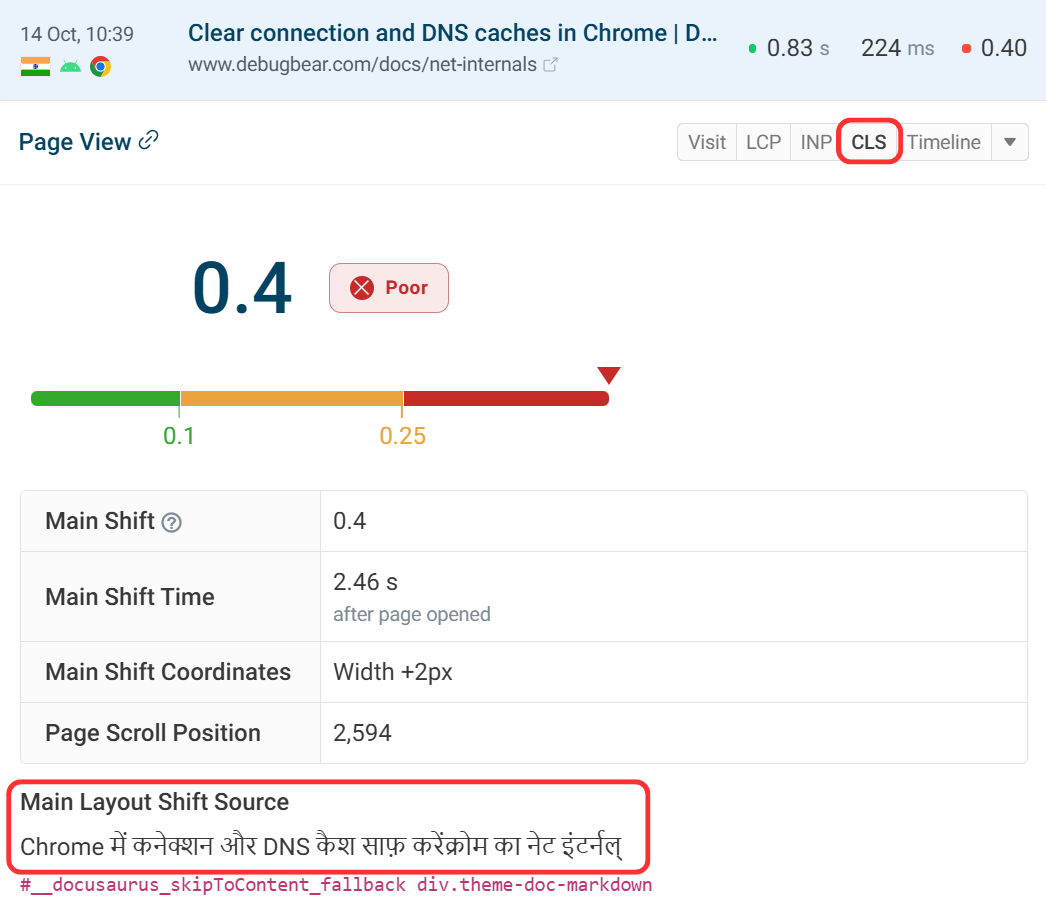
In this example, we have selected a page which has a good CLS score for most visitors. This individual experience has a poor CLS score at 0.4.
Navigating to the CLS tab we can learn more about how the page was presented in this instance. Due to the location of the user, the page was translated 2.46 seconds after the page opened which caused the layout shift.
The Main Layout Shift Source value shows what the user sees and this translated text is not in the HTML.
Screenshots of elements are taken independently as a visual example and not during the user's visit, that's why the translated text is not shown there.