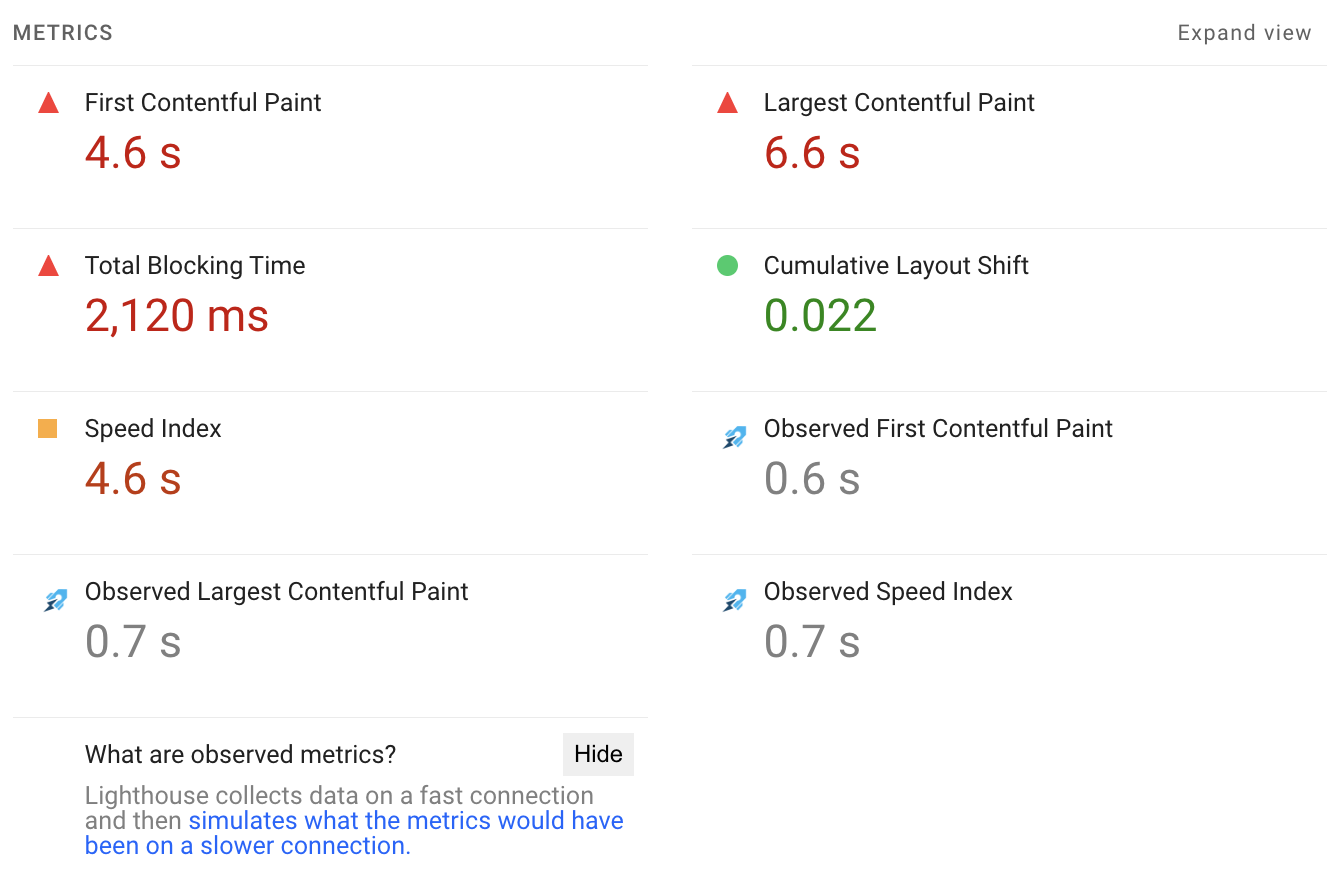
Lighthouse measures page speed metrics and suggests potential improvements.
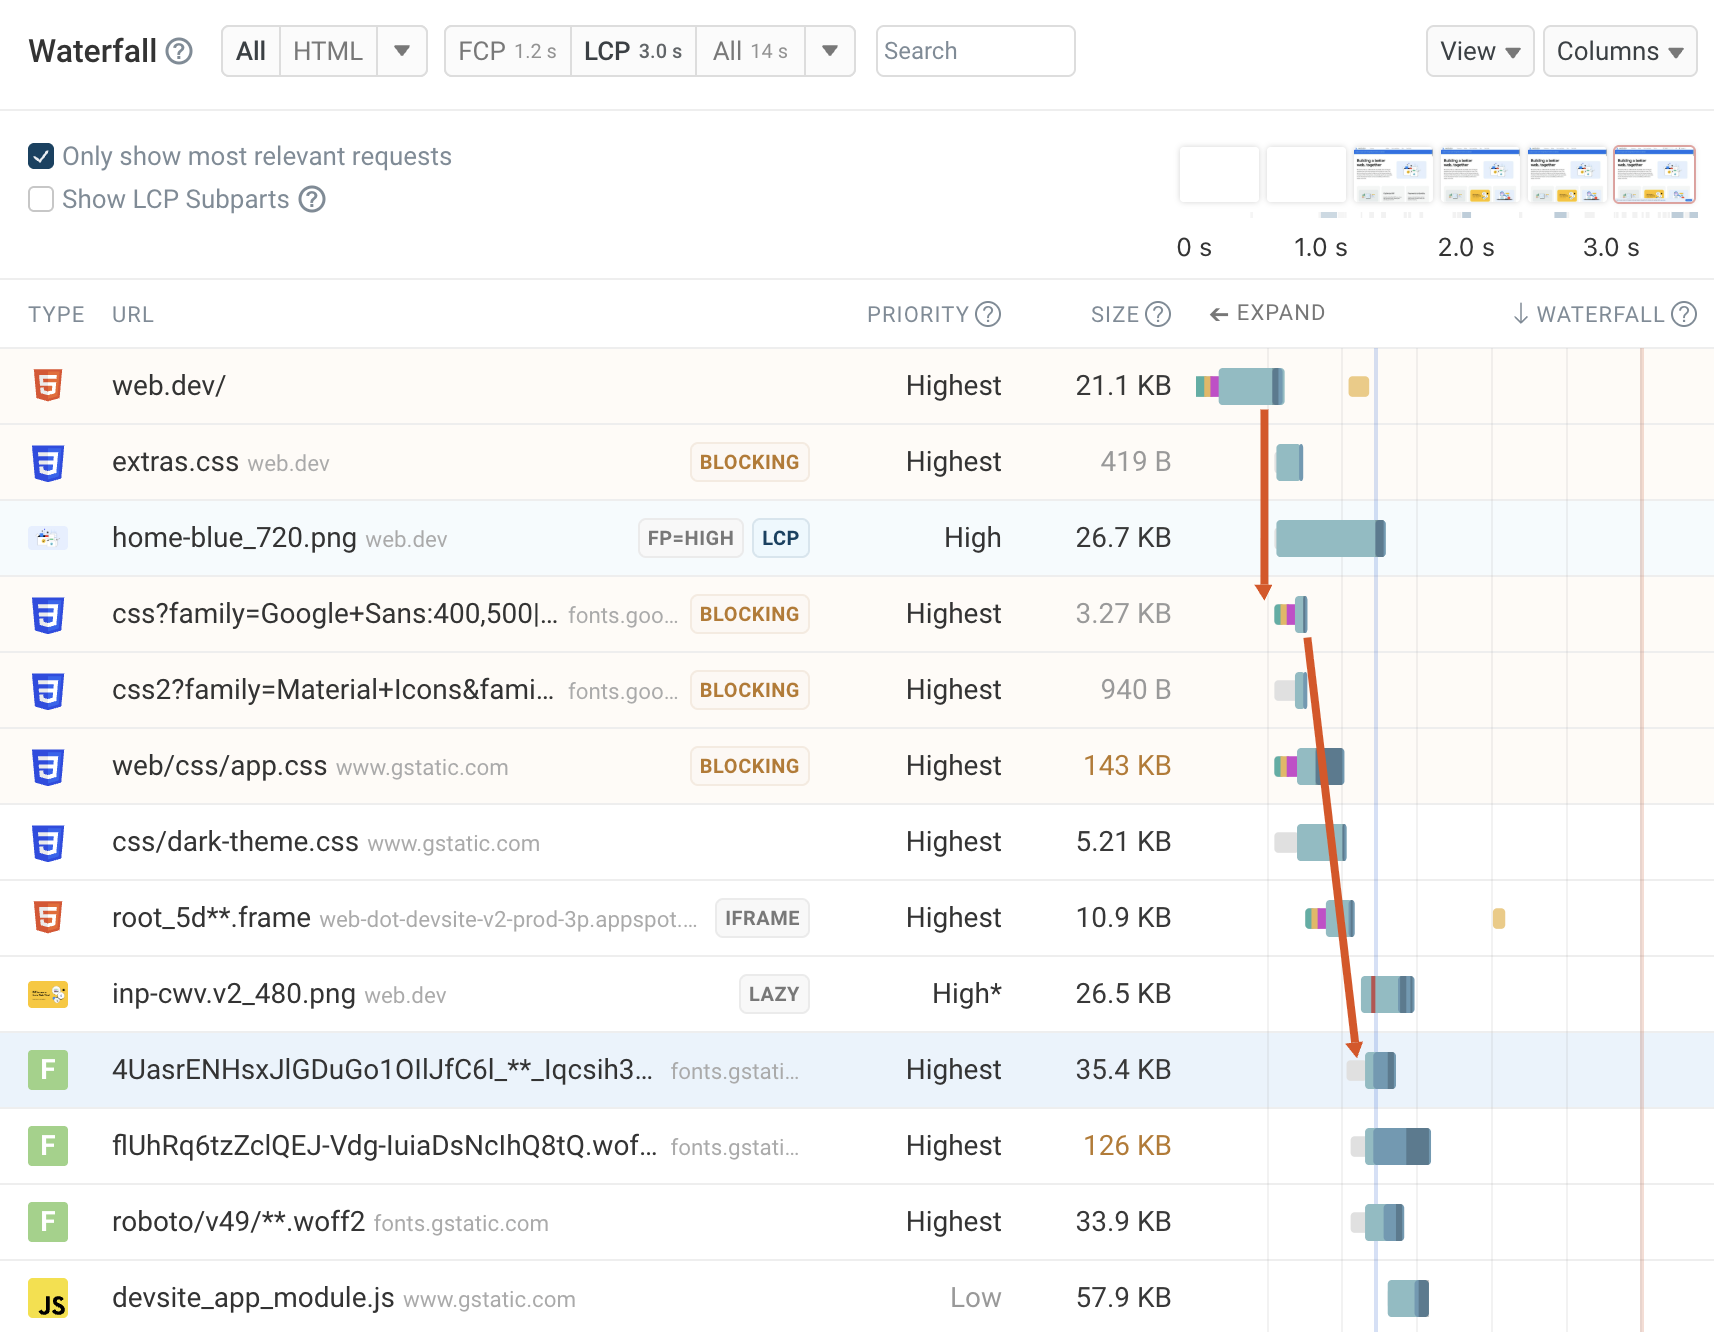
But it doesn't really show you how your website loads.
Waterfall charts show you exactly what's slowing down your website.
Custom page speed recommendations
DebugBear includes custom-built website performance recommendations that set it apart from the Lighthouse suggestions.
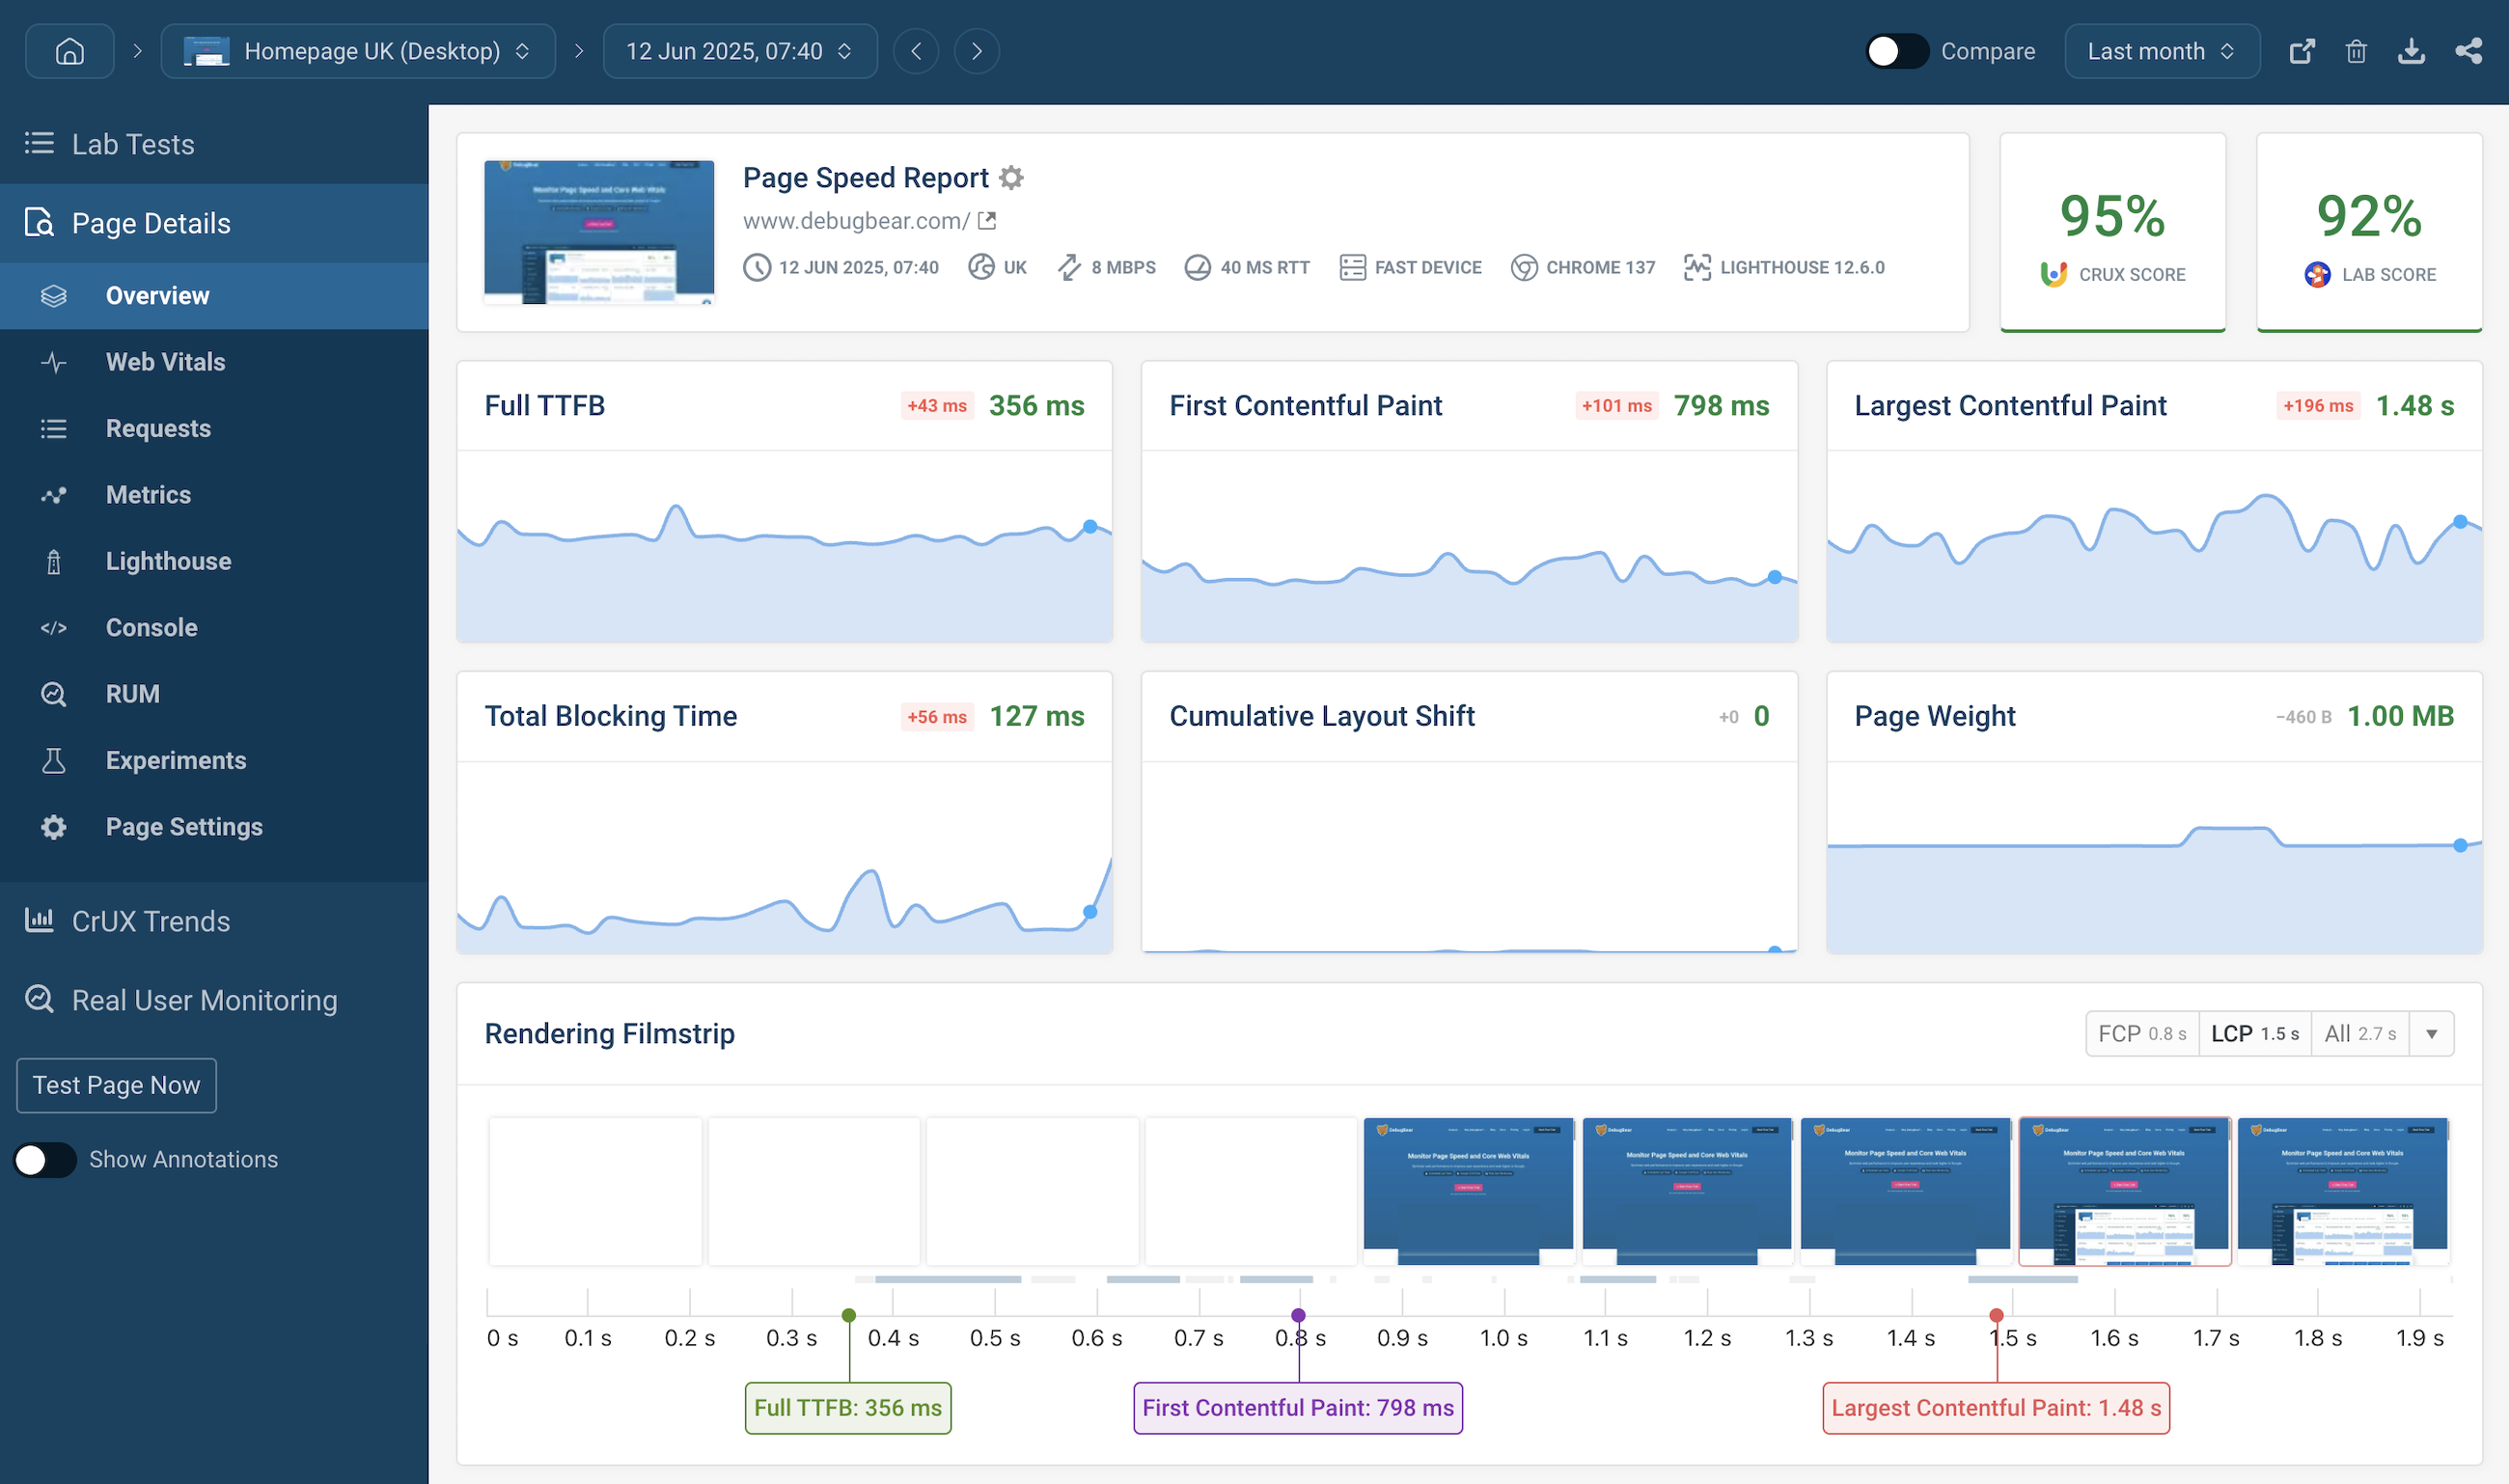
DebugBear slows down the network and CPU to measure exactly how a visitor with a certain connection speed
and device type would experience your website.
Go beyond lab tests with real user data
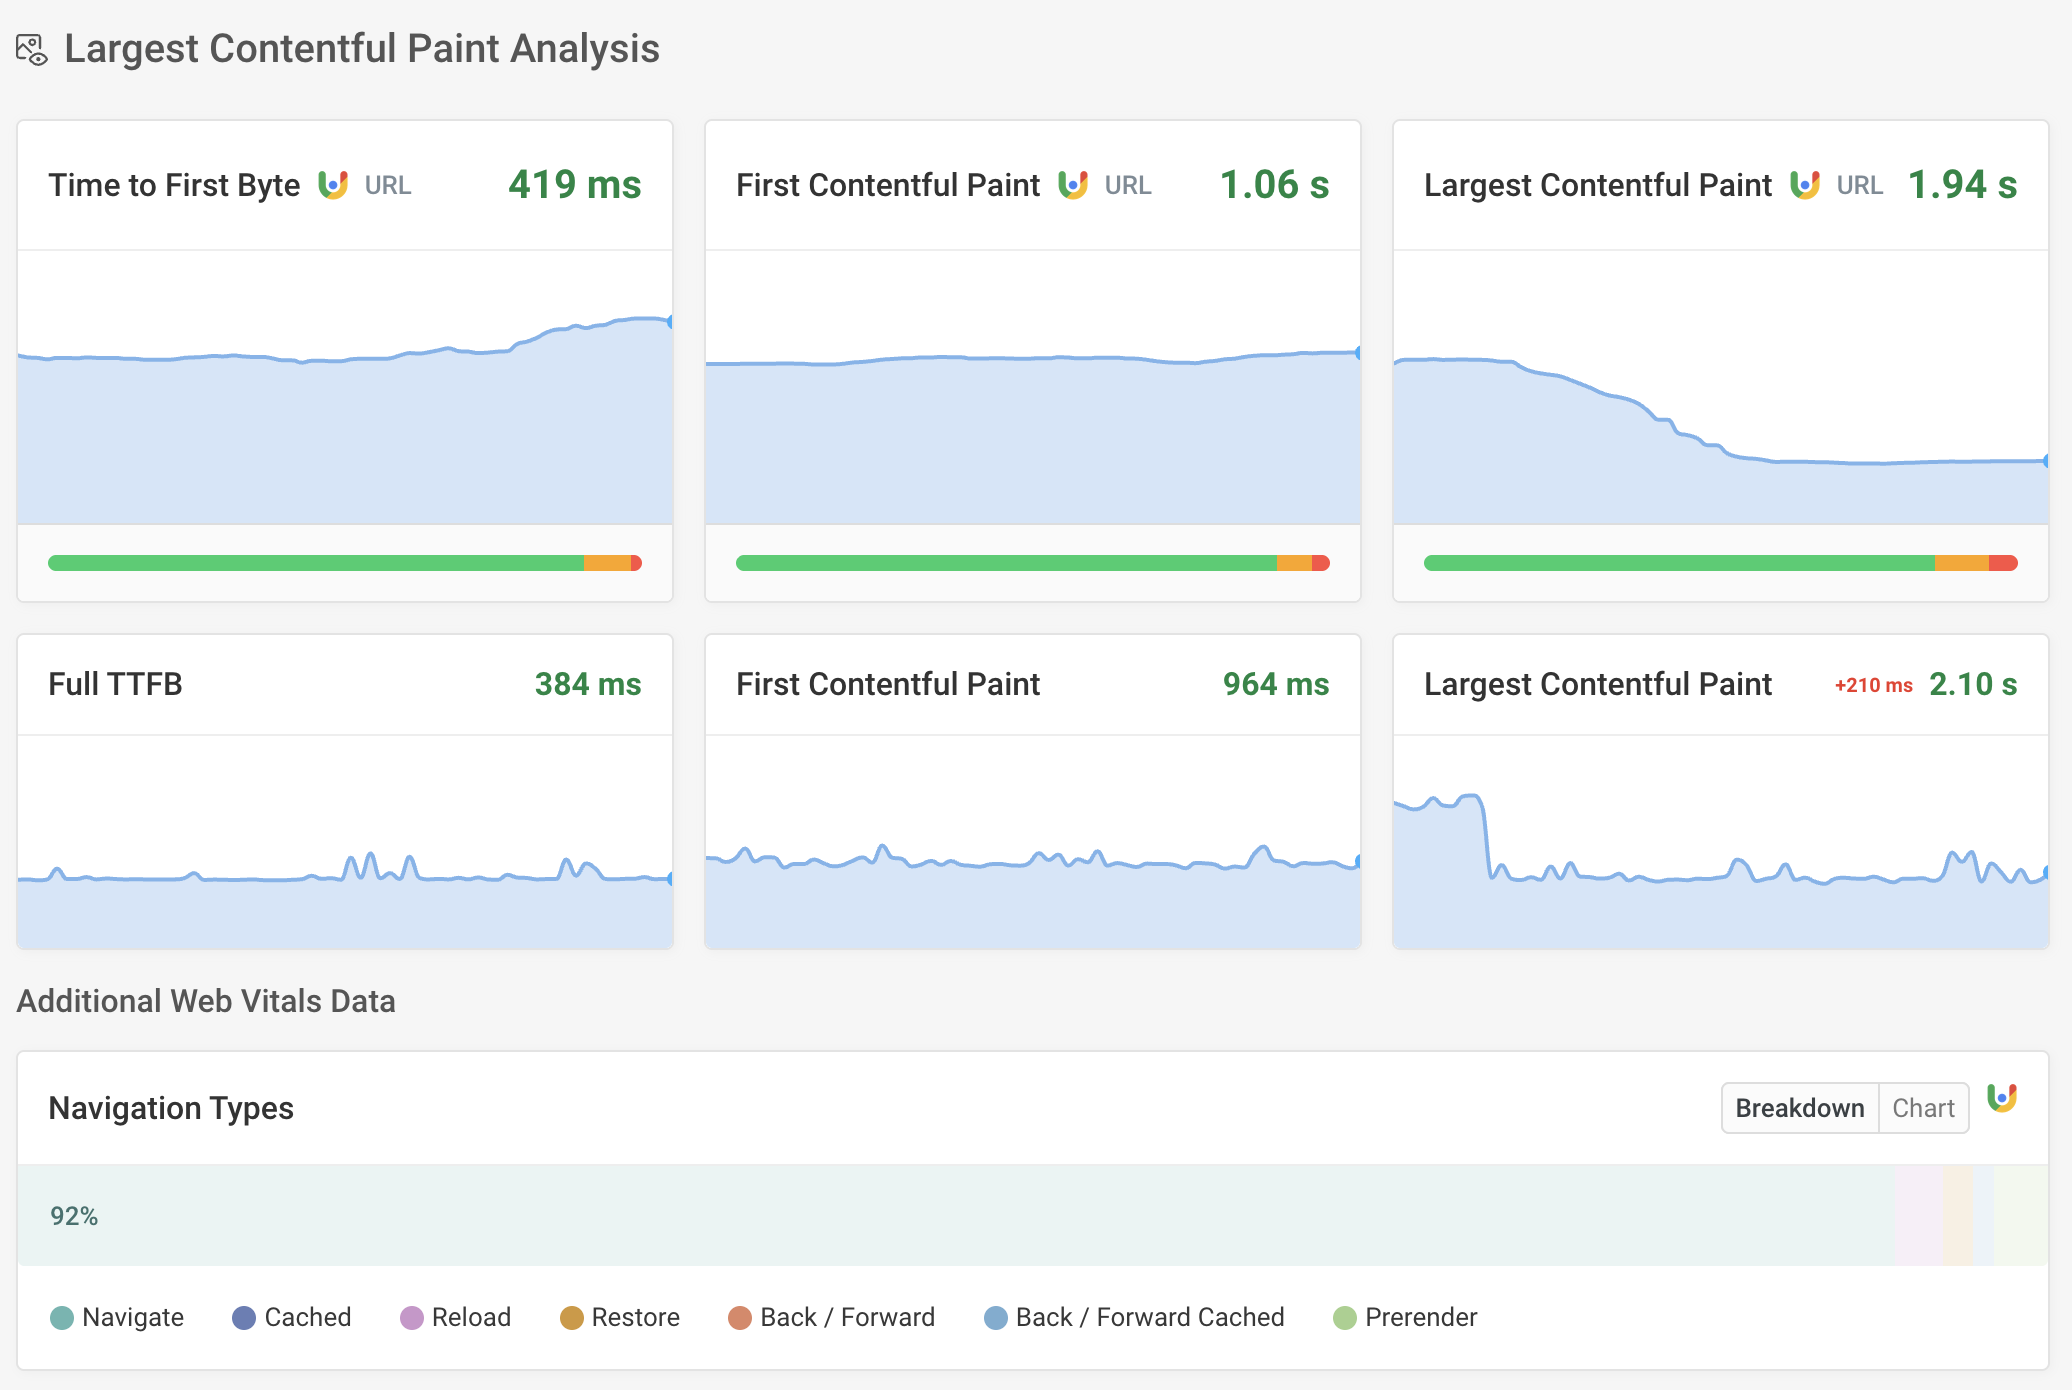
Google CrUX Data
The Chrome User Experience Report (CrUX)
provides real-world performance data for your website and is used by Google as a ranking factor.
With DebugBear you can easily keep track of these metrics.
Easily configure your page speed tests
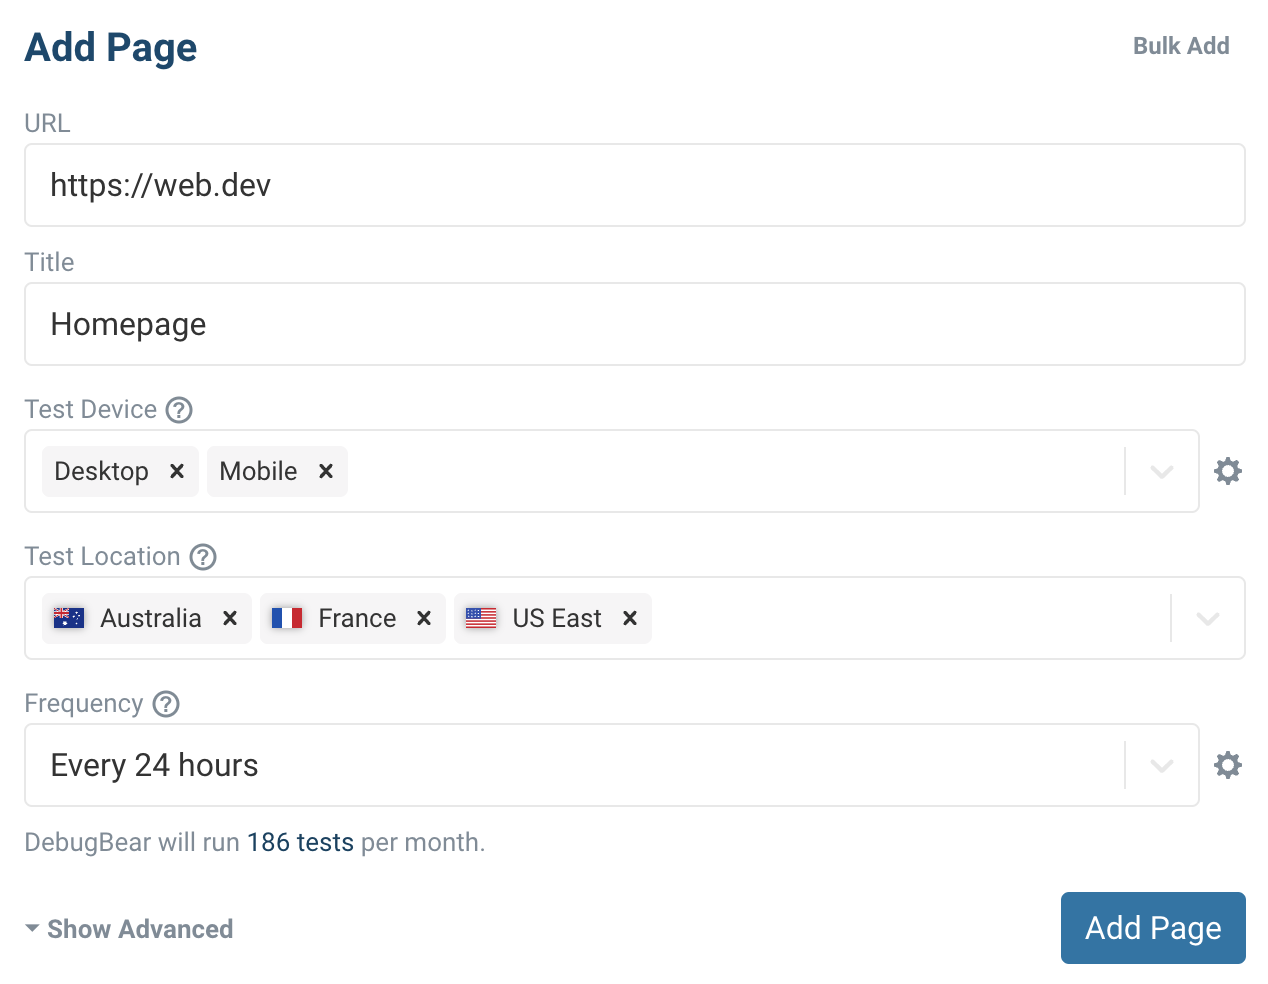
Test authenticated pages
Using Basic Auth or need to fill out a login form before running your tests?
DebugBear makes this easy.
20+ test locations
Lighthouse is only run in one location, whether that's a Google server or on your own computer.
With DebugBear you can select from over 20 global test locations to match what your visitors experience.
Improve the new INP metric with real user monitoring
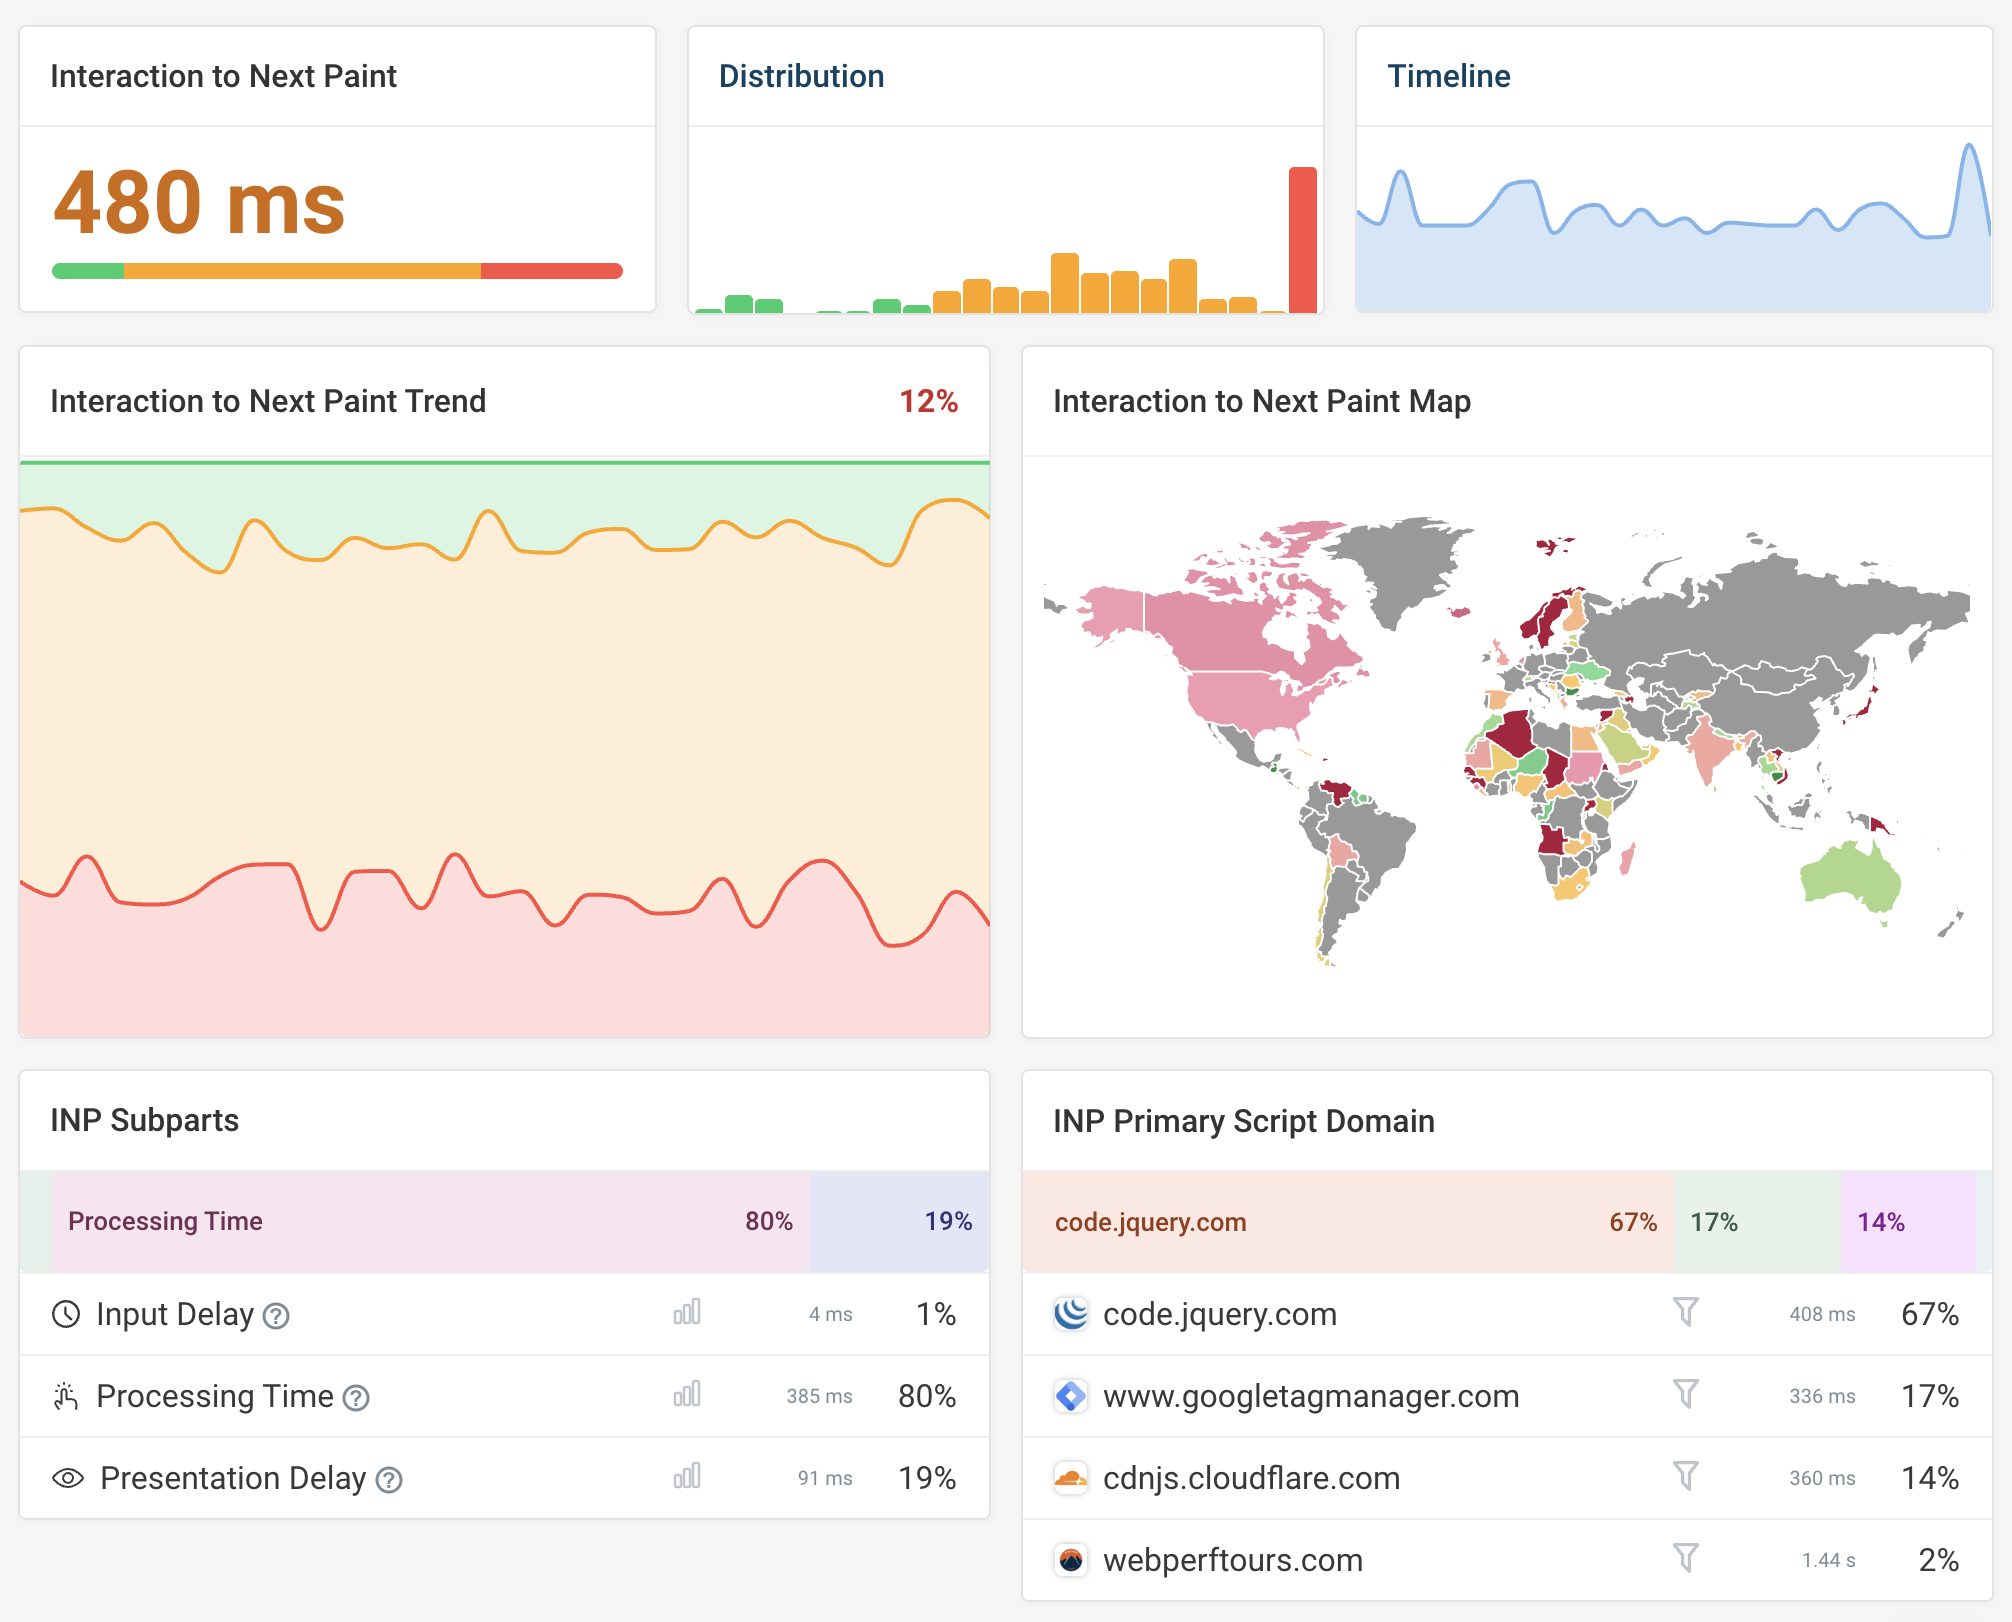
What is INP?
Interaction to Next Paint (INP)
is a new Core Web Vitals metric that Google introduced in 2024. It's tricky to measure with a lab-based tool
like Lighthouse, as it requires a user interaction to be measured.
Fix INP with DebugBear RUM
DebugBear's real user monitoring (RUM)
functionality lets you identify slow pages, what elements users are interacting with,
and what's contributing to these delays.
Continue tracking Lighthouse scores
DebugBear analyses include a Lighthouse test
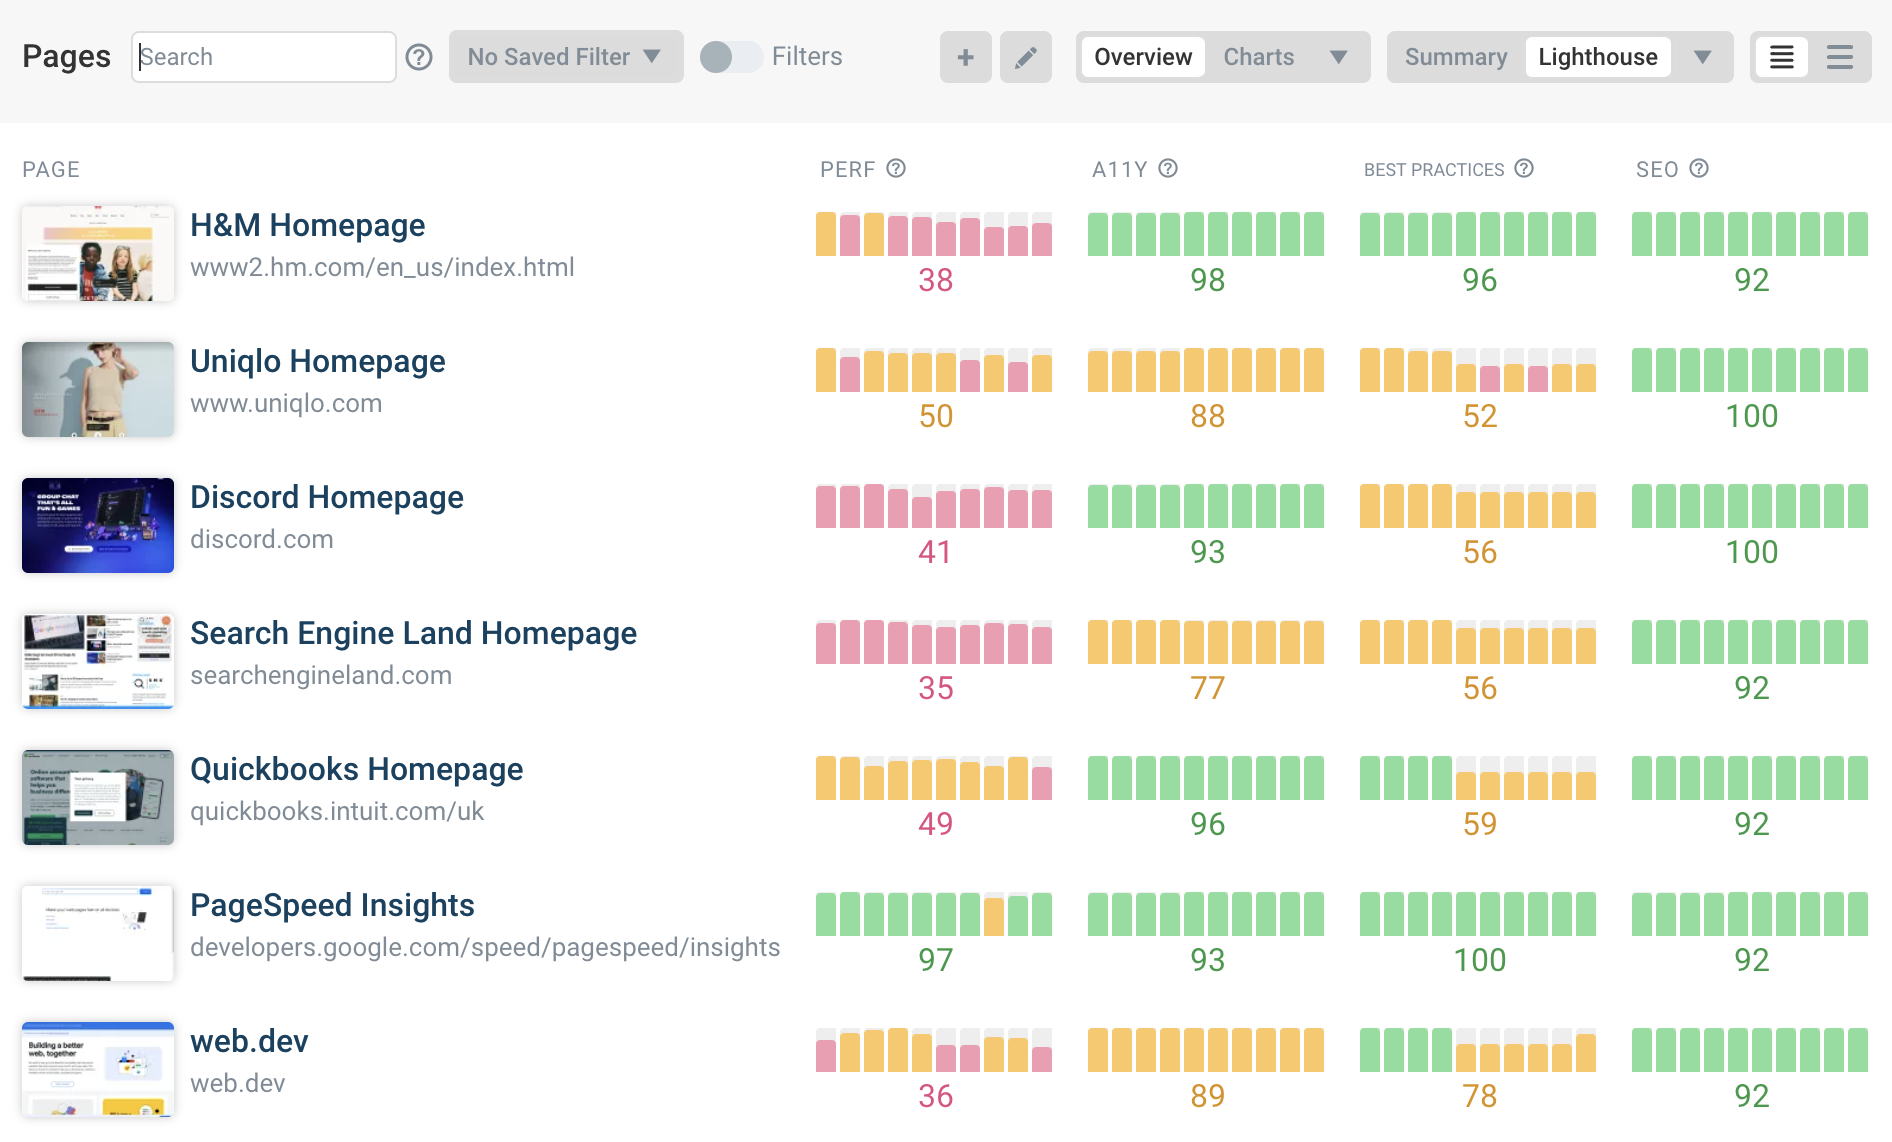
Continue tracking your scores for Performance, Best Practices, Accessibility, and SEO.
Investigate Lighthouse score changes
Having continuous monitoring data means you can find out why your score has changed over time.
See exactly what audit has changed and how it affects your overall score.