
Core Web Vitals are the gold-standard metrics for assessing page speed, so whether you're a developer, SEO specialist or web editor, you'll need the right tools to see how your website is performing.
In this guide, we'll reveal some of the practical tools out there for checking on your site's vital signs.
Why do Core Web Vitals matter?
Core Web Vitals are a set of metrics that measure real-world user experience for page load speed, interactivity, and visual stability of the page. These metrics are important ranking factors for Google Search and can seriously impact your website's user experience and conversion rates.
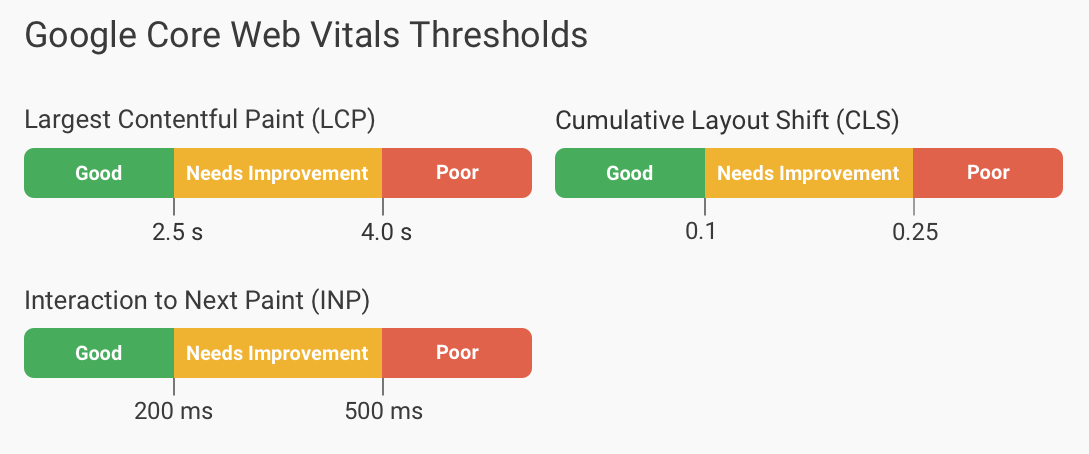
Google recommends site owners achieve good Core Web Vitals for success with Search and to ensure a great user experience generally. The three Core Web Vitals metrics are:
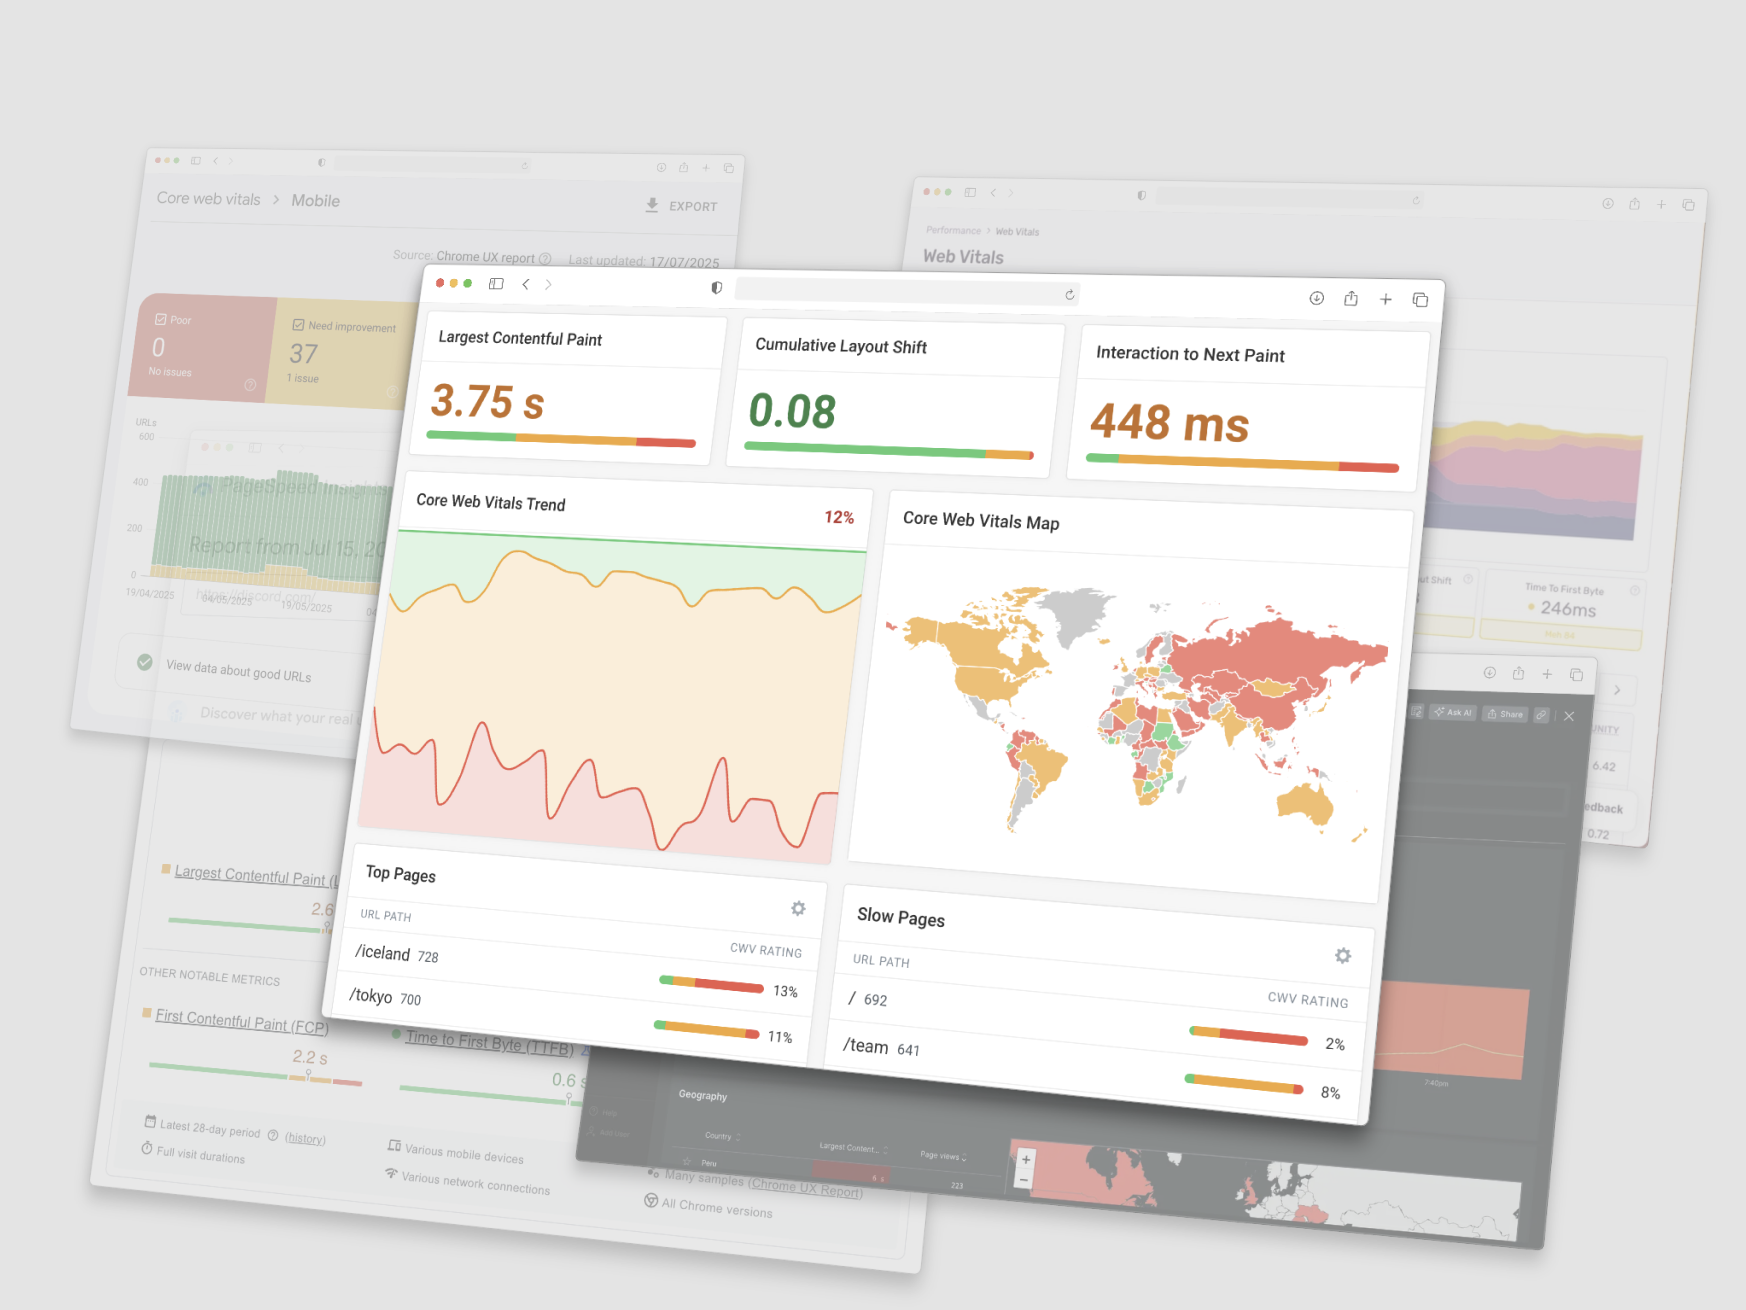
- Largest Contentful Paint (LCP): Loading performance - should occur within the first 2.5 seconds
- Interaction to Next Paint (INP): Responsiveness - should be less than 200 milliseconds
- Cumulative Layout Shift (CLS): Visual stability - should be less than 0.1
Understanding which tools to use for monitoring these metrics can make the difference between a website that ranks well and converts visitors, versus one that struggles with both search visibility and user engagement.
Types of web vitals data
Before we continue, let's look at three different ways of measuring Core Web Vitals, and the advantages of each.
CrUX field data
The Chrome User Experience Report (also known as the Chrome UX Report, or CrUX for short) is a huge dataset that tracks how real-world Chrome users experience websites. This field data represents genuine user experiences and it's what Google uses for search rankings.
Therefore, it's the figure that matters most when it comes to SEO. But the data only updates slowly (capturing trailing average performance from the previous 28 days) and only provides headline figures on speed. This makes it a bit impractical to work with when you're trying to make improvements and test that they work.
Real user monitoring data
With real user monitoring you capture page speed analytics directly on your website. When there's a change your performance scores update instantly, and you get technical debug data rather than just the plain scores CrUX provides.
Lab tests or 'synthetic' data
Conversely, 'lab tests' involve a specific machine (like Google, your laptop, or a monitoring service) loading a URL and measuring how fast everything loads.
Sometimes, this will take place via a server in a specific location, or the system will simulate a slower connection or processor (not always accurately!) so you can get a sense for what it's like to try to load your website on a mobile phone in La Paz, instead of your MacBook at your office.
Because all the details of the loading process are tracked during the test, lab tests generate more useful data that can help you identify and fix problems.
Tools For Tracking Your Core Web Vitals
Let's take a look at some of the best tools for tracking and optimizing Core Web Vitals on your website.
1. DebugBear
DebugBear is a comprehensive web performance monitoring platform with a focus on Google Core Web Vitals. You can track performance across your website using lab-based tests, CrUX data, and real user monitoring.
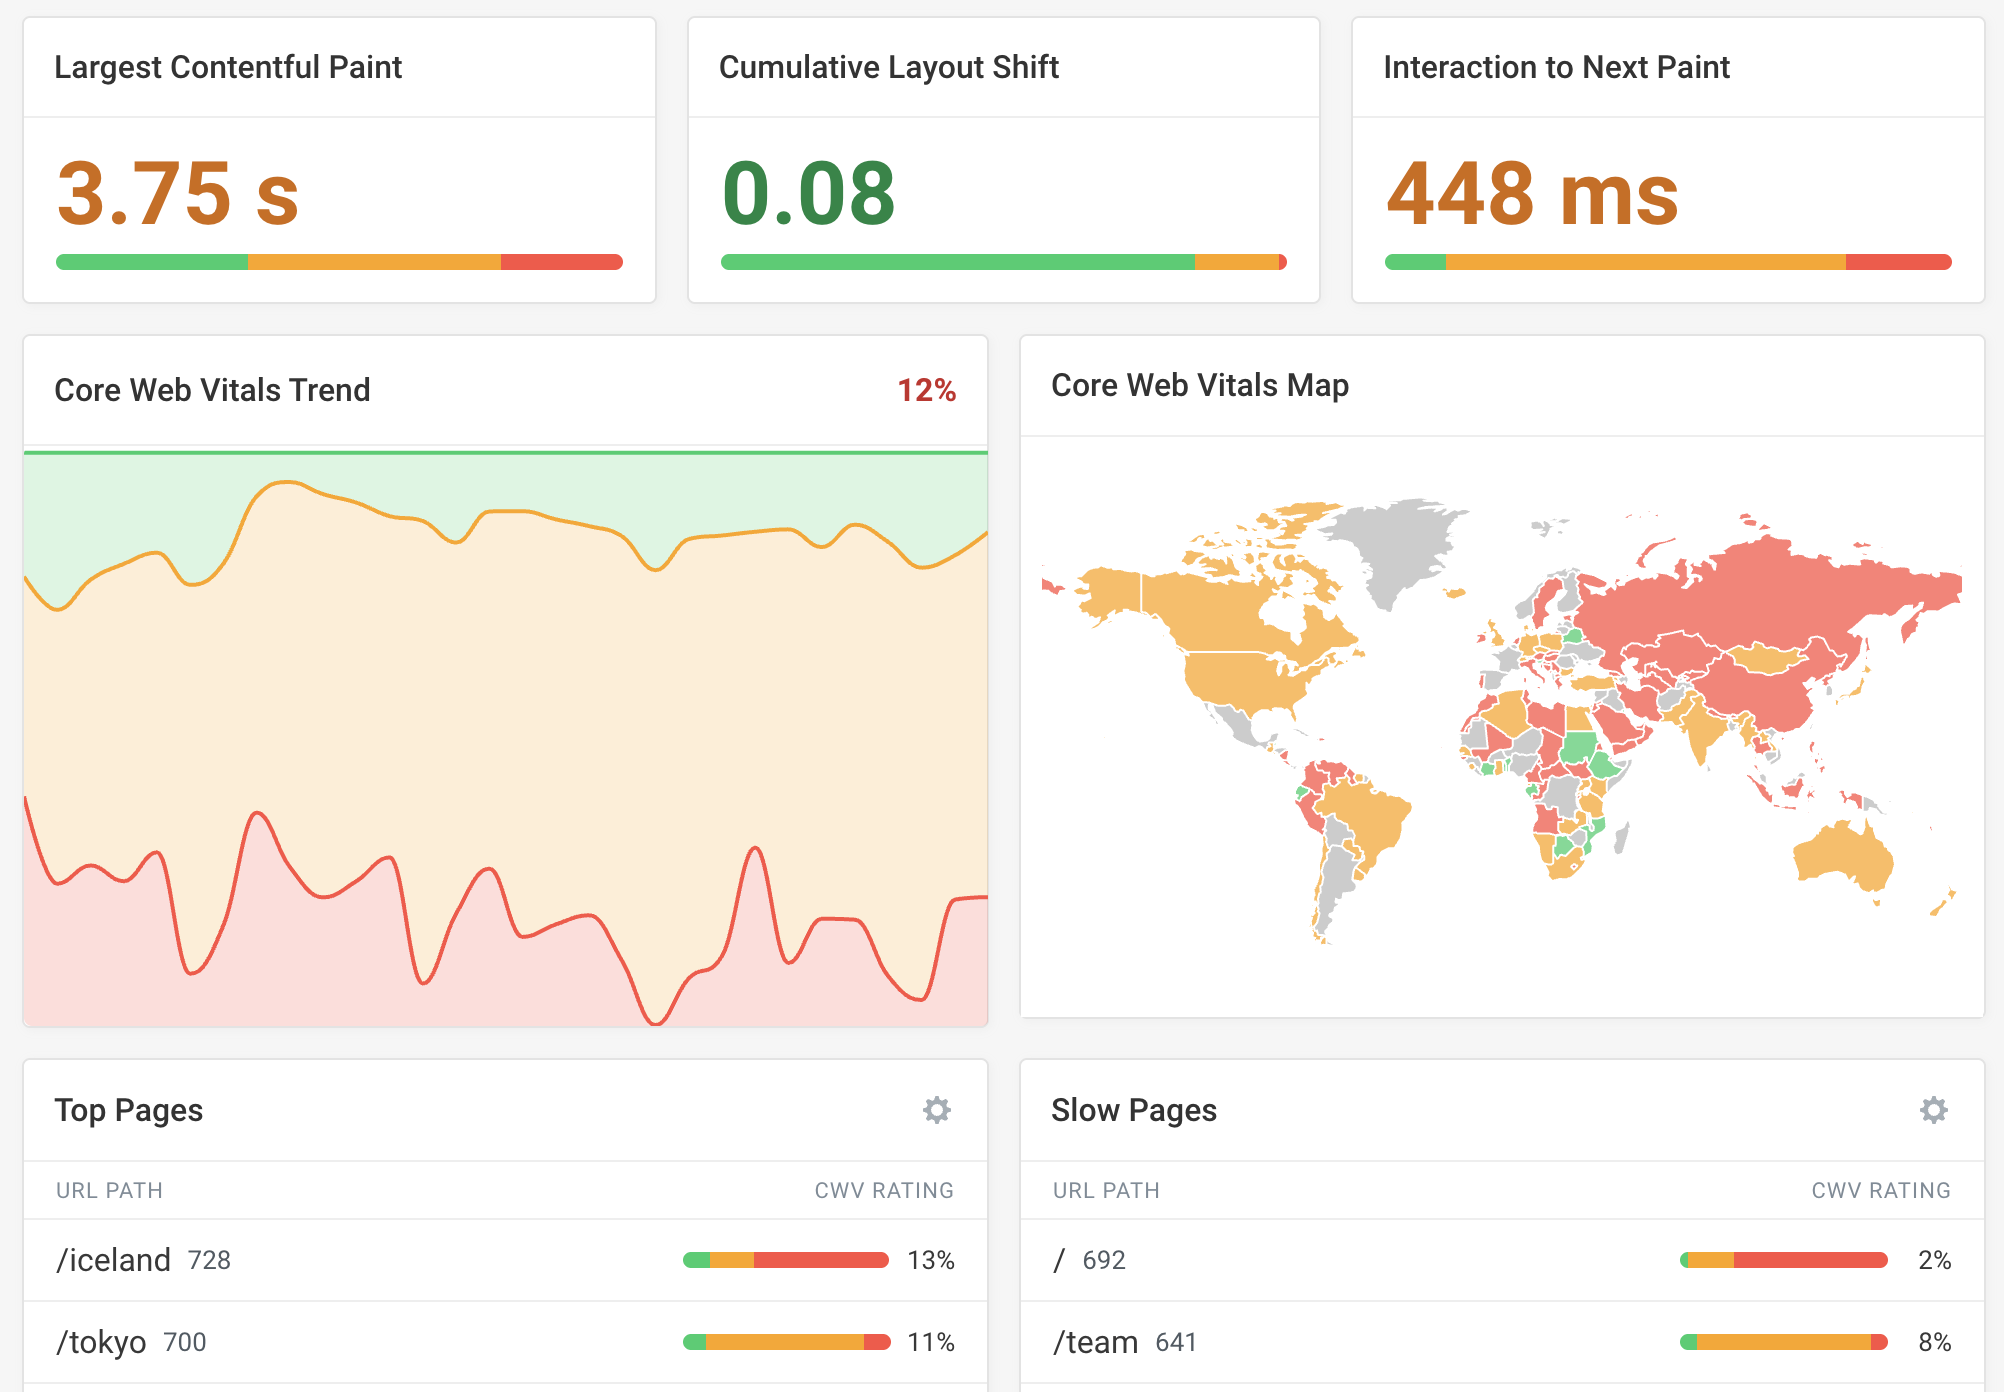
After identifying slow pages on your website, DebugBear provides detailed technical insights and recommendations that go beyond the standard Lighthouse-based recommendations on PageSpeed Insights. But each test report includes your Lighthouse Performance, SEO, and Accessibility scores too!
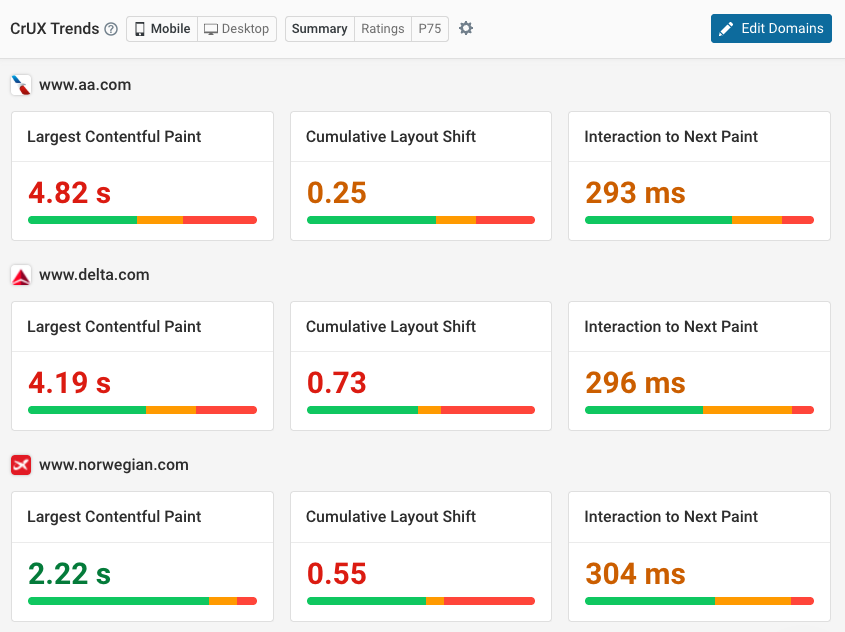
The CrUX Trends report uses Google CrUX data to show you how your website performance compared to your competitors.
Dashboards, charts and alerts make it easy to spot if something's amiss, and you can even track the performance of competitor websites to see how you measure up. You can set up DebugBear and start getting results in minutes. Try it for free for 14 days.


Monitor Page Speed & Core Web Vitals
DebugBear monitoring includes:
- In-depth Page Speed Reports
- Automated Recommendations
- Real User Analytics Data
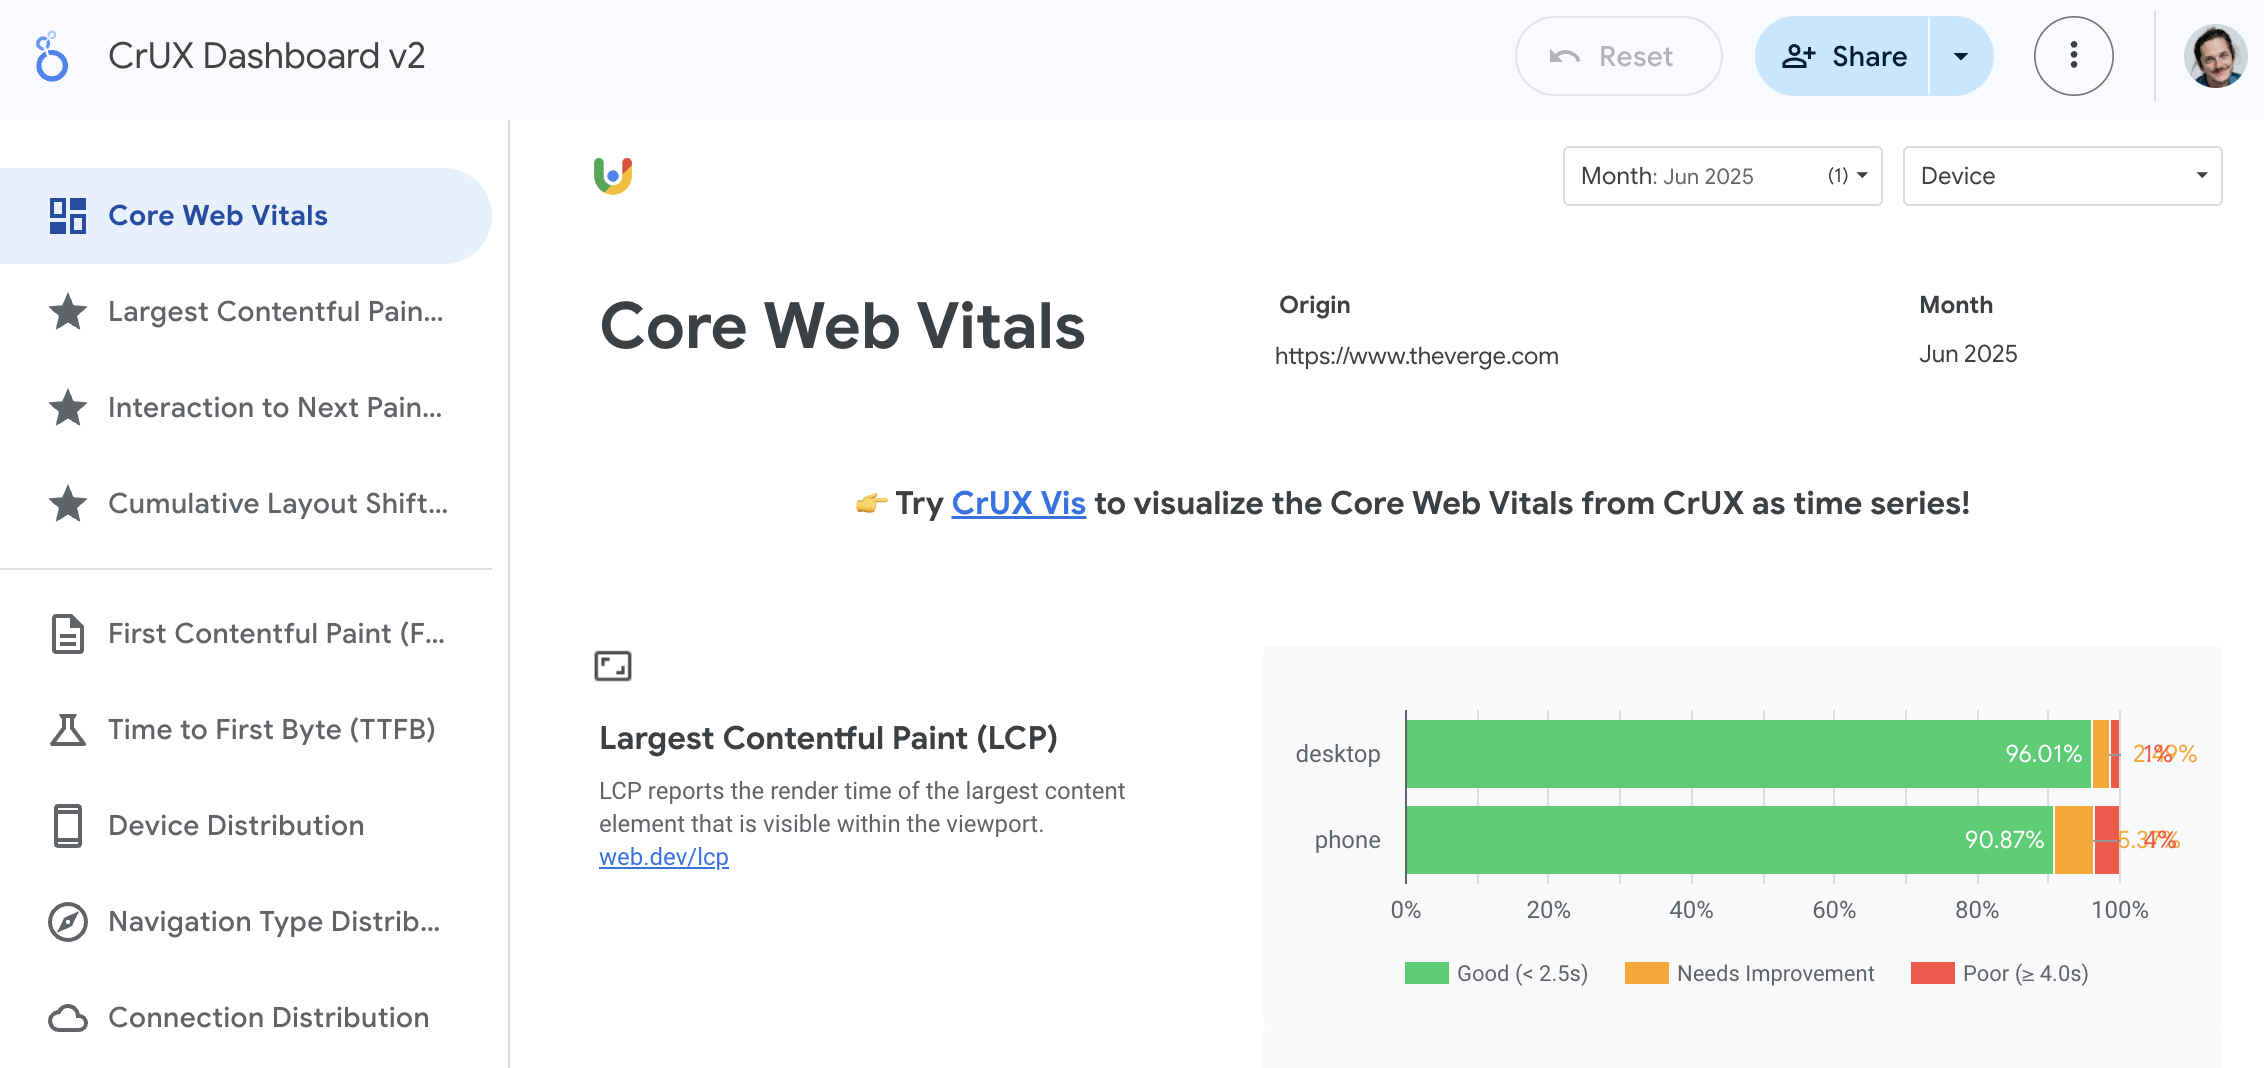
2. Google CrUX Dashboard
Google's free CrUX Dashboard is a Looker Studio dashboard that links to the field-tested, origin-level CrUX data on BigQuery, and then visualizes the data for you. That means you don't need to write any queries or generate any charts, and also reveals historic data, so you can track changes over time.
On the other hand, CrUX Dashboard only reveals CrUX data for entire domains rather than specific pages, and is only updated monthly.
Google has now deprecated the CrUX Dashboard. Check out what alternatives to Google's CrUX Dashboard are available.
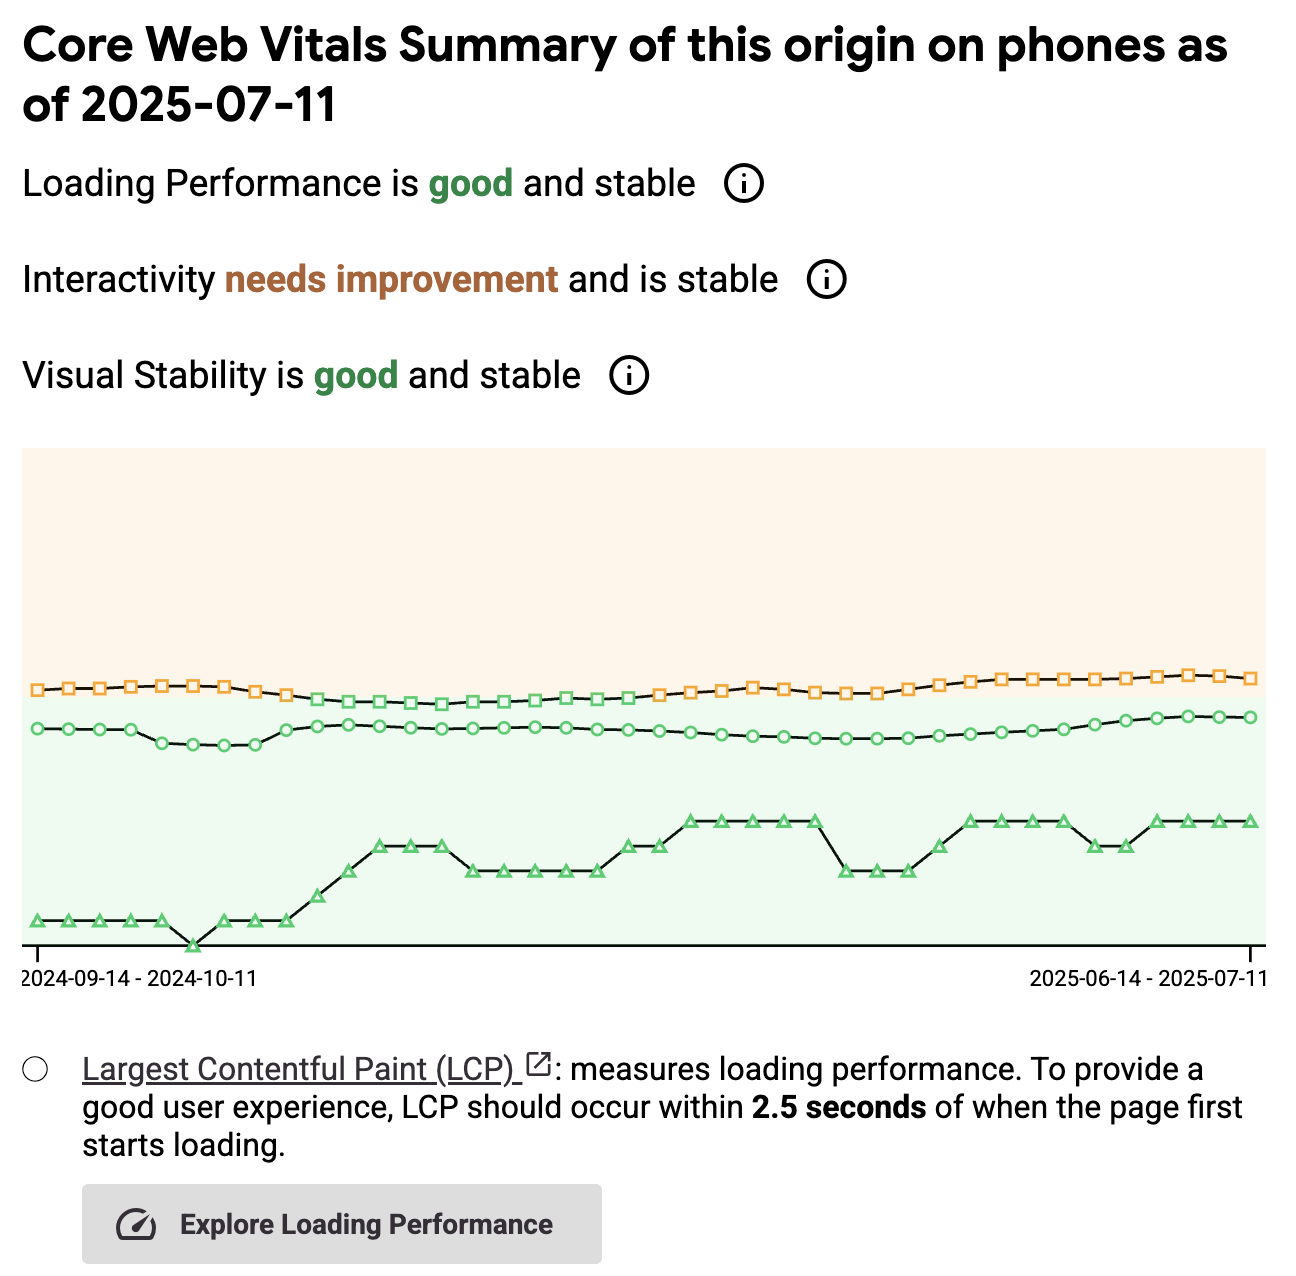
3. CrUX Vis
The new CrUX Vis tool from Google (which seems set to supersede the aforementioned CrUX dashboard) visualizes weekly historical data from the CrUX History API. Line graphs and to-the-point summaries make it even easier to see how your page speed performance is changing over time.
And unlike the CrUX Dashboard, CrUX Vis offers URL-level data on particular pages (where Google has enough data to provide it) rather than domain-level stats, so you can assess performance on a page-by-page basis. You'll only be able to get results for one URL at a time, however.
4. Google Search Console
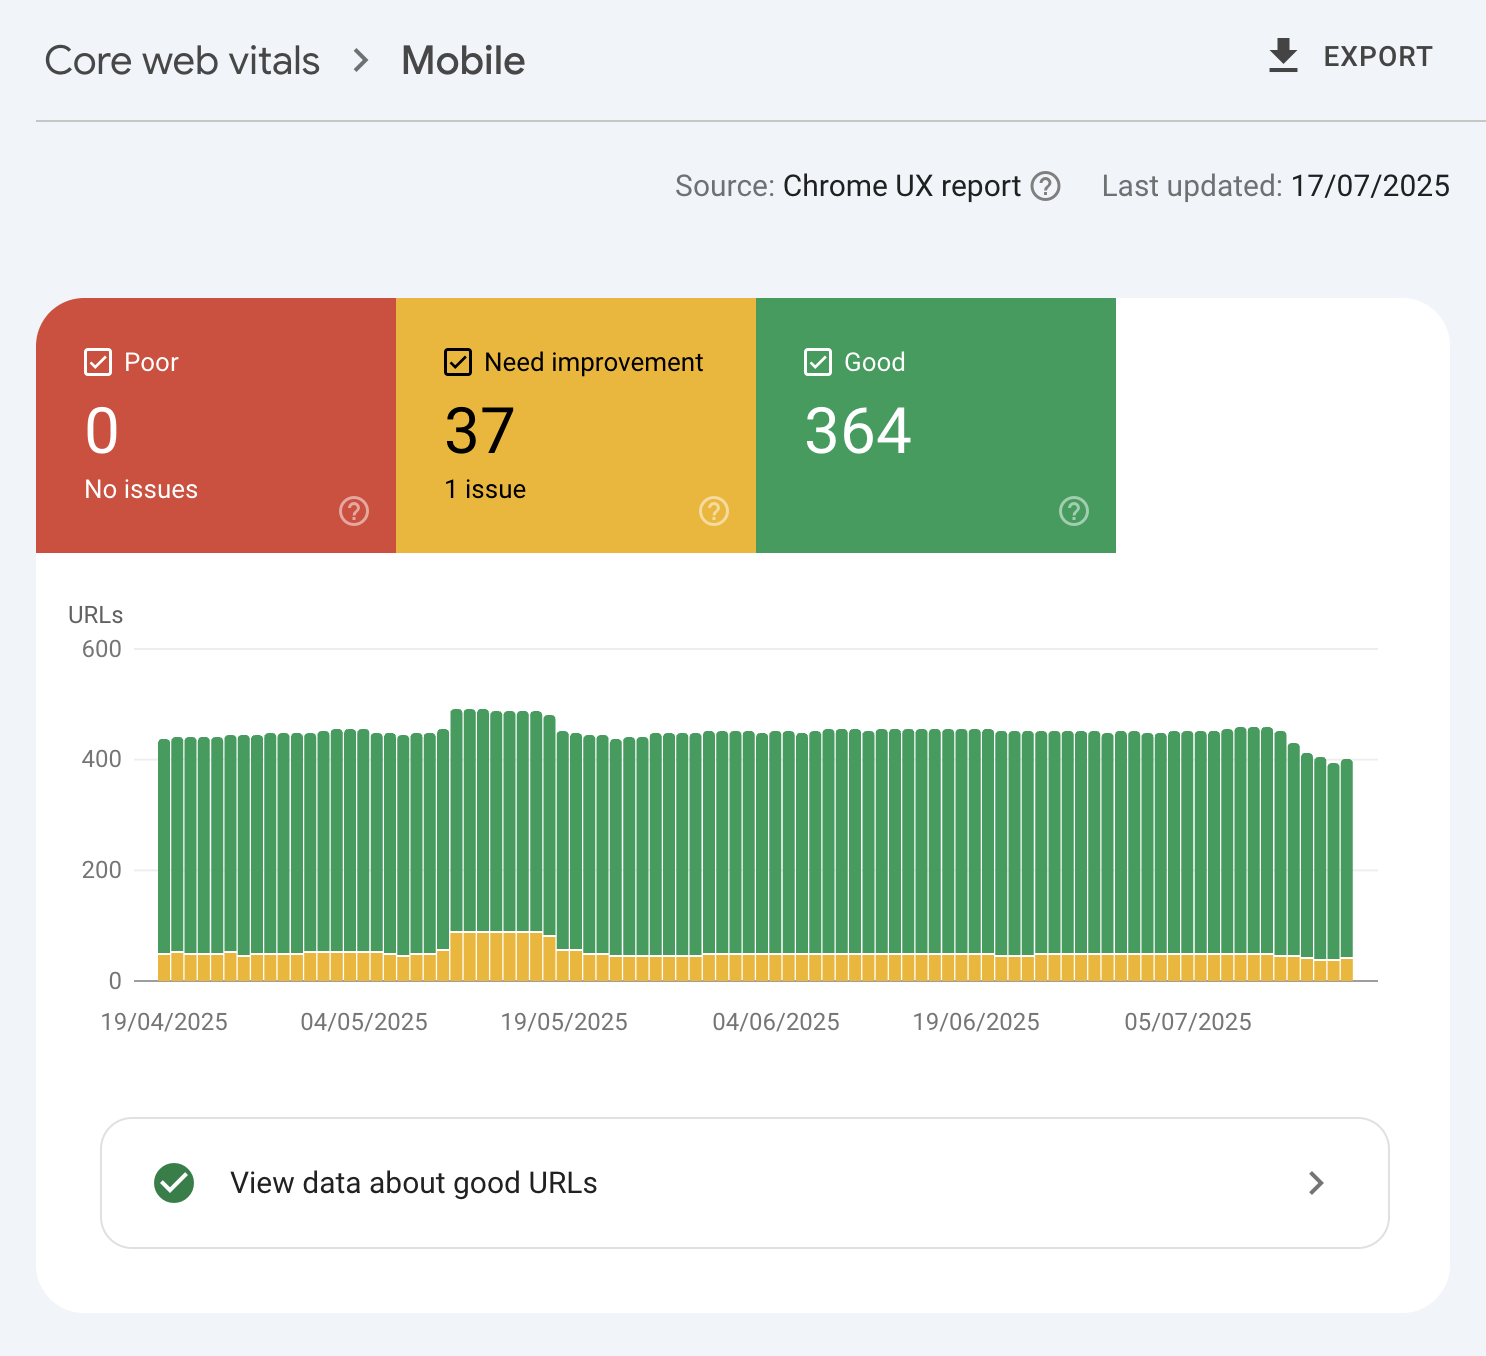
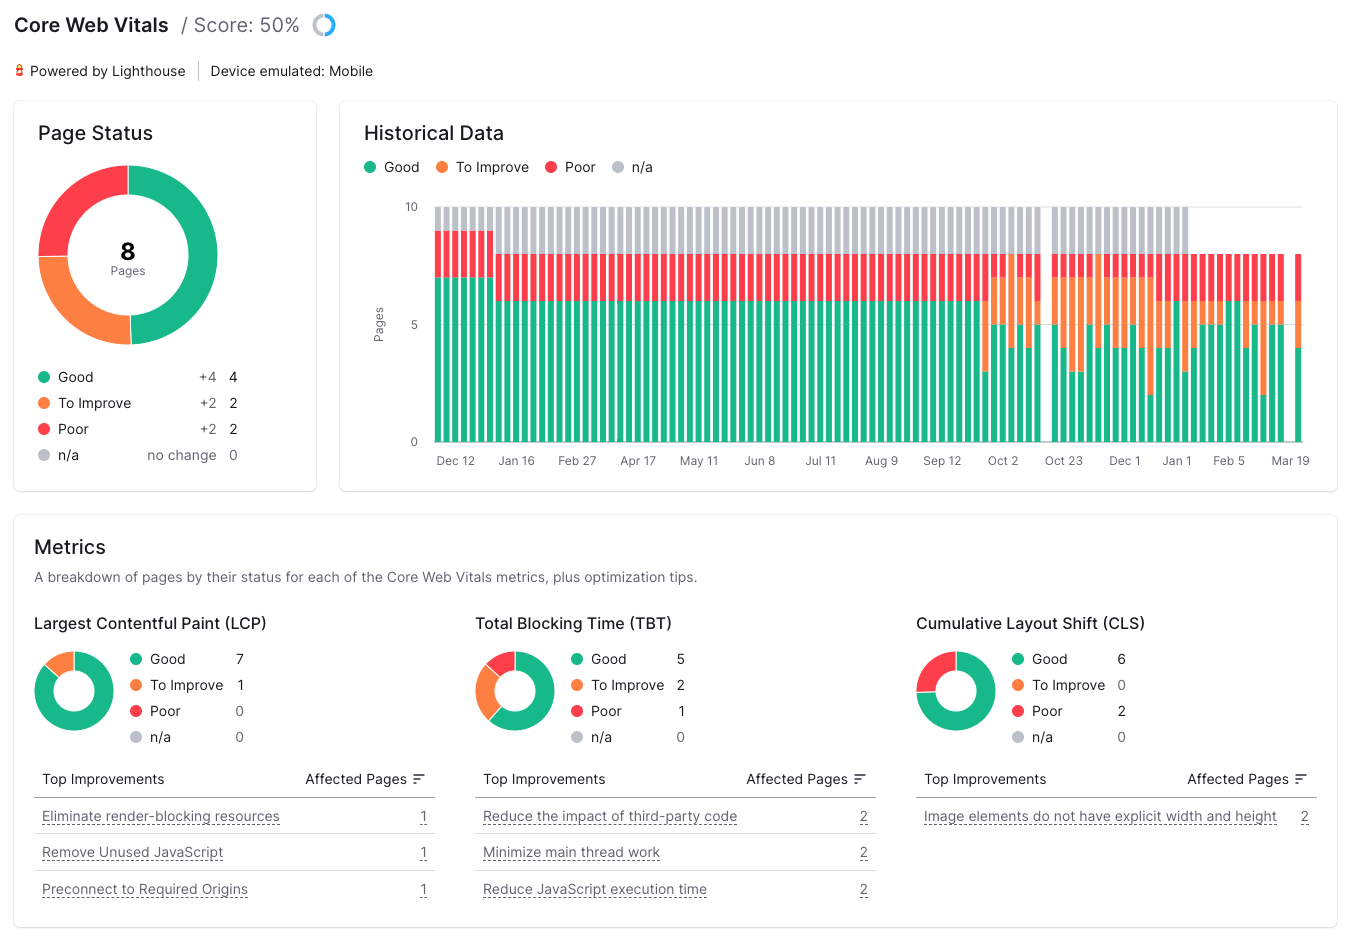
Google Search Console is a go-to tool for any SEO professional, and towards the bottom of the sidebar you'll find the Core Web Vitals feature.
Search Console's visualization is less about identifying granular scores for individual metrics like LCP, and more useful for identifying problems with large groups of pages. Search Console groups URLs into 'good', 'needs improvement' or 'poor', based on the real-world CrUX data set.
This view provides a clear at-a-glance warning if your site has entire page types that are currently being penalized in search, and why. See our guide to using Search Console effectively.
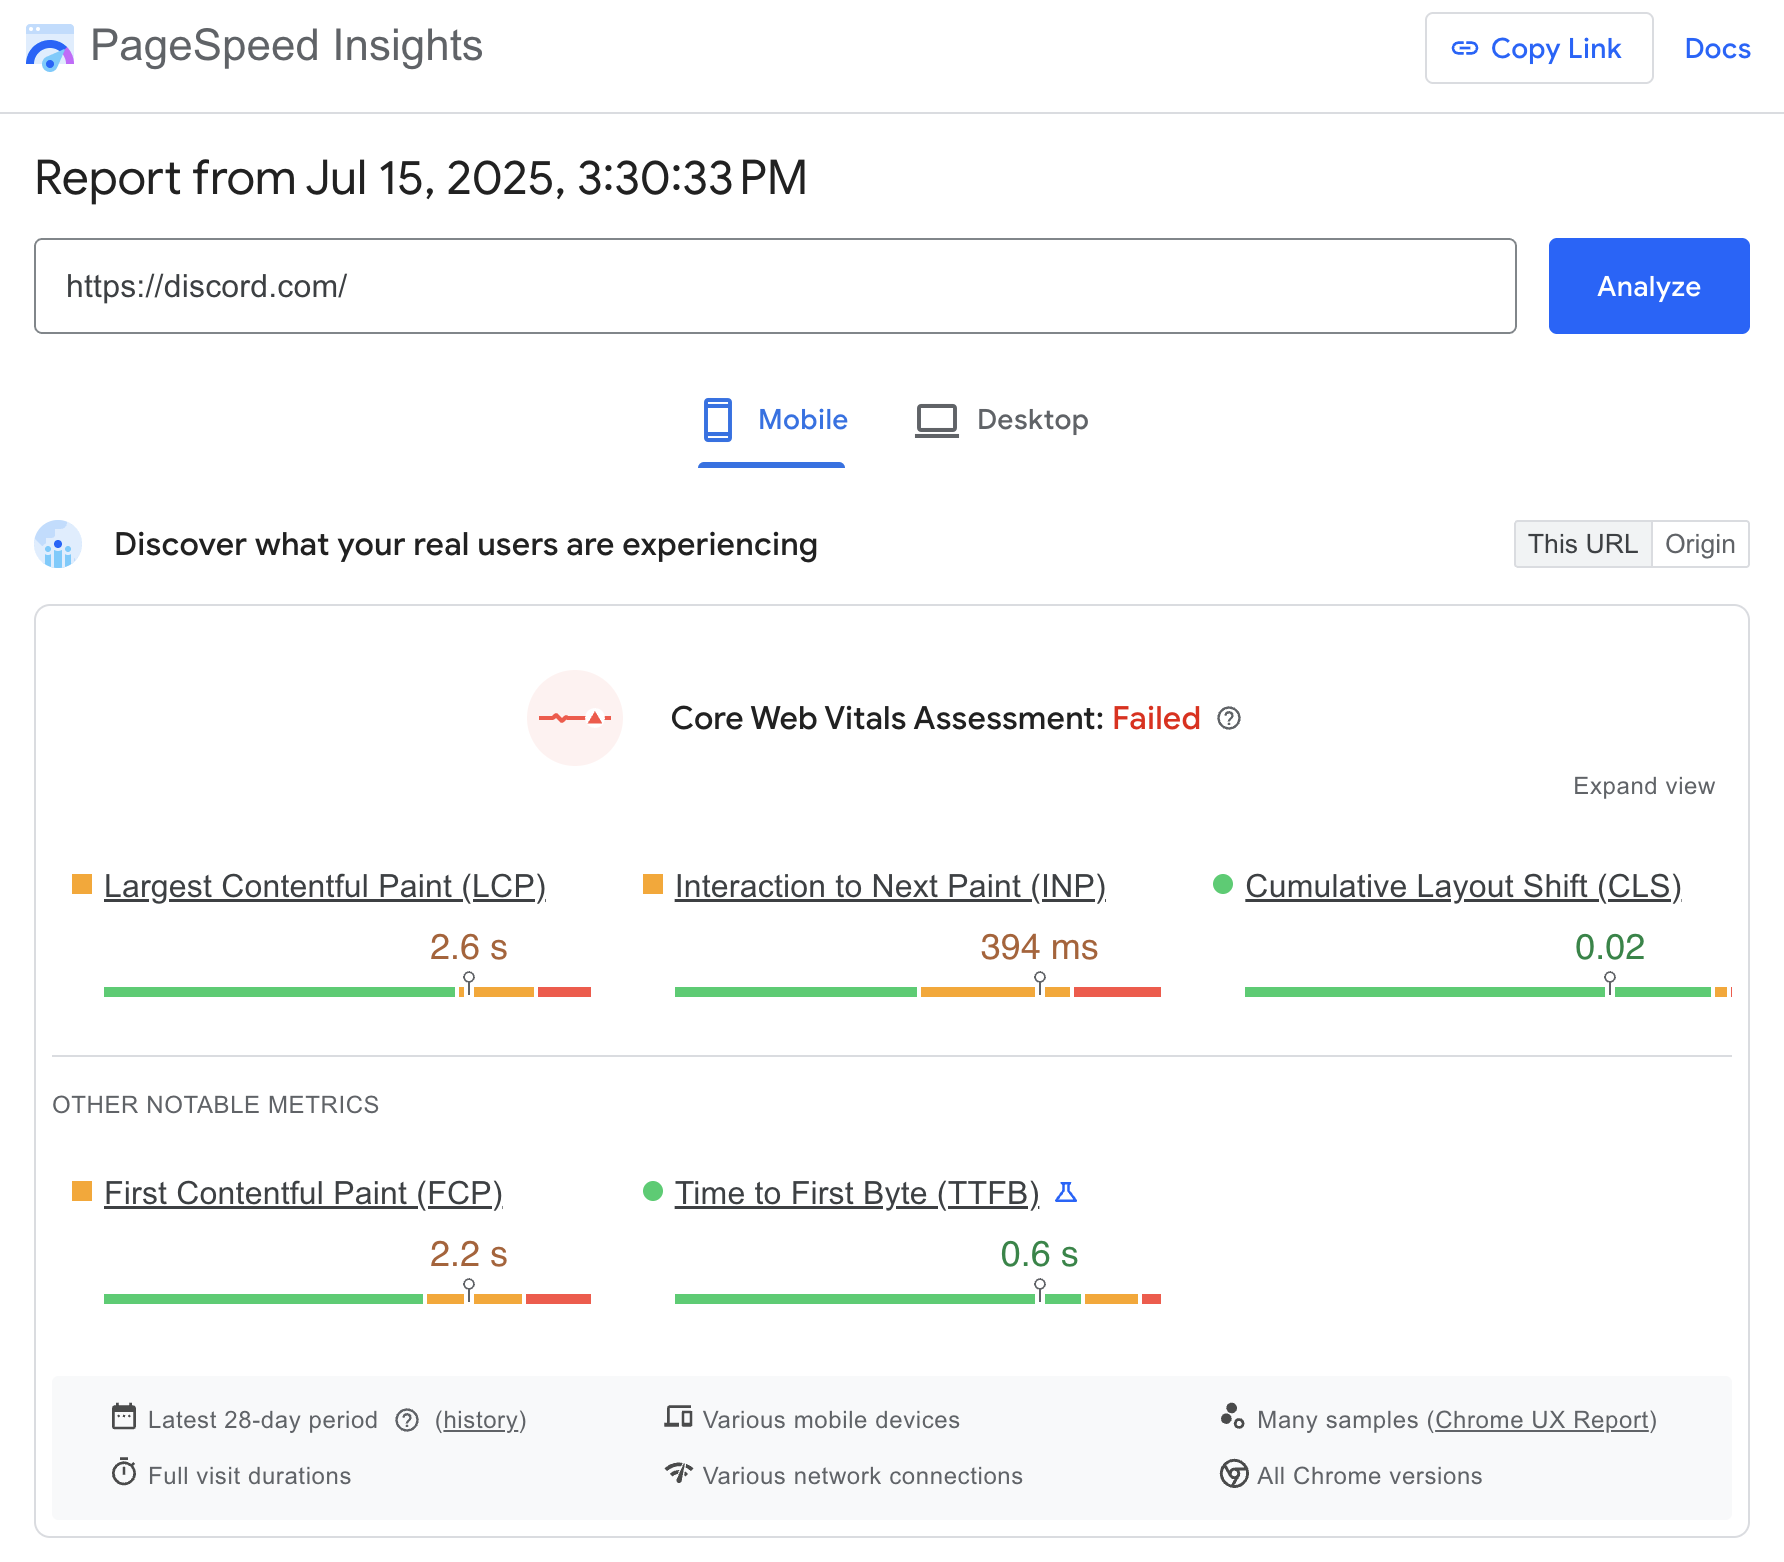
5. PageSpeed Insights
PageSpeed Insights is one of Google's most powerful free tools.
For any URL, it offers both field data from CrUX, combined with 'lab test' results revealing on-demand page speed statistics. Below that, you'll find the eponymous Insights: data-driven suggestions for how this page could be made faster.
However, PageSpeed Insights does not present changes in metrics over time: it's just a snapshot.
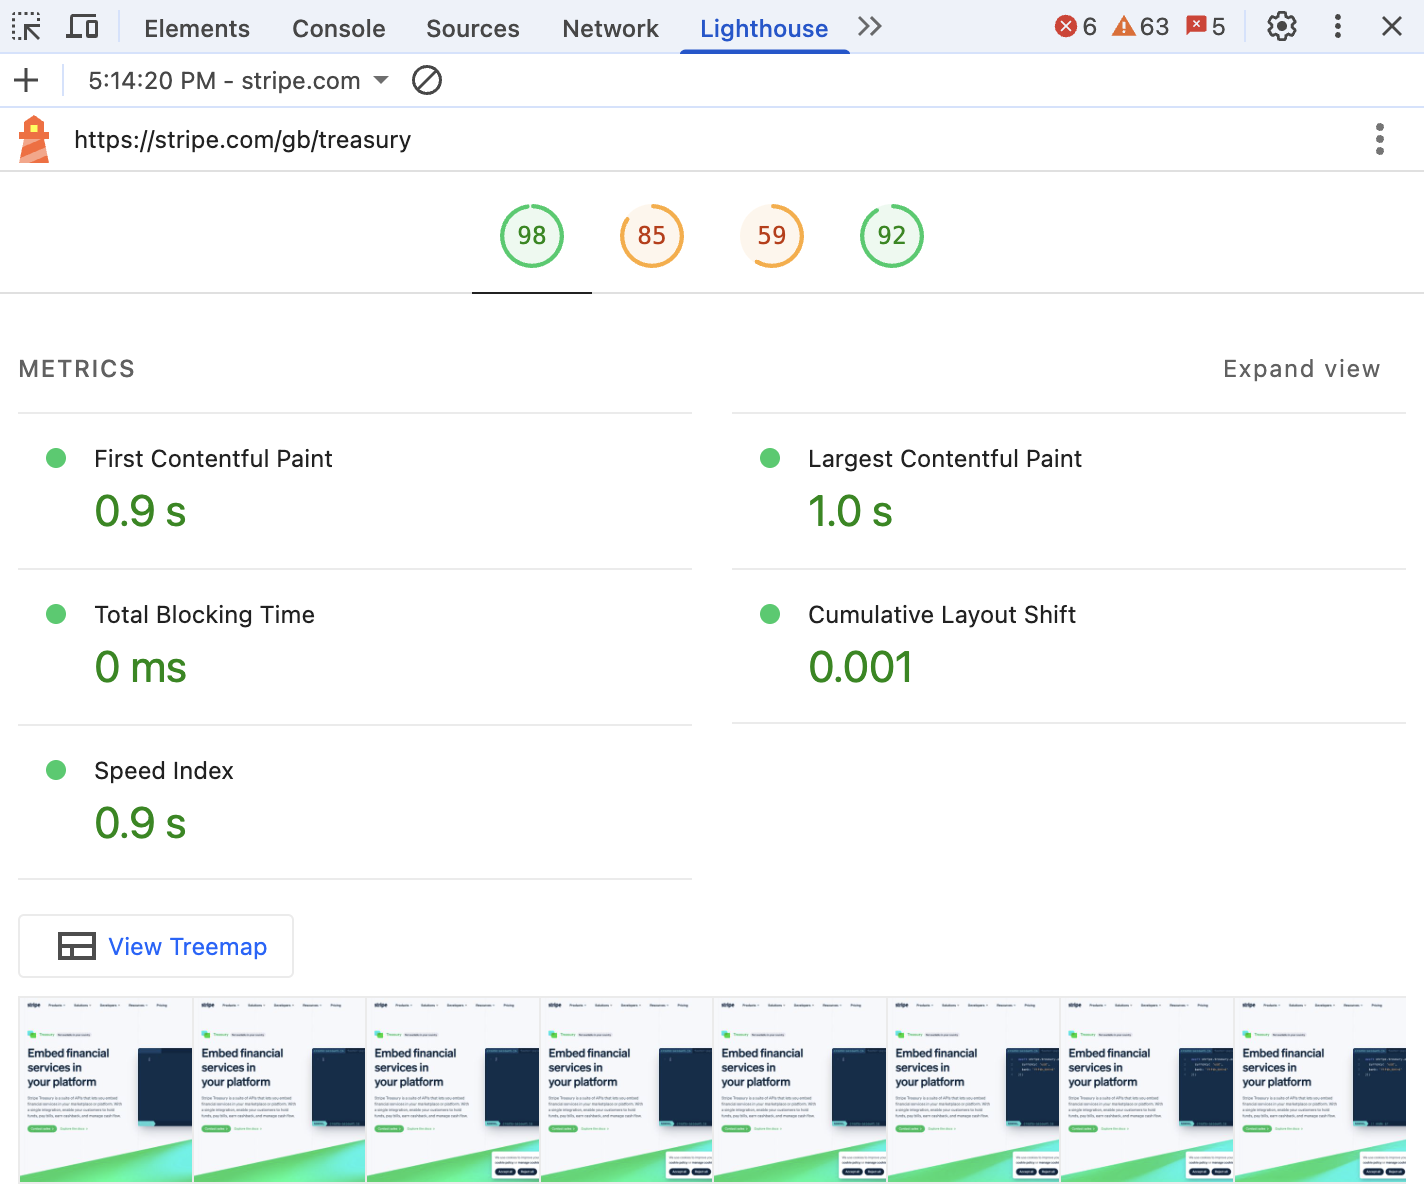
6. Chrome DevTools
If you're using Chrome, you needn't navigate to a site to run a Core Web Vitals test. Page speed testing is built right into the browser developer tools.
In the top menu, go to View → Developer → Developer Tools to reveal the DevTools pane, then check out the Performance or Lighthouse tabs to get information on the current URL's speed metrics.
You can even choose to simulate a desktop or mobile page load. Because these speed tests can be applied to any content visible in your browser, they'll work for private URLs, staging sites, and other pages not visible on the public web.
7. SEMrush
Many specialty SEO tools, such as SEMrush, also surface Google's CrUX data via their API. If you're a marketer, that allows you to view Core Web Vitals data in the tools you already use.
Ahrefs and Screaming Frog also include Core Web Vitals data in their website audits.
8. New Relic
Many comprehensive website observability platforms like New Relic provide dashboards that allow publishers to keep an eye on their site's Core Web Vitals.
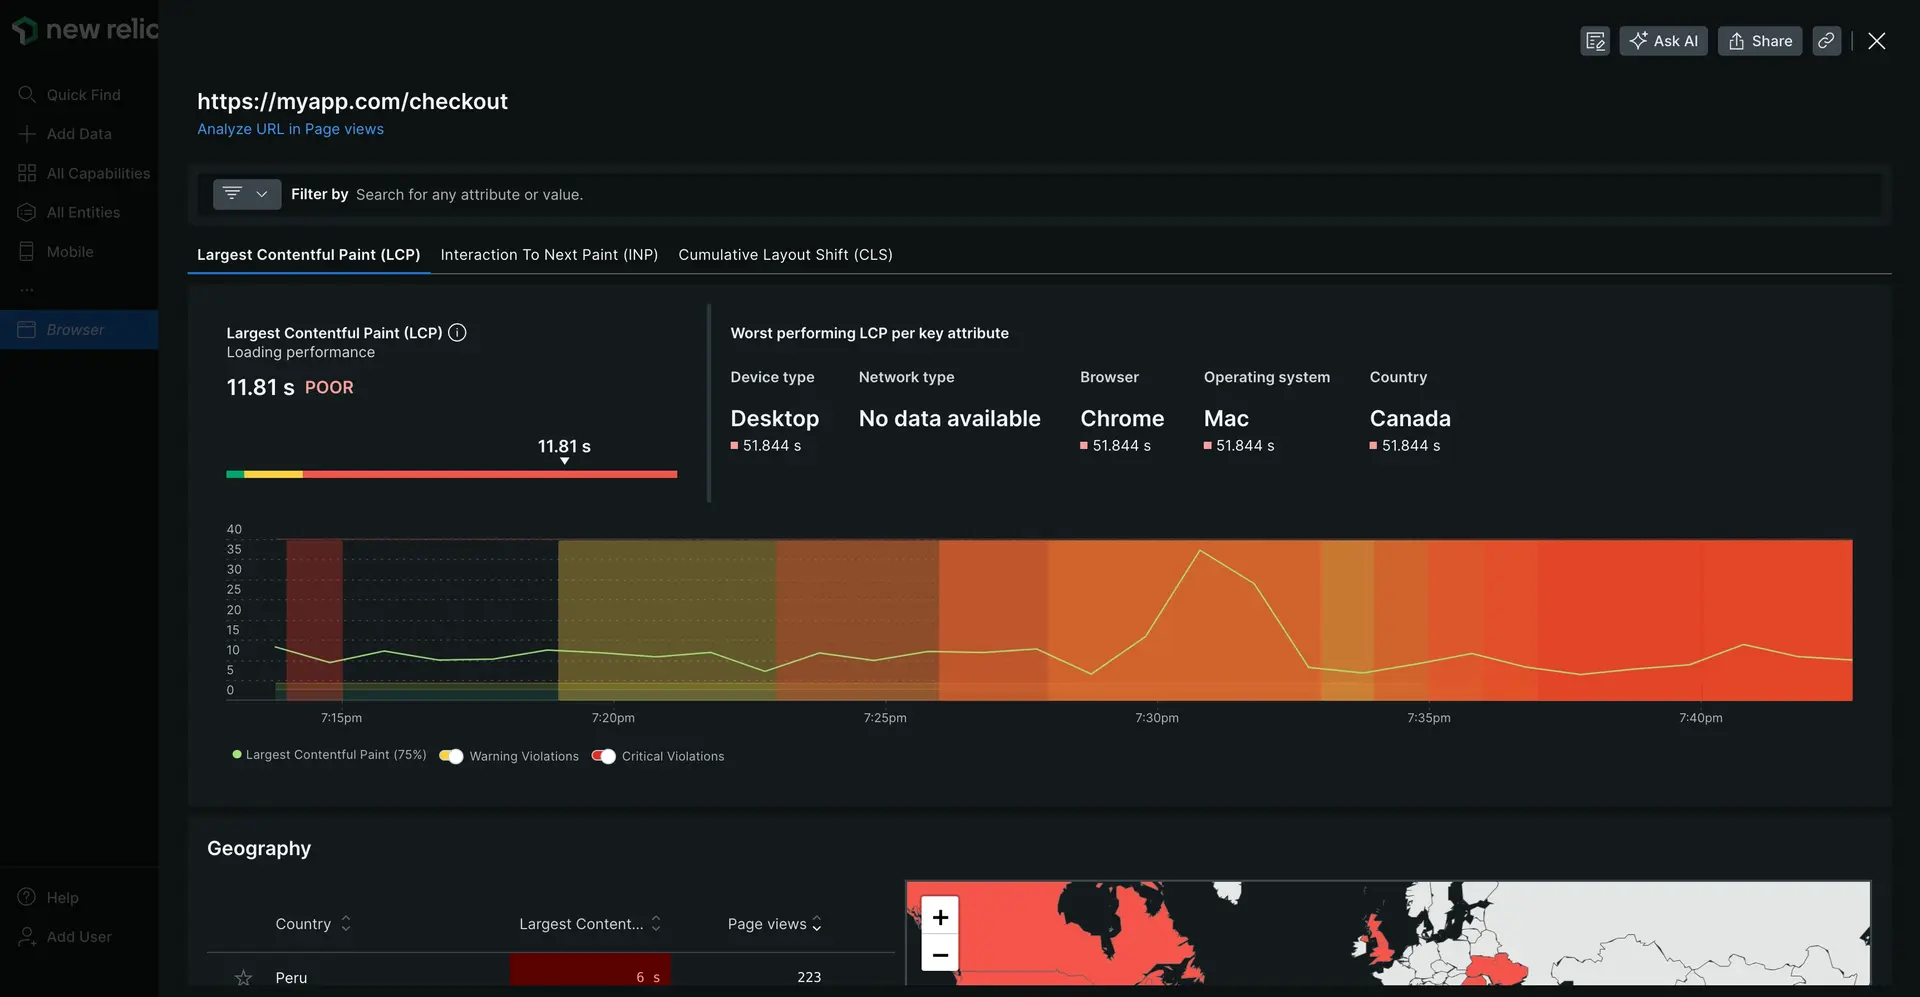
AppDynamics and Dynatrace are just a few of the platforms we found with CWV integration.
9. Sentry
Similarly, Core Web Vitals stats can sometimes be found in developer tools like Sentry that detect errors or downtime affecting your website or web app.
Conclusion
In short, there's no shortage of ways to examine your website's Core Web Vitals performance, including several free tools produced by Google themselves.
But if you want to:
- track your Core Web Vitals over time
- get results for dozens or even hundreds of specific URLs at once
- explore Google's official CrUX report scores
- run on-demand lab tests of pages as you optimize them
- benchmark your performance against competitors
- get alerts if your Core Web Vitals scores start dropping
- discover the Core Web Vitals results that real users are experiencing
...then try our comprehensive web performance monitoring tool, DebugBear.