
GTmetrix provides a free page speed testing tool to check your website performance.
Find out how the GTmetrix website speed test works, how to interpret its performance recommendations, and what other tools you can use to test your website speed.
What is GTmetrix?
GTmetrix is a page speed testing and monitoring tool, similar to PageSpeed Insights, WebPageTest, or DebugBear.
The performance test tells you how fast your website is and how you can optimize it. By setting up continuous monitoring you can get alerted to performance regressions, so that you can fix issues before too many of your customers are impacted.
How to test website speed with GTmetrix
Follow these steps to test your website with GTmetrix:
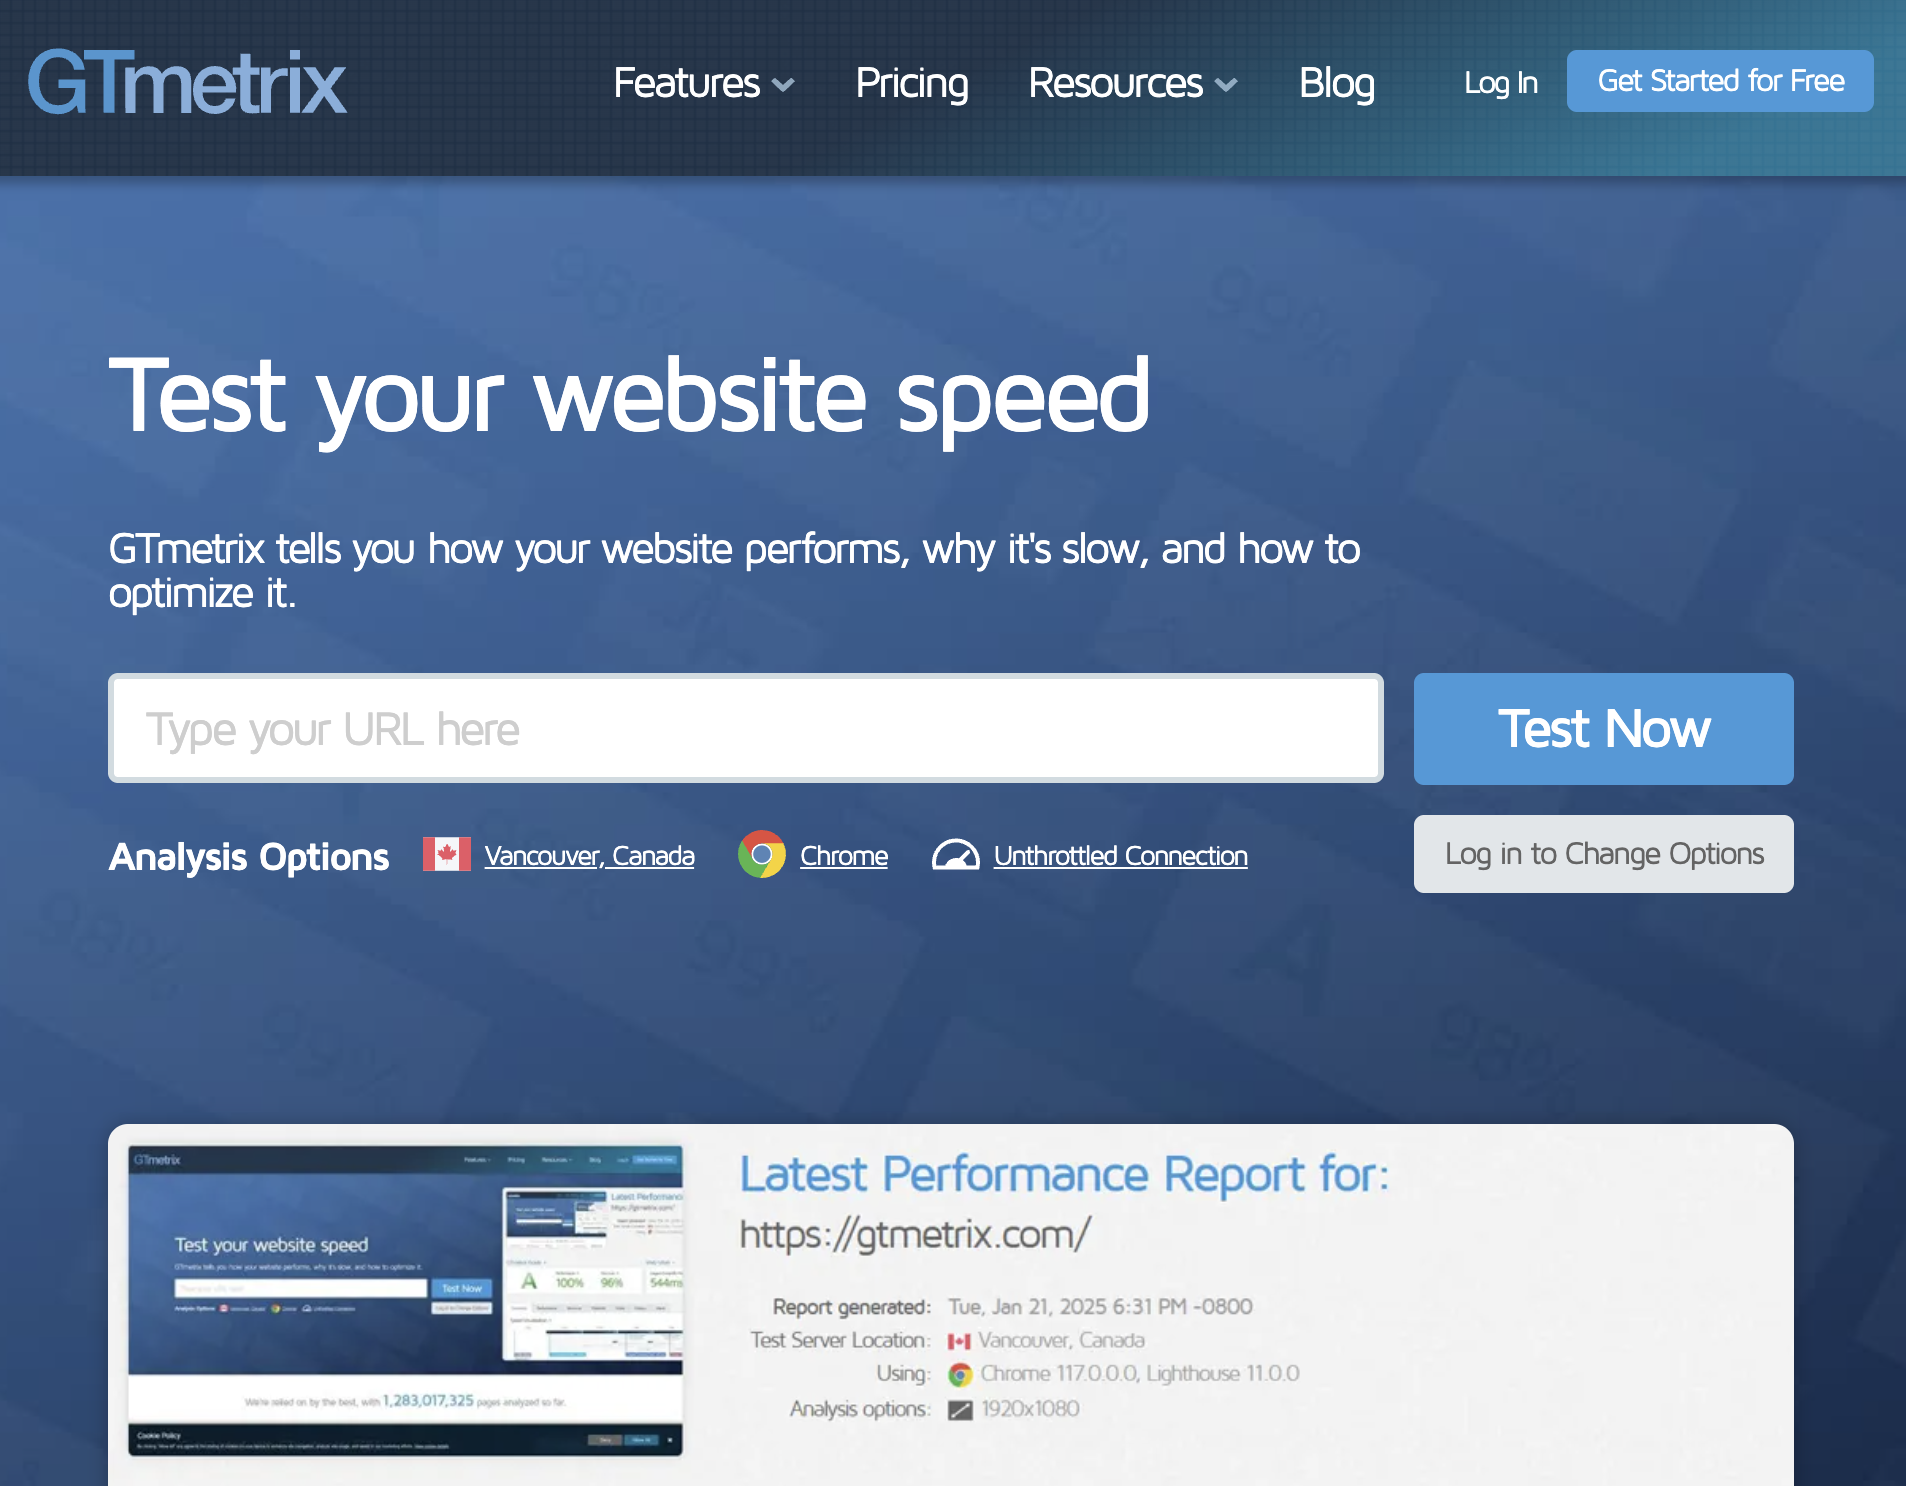
- Go to gtmetrix.com
- Enter your website URL
- Click Test Now
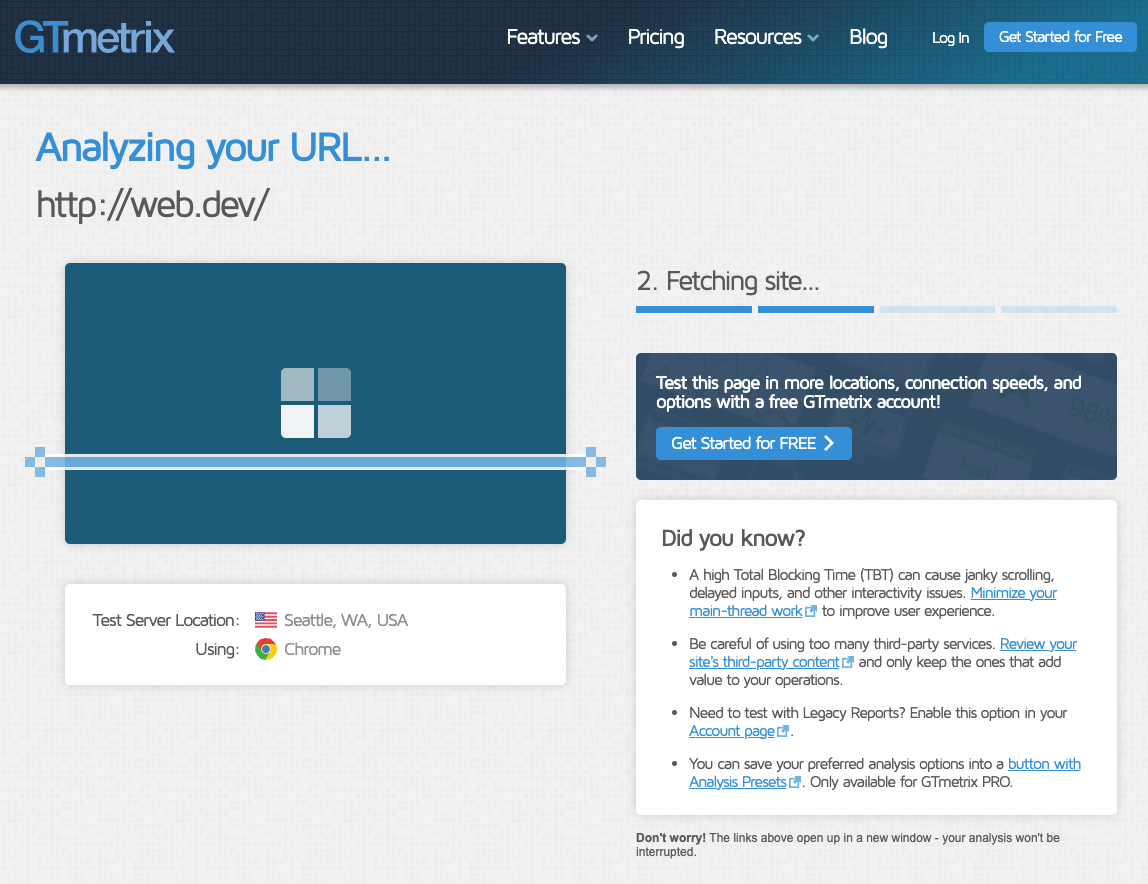
GTmetrix will open your website in Chrome, collect performance metrics, and scan for potential improvements.
While the test is in progress GTmetrix shows a loading screen confirming it's analyzing the URL you requested.
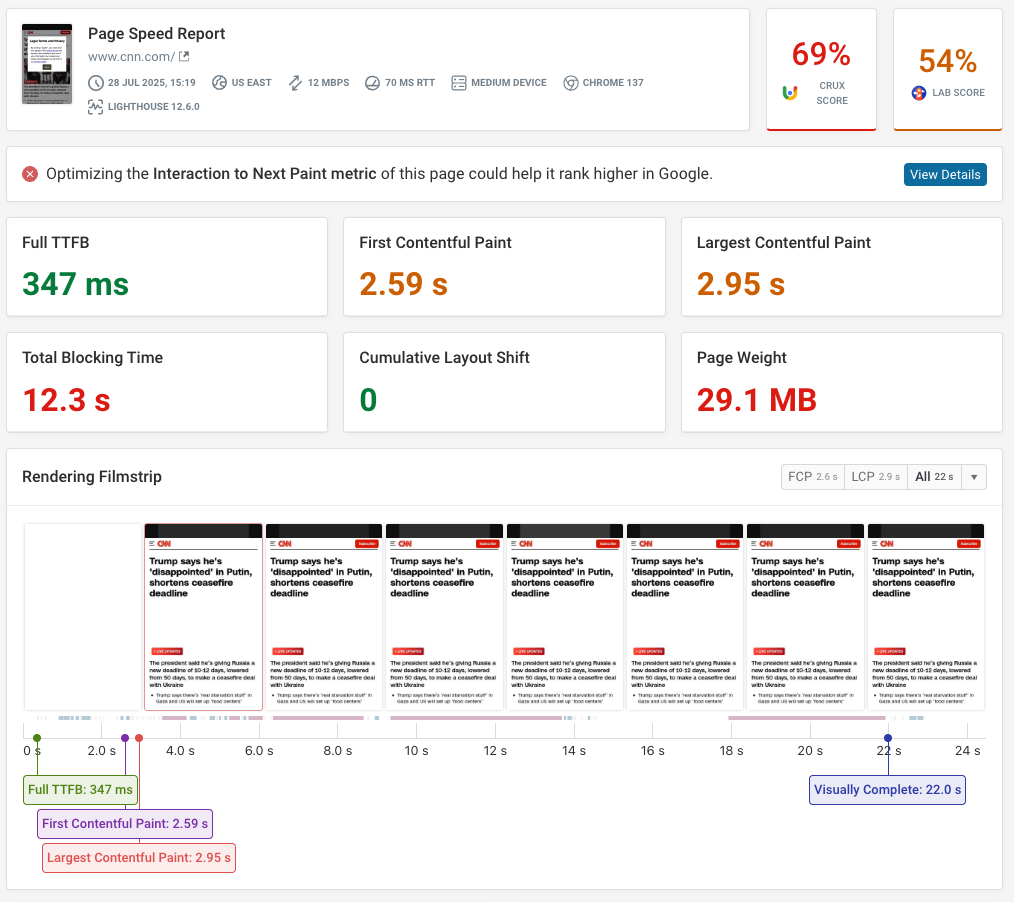
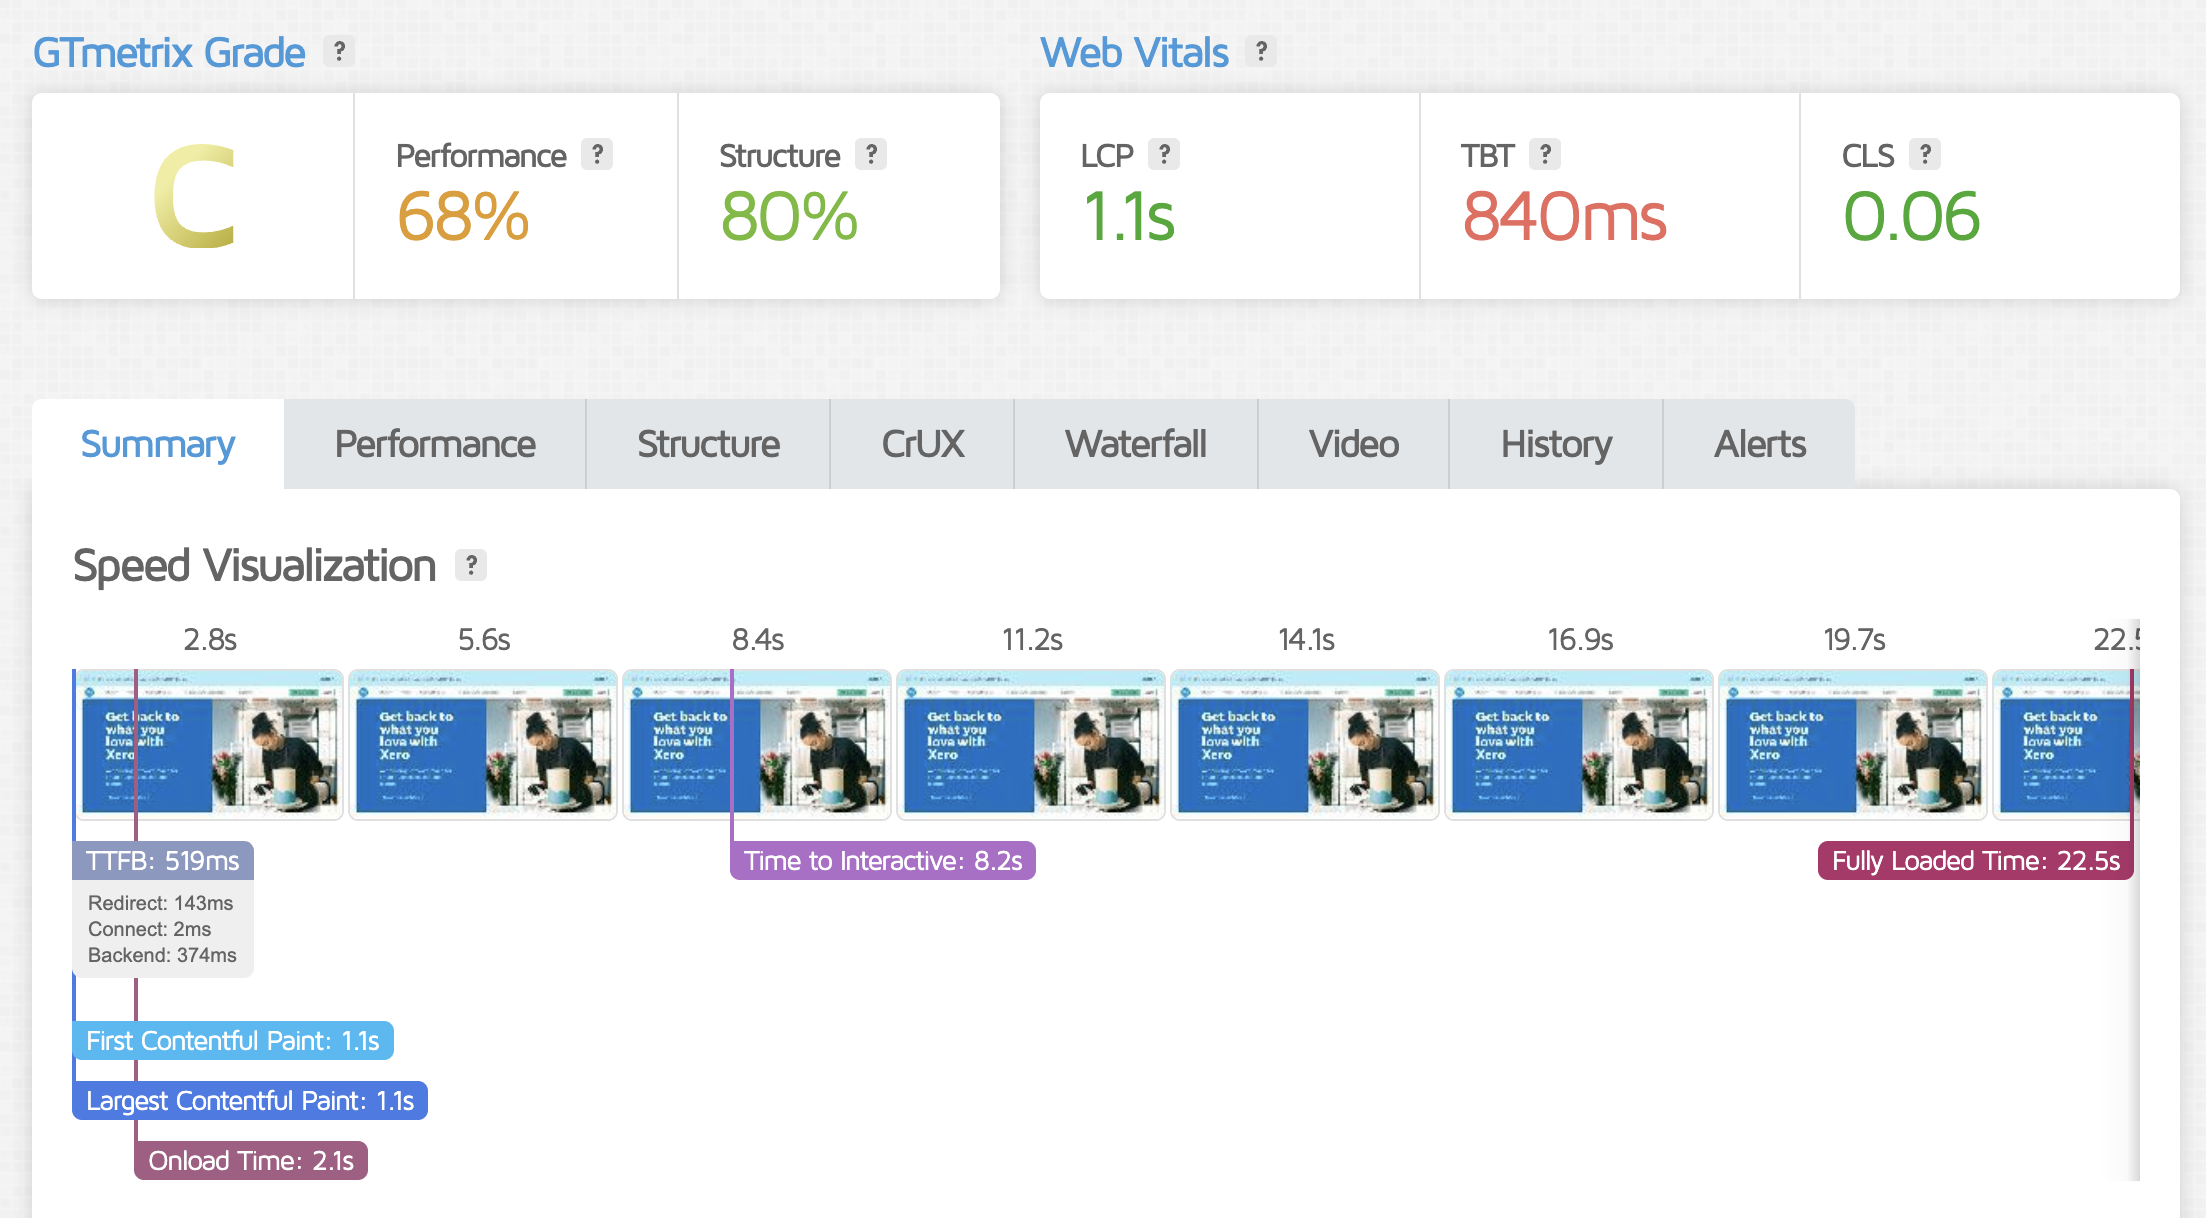
Once the test is complete, GTmetrix provides the following details at the top of the report:
- An overall letter-based GTmetrix grade
- The Lighthouse performance score
- A Structure score
- Your Core Web Vitals metrics
- LCP: Largest Contentful Paint
- TBT: Total Blocking Time
- CLS: Cumulative Layout Shift

Altogether, this doesn't tell us too much. To get details on how to improve our website speed we need to create a free account to get more information.
When we signed up for an account, we discovered that we needed to run the test a second time after logging in.
Don't want to sign up for GTmetrix? DebugBear's free speed test gives you all the results you need without requiring an email address.
What is an unthrottled connection?
By default, GTmetrix tests pages in a Chrome browser on an unthrottled connection. That means the network will be very low latency and high-bandwidth, since the test is run from a cloud data center.
In contrast, real visitors may be on a slow connection, especially if they are accessing your website from a mobile device. That's why most page speed tests are run with a throttled connection to get more realistic data.
If you compare test results from an unthrottled connection to real user data or throttled results from tools like PageSpeed Insights you'll see much better scores for the fast connection.

Running a full test once logged-in
You can run up to five tests before you need to pay. Once logged-in, you can adjust some of the options (although not as many as paid users can) such as server location, network speed, and whether you want video or ads enabled or disabled.
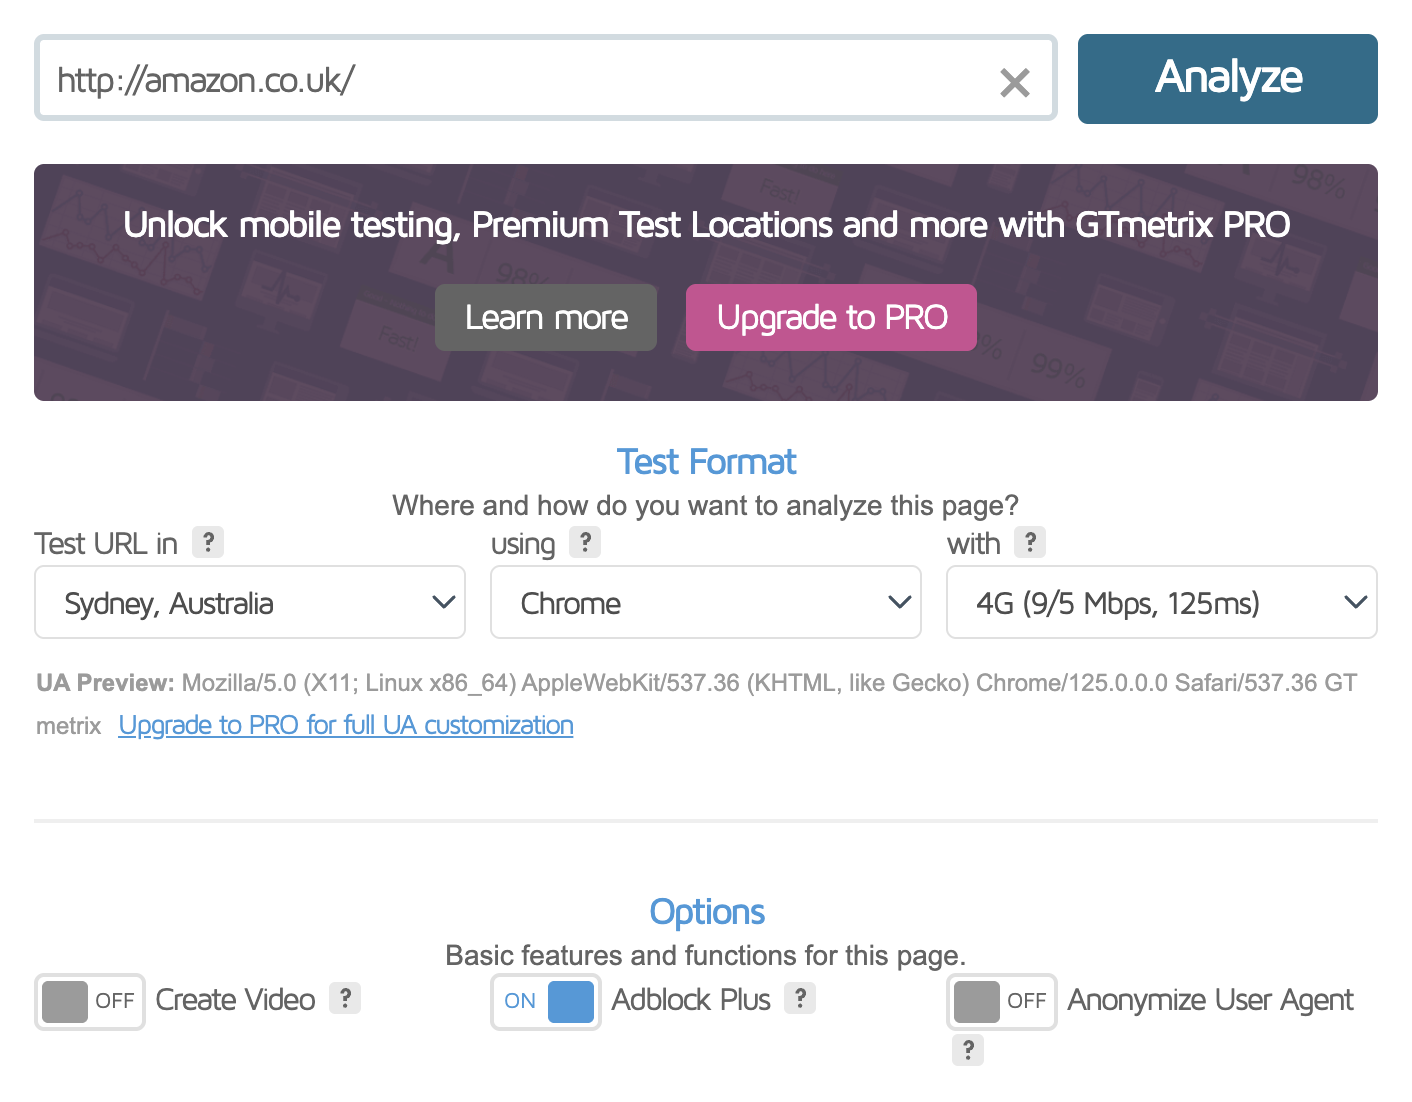
Choosing a server nearer where your audience tends to connect from may give you a more realistic result.
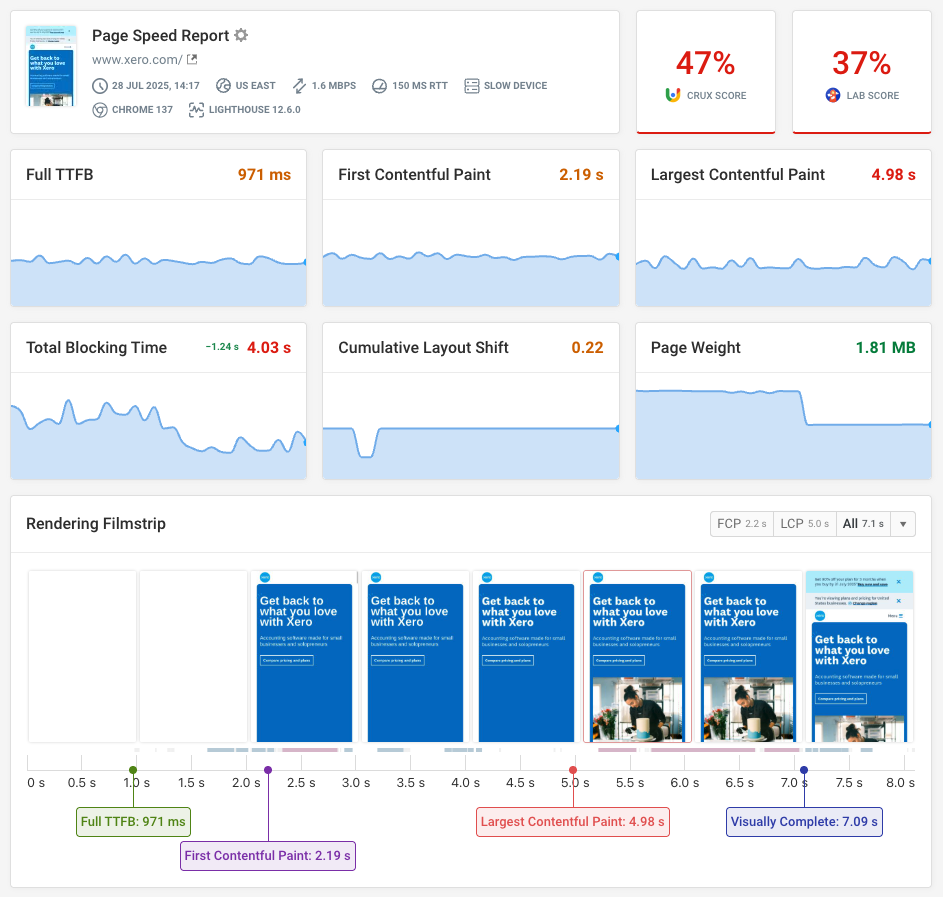
How to interpret the full GTmetrix test results
Once this test has run, you'll receive a more substantive report with actionable advice.
Beneath your headline speed stats, you'll see a filmstrip showing how your page loaded step-by-step.
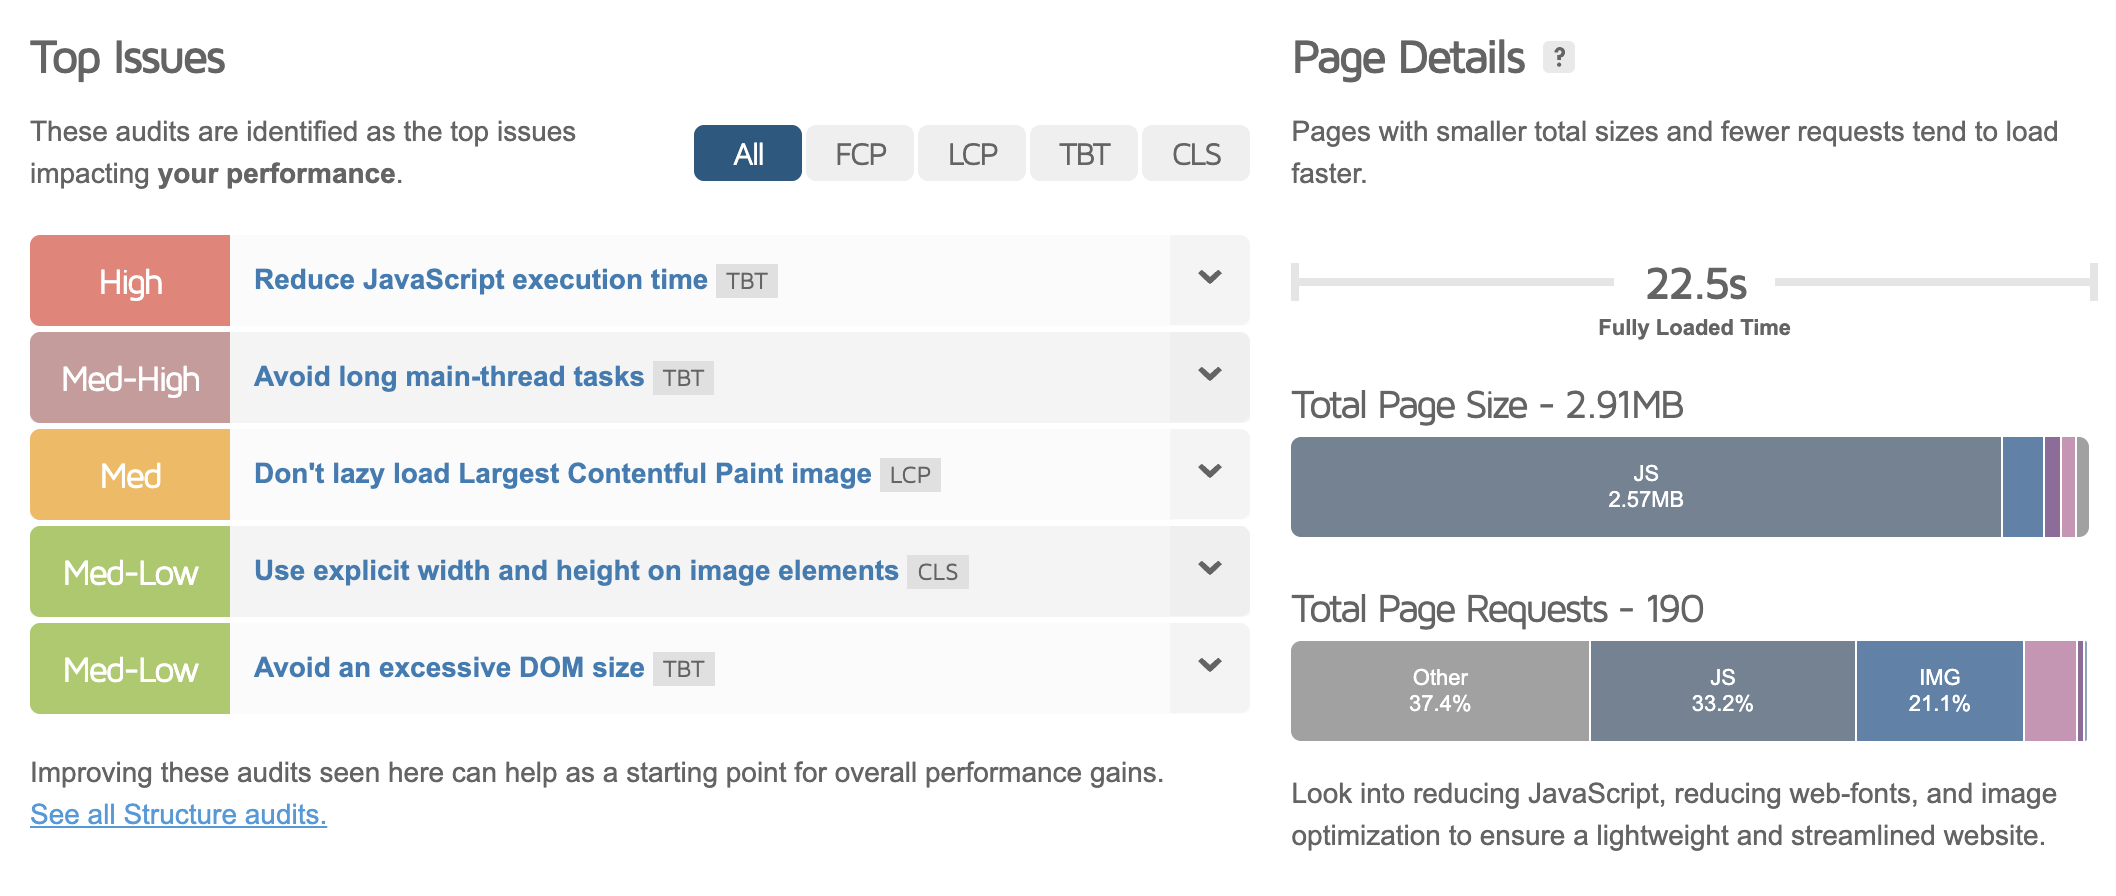
Below that, you'll also discover a set of advisory notices – the Lighthouse recommendations you might recognize from PageSpeed Insights.
On the right, a graph gives you an overview of your page size and the number of server requests being made.
In this example we can see that JavaScript files account for 2.57 megabytes of download size. That suggests that optimizing this code to be smaller and take less time to run can make this website load faster.
Google is working on replacing the traditional Lighthouse performance audits with the new insights audits that are shared between Lighthouse and Chrome DevTools.
But that's not all – you can explore the tabs along the top of the page to reveal further information.
- Performance reveals 17 page speed metrics, from Time to First Byte to Fully Loaded Time.
- Structure presents even more page speed recommendations, in priority order.
- CrUX shows the latest information on this URL from Google's CrUX dataset
- Waterfall depicts a detailed chronological breakdown of every single page resource and request
- Video (if you enabled it) presents a slowed-down visualisation of your page loading
- History provides comparative data (if you've tested this URL before)
- Alerts allows you to set up monitoring and get notifications if page speed declines
Performance metrics
This part of the GTmetrix report shows you how your website scores on a number of web performance metrics.
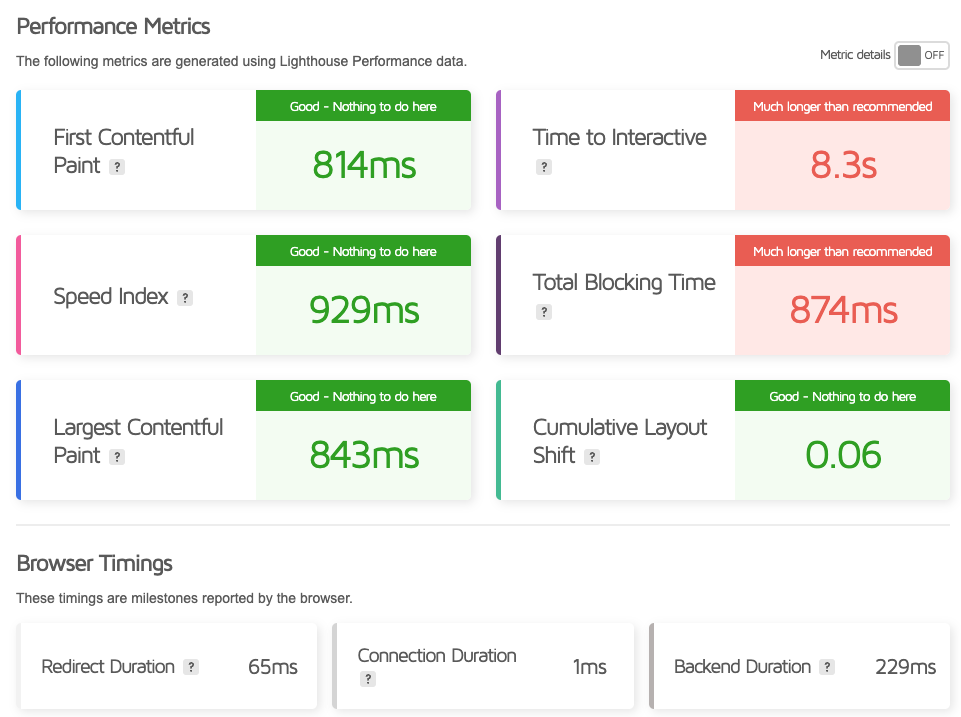
Toggle the Metric details option to view an explanation of how each metric is collected:
- First Contentful Paint: measures when the first text or image appears on the page
- Speed Index: measures how quickly content is visually displayed during page load
- Largest Contentful Paint: measures when the largest text or image becomes visible
- Time to Interactive: measures when the CPU and network become idle
- Total Blocking Time: measures the total amount of time the main thread is blocked from responding to user input
- Cumulative Layout Shift: measures visual stability by quantifying unexpected layout shifts during page load
Request waterfall
The request waterfall tells you when the browser loads different page resources during the loading process.
Loading a website always starts by loading an HTML document which then references stylesheets, JavaScript files, web fonts, and other resources that are necessary to display page content.
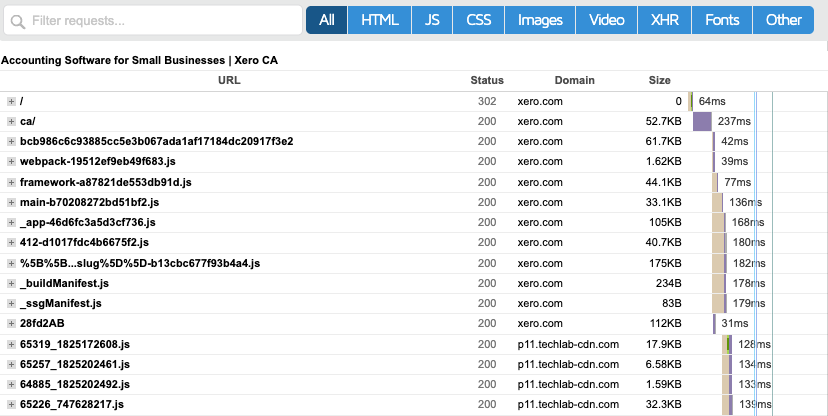
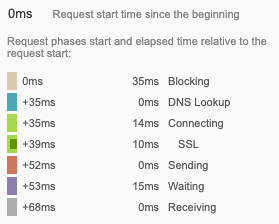
You can hover over each request bar to see a more detailed breakdown of the request duration:
- An HTTP server connection is created (DNS / Connecting / SSL)
- The resource request is sent and processed by the server (Sending / Waiting, measuring the Time to First Byte)
- Receiving, which means downloading the full response body
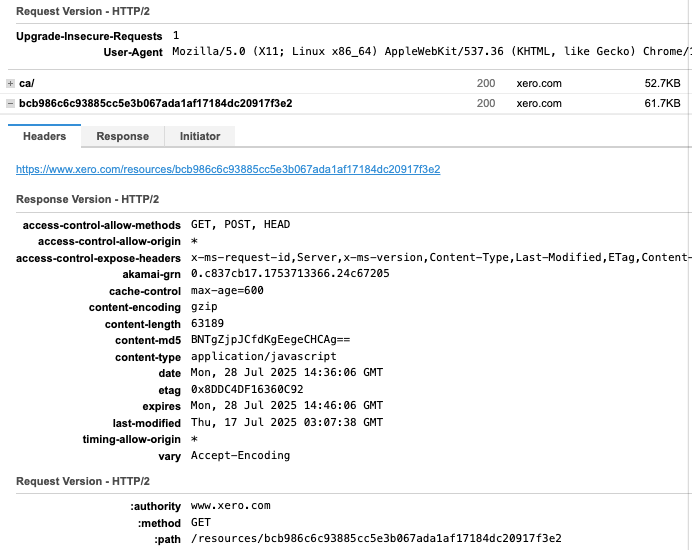
Click on a request to expand it and view details like the HTTP request and response headers.
content-encodingtells you whether HTTP compression with Brotli or GZIP was applied by the servercache-controlandexpirestell you how long the resource can be stored in the browser cache
The DebugBear request waterfall provides additional insights to help you better understand how each resource impacts page speed.
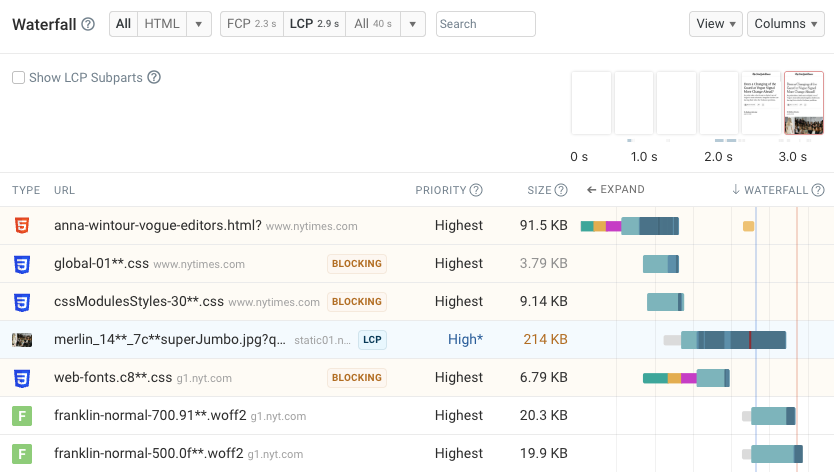
Analyzing the GTmetrix request waterfall chart: an example
So how do you read the waterfall chart in practice, and what does it tell you about optimizations? Let's check out an example.
In the waterfall below we can see that the page load process starts with two requests for the root path on the website. If we look more closely we can see that the initial URL uses the HTTP protocol, and the server responds with a redirect to the same page loaded over the encrypted HTTPs protocol.
Where possible, avoid redirects by linking directly to the final URL, as each redirect contributes to your overall load time.
Once the HTML code starts loading, we can see that Chrome requests a number of other resources. Most importantly there are 5 different CSS files. Stylesheets are usually render-blocking, which means no page content can show up until after these files have loaded. Optimize these files so the browser discovers them early and make sure they aren't too large so they can be downloaded quickly.
In addition to loading the stylesheets, the browser also loads images, including home-blue_720.png. This image is responsible for the largest paint on the website, so loading it quickly matters for visitor experience. Luckily, it's loaded from the same domain as the document, so no new server connection is required to download it. The image is also optimized and only 26 kilobytes large.
Once render-blocking resources are loaded the page can start to render. There's usually a bit of a delay between the end of the last CSS file and when page content actually shows up. That's because the CPU rendering work takes a few hundred milliseconds or so, depending on the complexity of the page content.

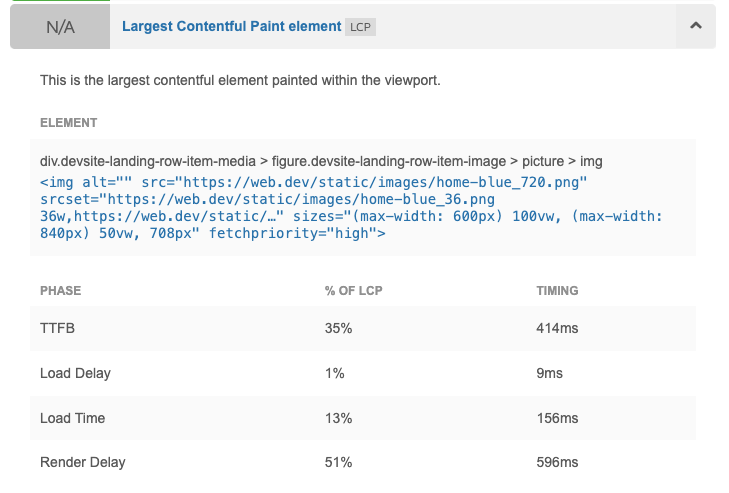
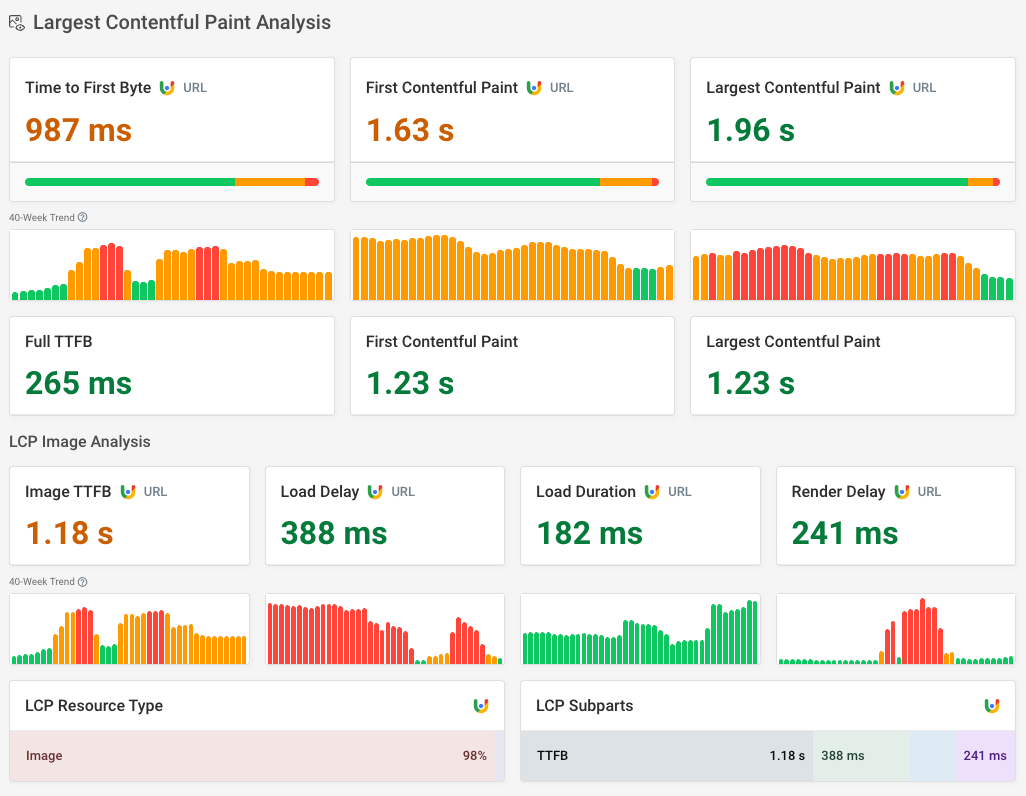
For more information on what's delaying the LCP rendering milestone, go into the Structure tab and look for the Largest Contentful Paint element audit. This audit tells you what element is responsible for the largest paint, and breaks down the LCP score into four components:
- Time to First Byte: server response time for the HTML document
- Load Delay: time spent before the browser discovers the LCP image
- Load Time: time spent downloading the LCP image
- Render Delay: how soon after being downloaded the image became visible
In this case we can see that the image loads quickly, but there is then a large render delay component. That means the render-blocking CSS stylesheets finish loading after the LCP image, causing the delay.
GTmetrix test recommendations
GTmetrix draws upon insights from Lighthouse, as well as a few of their own, to help you improve your page load speed.
Here's what the recommendations are and how they can help your website speed. We have articles on many of these common website speed audit insights that walk you through the changes you need to make.
Allow back/forward cache restoration
This ensures the page doesn't unnecessarily re-download content when the user visits by hitting the back button in their browser. Learn more about back/forward cache restoration.
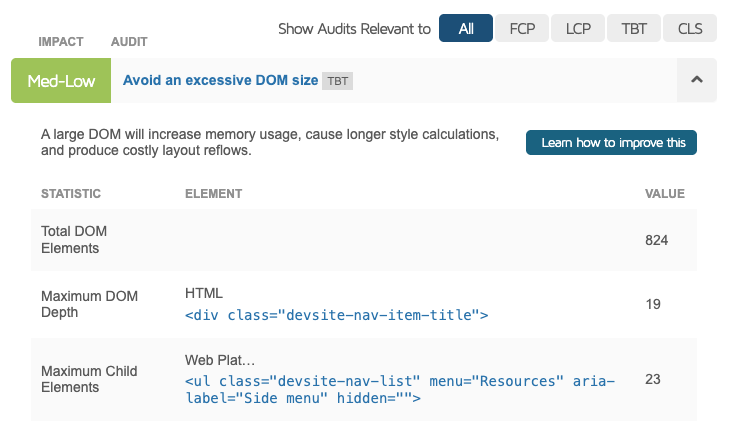
Avoid an excessive DOM size
Reducing the complexity of the page structure helps the browser render it faster. Find out how to avoid an excessive DOM size.
Avoid chaining critical requests
Simplifying the network dependency tree allows important files to be downloaded faster. Learn how to avoid chaining critical requests.
Avoid CSS @import
Loading CSS directly from the HTML improves page load times. Discover why you should avoid CSS @import.
DebugBear can visualize request chains as part of the waterfall. Here you can see one render-blocking CSS file triggering another stylesheet download that also blocks rendering.

Avoid document.write
This can delay the display of page content by tens of seconds and is particularly problematic for users on slow connections. Learn more about avoiding document.write.
Avoid enormous network payloads
Reducing the size of files needed to render the page improves page download speeds. Find out how to avoid enormous network payloads.
Avoid large layout shifts
Improving the page so content doesn't 'jump around' as additional scripts, fonts and images load enhances user experience. Learn to avoid large layout shifts.
Avoid multiple page redirects
Reducing the number of server requests the browser needs to make speeds up page loading. See how to avoid multiple page redirects.
Avoid non-composited animations
Preventing stuttering movement on low-resource devices like old smartphones improves animation performance. Learn about avoiding non-composited animations.
Avoid serving legacy JavaScript to modern browsers
Eliminating unnecessary downloads and parsing of irrelevant code improves page speed. Find out how to avoid serving legacy JavaScript.
Eliminate render-blocking resources
Stopping JavaScript and CSS in the head from delaying page content being displayed speeds up initial rendering. Learn to eliminate render-blocking resources.
Enable Keep-Alive
Getting the user's browser to 'stay connected' to your server rather than starting a new connection with every request reduces latency. Learn more about enabling Keep-Alive.
Enable text compression
Reducing file sizes with GZIP or Brotli compression speeds up downloads. Find out how to enable text compression.
Ensure text remains visible during webfont load
Adding font-display: swap displays text in a system font while the web font is still downloading. Learn how to ensure text remains visible during webfont load.
Lazy load third-party resources with facades
Improving performance by lazily-loading an image rather than a full embedded resource until the user is ready to interact with it reduces initial page load. Learn about lazy loading third-party resources with facades.
Minify CSS and JavaScript
Making code download faster by removing every unnecessary character reduces file sizes. Learn how to minify CSS and JavaScript.
Minimize main-thread work
Freeing up the main processing thread to actually render the page and process interactions improves responsiveness. Find out how to minimize main-thread work.

Preconnect to required origins
Establishing a connection to relevant servers in advance of needing to download content from them reduces latency. Learn about preconnecting to required origins.
Reduce initial server response time
Using a faster web host or content delivery network accelerates loading. Discover how to reduce initial server response time.
Reduce JavaScript execution time
Freeing up the main thread for content rendering improves page load performance. Learn to reduce JavaScript execution time.
Reduce the impact of third-party code
Limiting the number of plug-ins and resources from other domains, like analytics, ads and chat services, speeds up your page. Find out how to reduce the impact of third-party code.
Reduce unused CSS and JavaScript
Improving page speed by discarding unnecessary code reduces download and parse times. Learn to reduce unused CSS and reduce unused JavaScript.
Serve static assets with an efficient cache policy
Encouraging the user browser to serve cached assets rather than re-downloading them improves repeat visit performance. Learn about serving static assets with an efficient cache policy.
Use a meta viewport tag with width or initial-scale
Enabling mobile browsers to display your page optimally improves mobile user experience. Learn about using a meta viewport tag.
Use a Content Delivery Network (CDN)
Having copies of your site served from geographically local servers reduces latency for users worldwide. Discover the benefits of using a CDN.
Use HTTP/2 for all resources
Allowing the user's browser to make multiple server requests at once over the same connection improves loading efficiency. Learn about using HTTP/2.
Preload Largest Contentful Paint image
Making downloading the most prominent image on your page a top priority improves perceived load time. Find out how to preload your Largest Contentful Paint image.
Efficiently encode images
Reducing the file size of image resources without visible reduction in quality speeds up image downloads. Learn to efficiently encode images.
Use explicit width and height on image elements
Preventing jumps in layout by holding space for yet-to-be-loaded images improves visual stability. Find out why you should use explicit width and height on image elements.

Combine images using CSS sprites
Reducing the number of server requests by combining many small images into one improves load performance. Learn about combining images using CSS sprites.
Defer offscreen images
Postponing loading images that are out-of-sight until later frees up bandwidth for above-the-fold content (also known as 'lazy loading'). Learn to defer offscreen images.
Use passive listeners to improve scrolling performance
Eliminating delays when the user starts to scroll improves responsiveness. Learn about using passive listeners.
Use video formats for animated content
Eliminating over-large animated GIFs with more efficient video formats reduces file sizes. Discover how to use video formats for animated content.
Serve images in next-gen formats
Reducing image download size by using WEBP and AVIF compression improves page speed. Learn about serving images in next-gen formats.
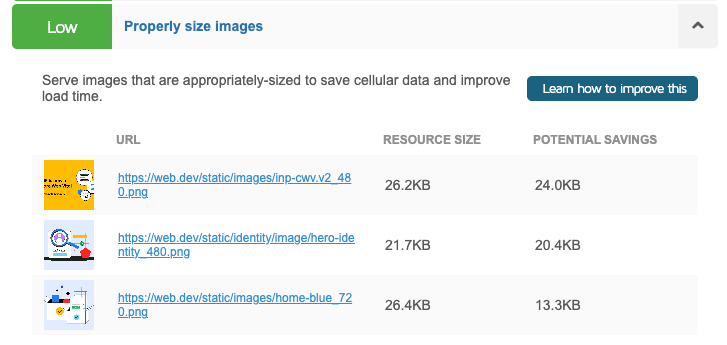
Properly size images
Avoiding delivering unnecessarily high-res images for users on smaller mobile devices reduces download times. Find out how to properly size images to save on download size without impacting user experience.
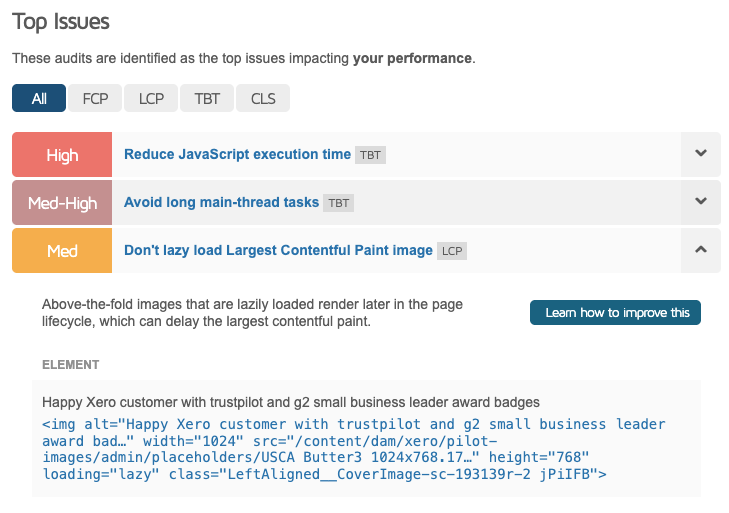
Don't lazy load Largest Contentful Paint image
Accelerating the download of your most high-priority image improves LCP scores. Learn why you shouldn't lazy load your LCP image.
Google CrUX data
GTmetrix normally runs synthetic tests where data is collected on-demand in a controlled lab environment on a GTmetrix server.
However, it can also report real user data from Google's Chrome User Experience Report (CrUX).
This tells you whether your website passes Google's Core Web Vitals assessment, which impact how your site ranks in search results.
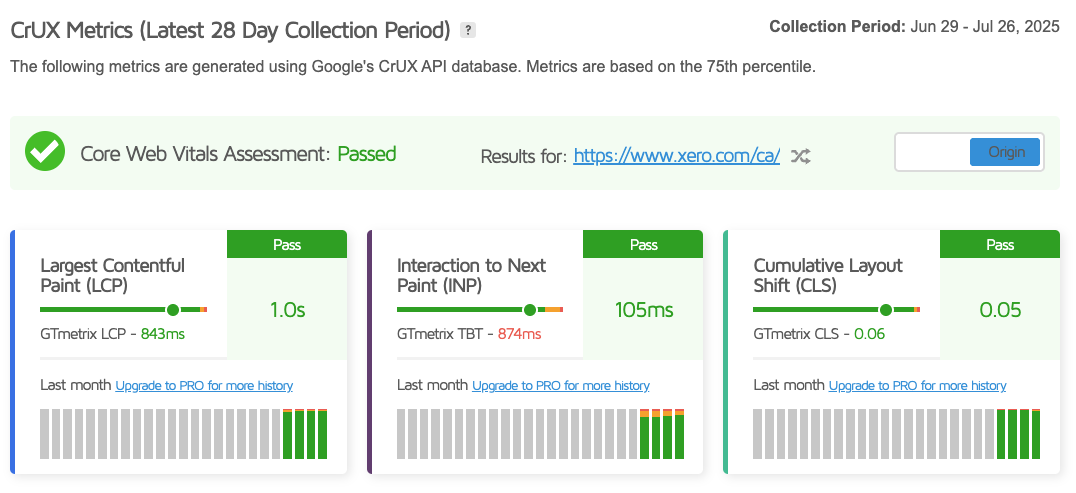
DebugBear can provide more in-depth CrUX analytics.
Other speed testing tools
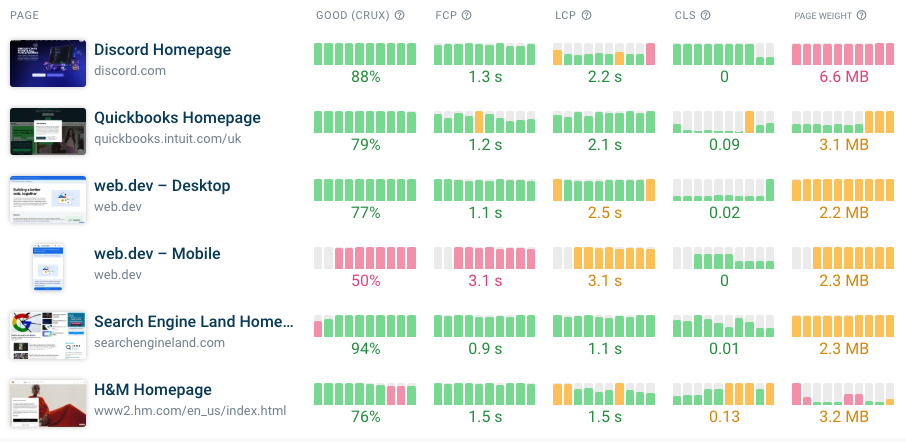
There are many site speed testing tools available online as alternatives to GTmetrix. If GTmetrix doesn't offer the data you need, try out DebugBear's free website speed test.
You can test pages on mobile and desktop devices, measure Google Core Web Vitals, and investigate when different page resources load.
If you have a DebugBear account, you can also run experiments to measure the impact of a change without making any changes to your live website.
Run A Free Page Speed Test
Test Your Website:
- Automated Recommendations
- Detailed Request Waterfall
- Web Vitals Assessment
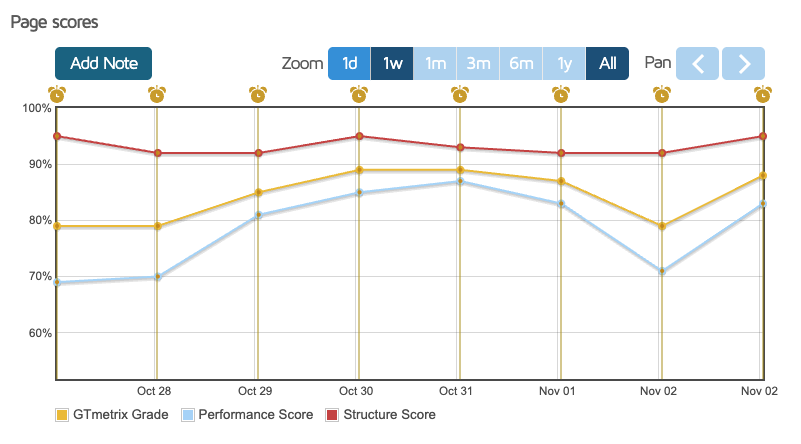
Track your page speed over time
If you're working on your website performance you can set up continuous synthetic monitoring for your pages to confirm your optimizations are working and get alerted to any regressions.
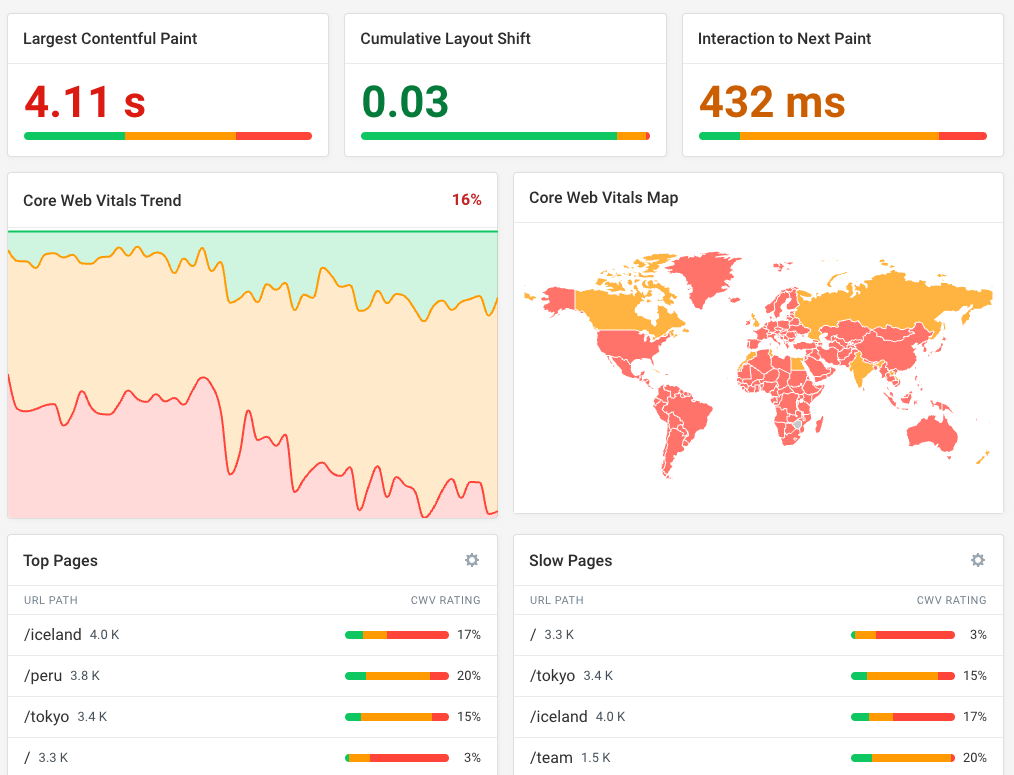
You can also set up real user monitoring (RUM) to see how fast your website is for actual website visitors, and what you can do to fix that.
RUM data can tell you:
- If specific visitor segments have a slow experience
- How page interactions cause poor performance
- What pages across your website are slow
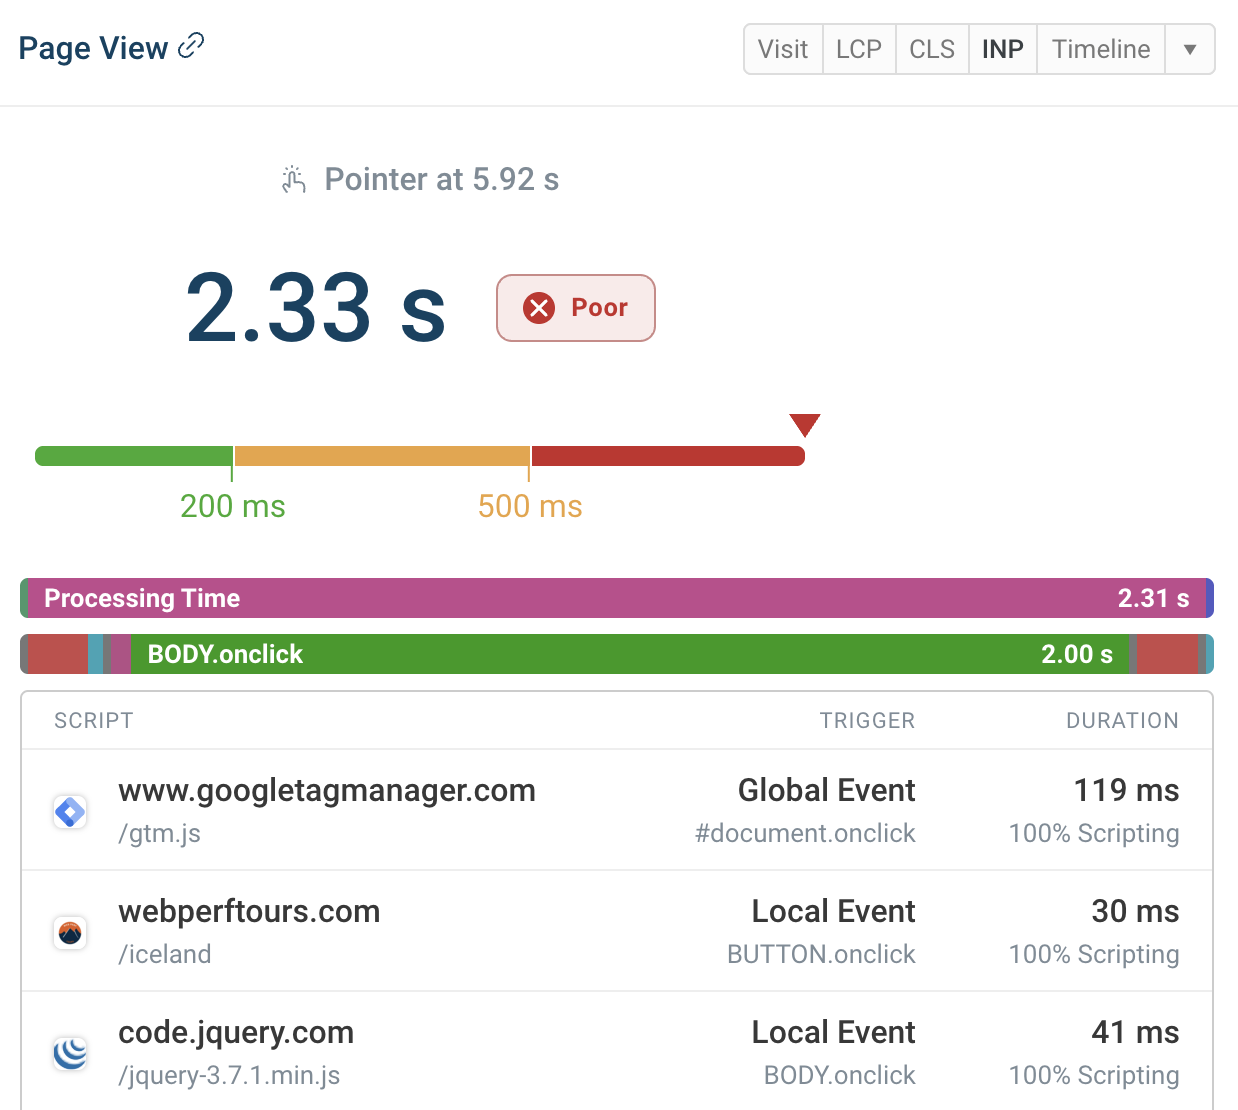
If you're struggling with poor Interaction to Next Paint scores, DebugBear RUM can tell you where on the page those interactions are happening and what scripts are slowing them down.


Monitor Page Speed & Core Web Vitals
DebugBear monitoring includes:
- In-depth Page Speed Reports
- Automated Recommendations
- Real User Analytics Data