See what requests the browser is spending resources one. See how different requests relate to each other.
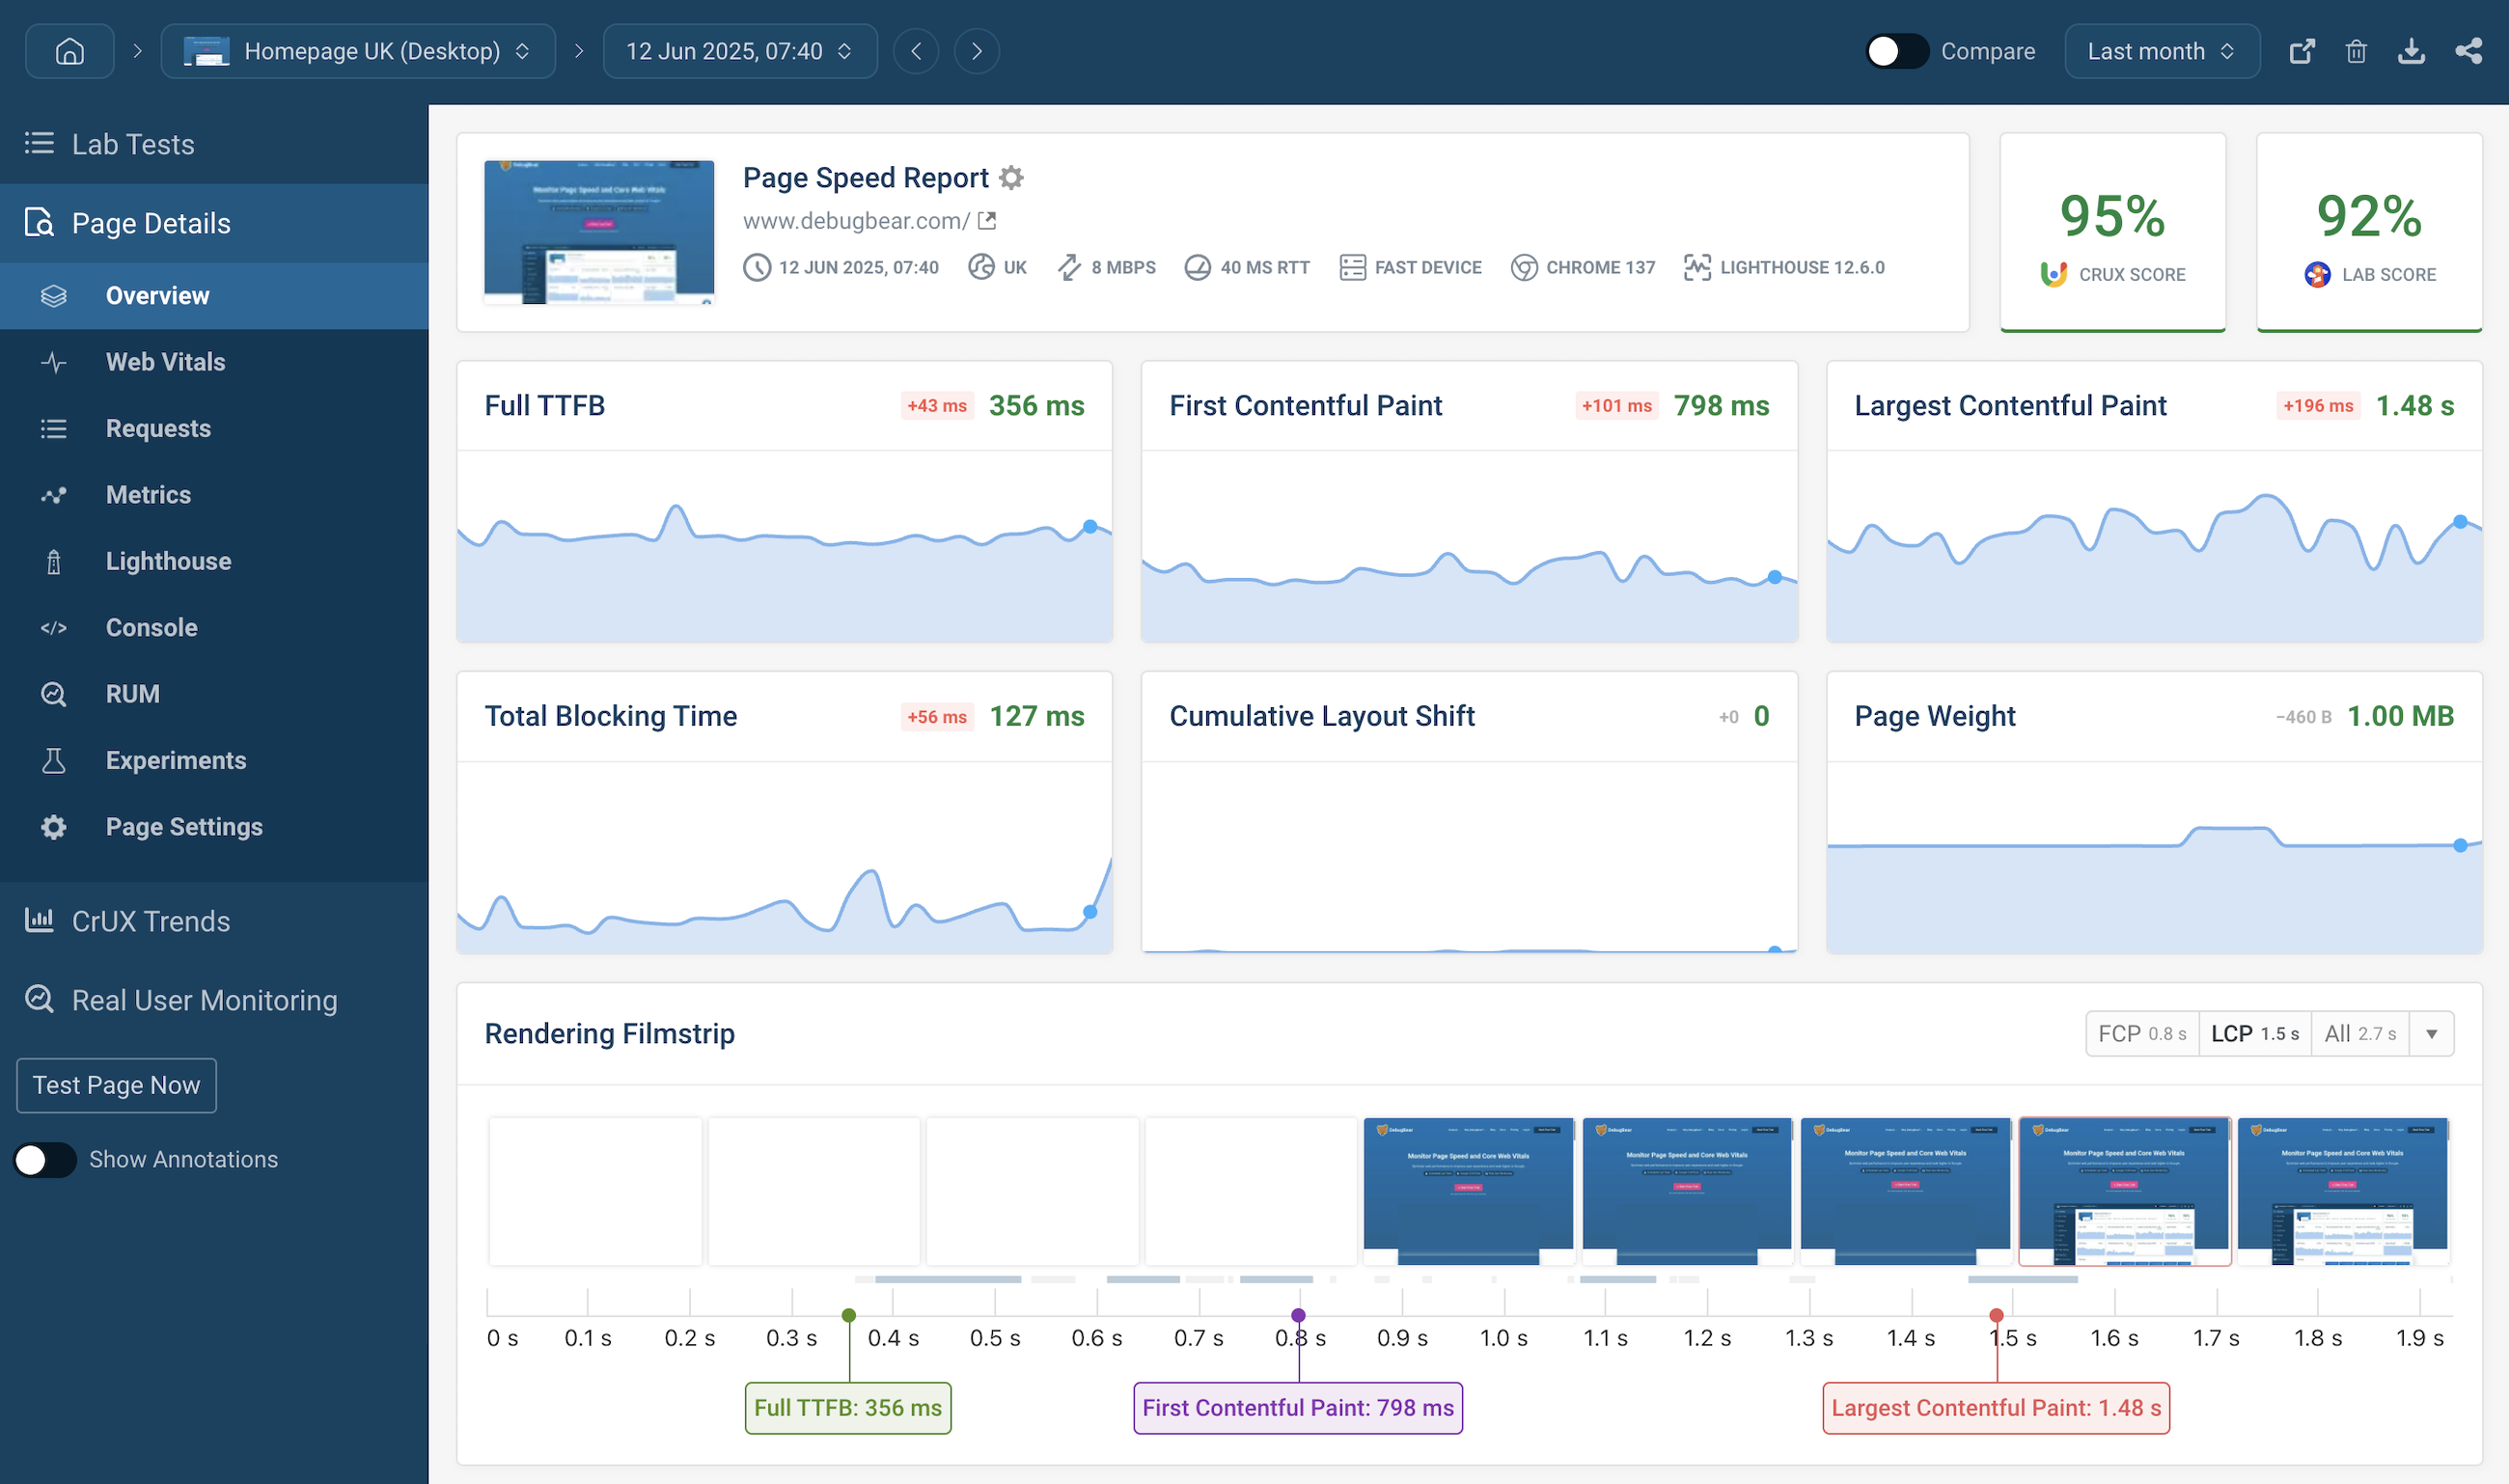
Filmstrip and rendering video
Correlating rendering progress with what's happening on the network tells you what's holding back your page load times.
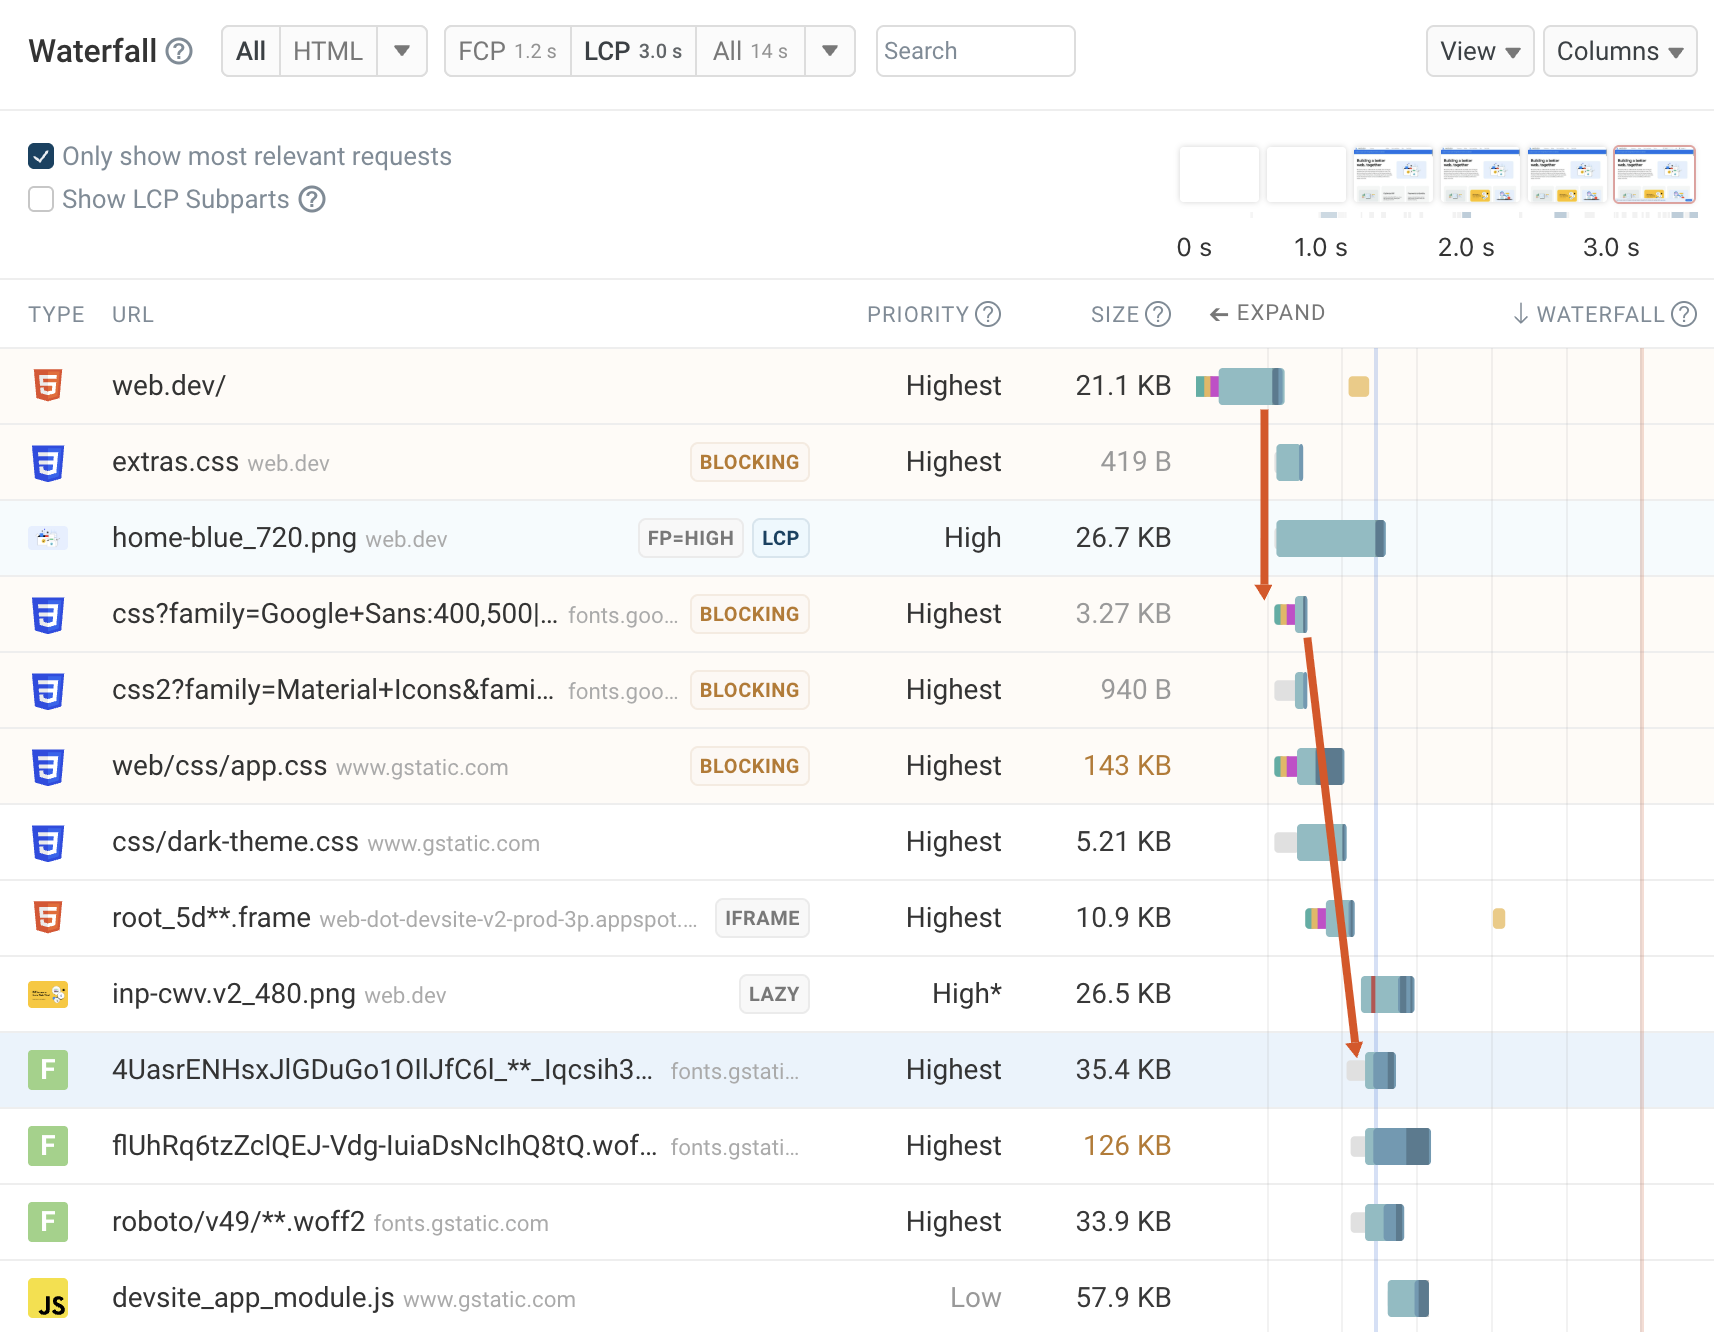
Understand request behavior
DebugBear marks requests with additional detail, like whether they are render-blocking, preloaded, loaded via Early Hint, or are required to load the LCP element.
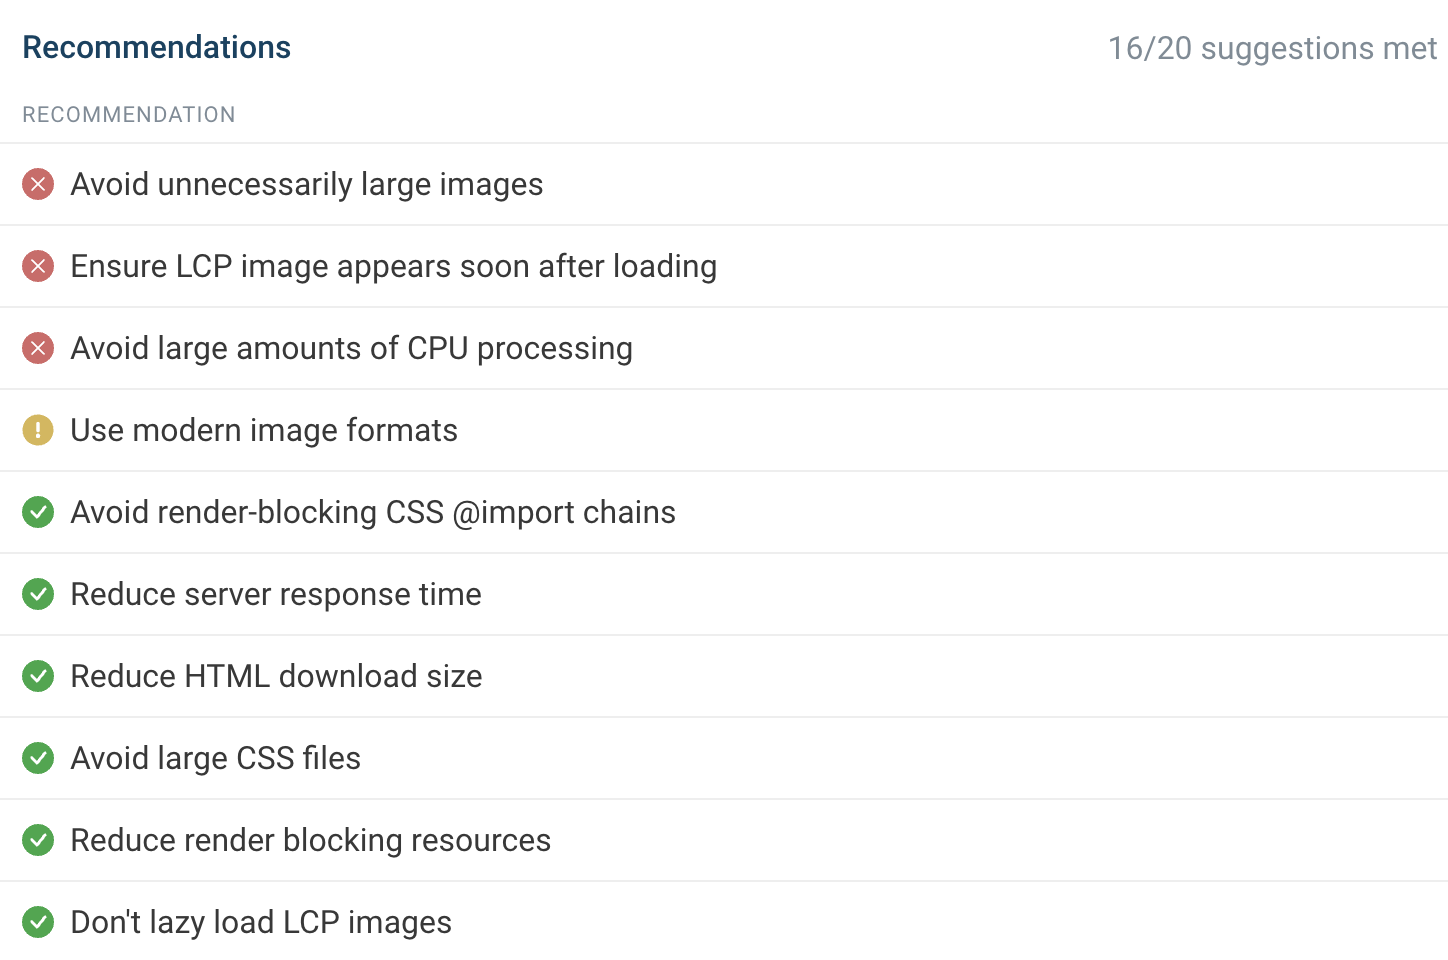
Recommendations for your website
Automated insight
DebugBear identifies common page speed issues and provides recommendations on how to fix them.
Prioritize optimizations
Each web performance recommendation includes a priority to give an estimate of its impact.
Integrated Lighthouse report
Each test result includes a Google Lighthouse test result.
Run page speed experiments
Try optimizations without deploying code
DebugBear's experiments feature lets you try code changes in a controlled environment without deploying code on your website.
Help your team prioritize
Measure the expected impact of an improvement and only send the most important ones to your dev team.
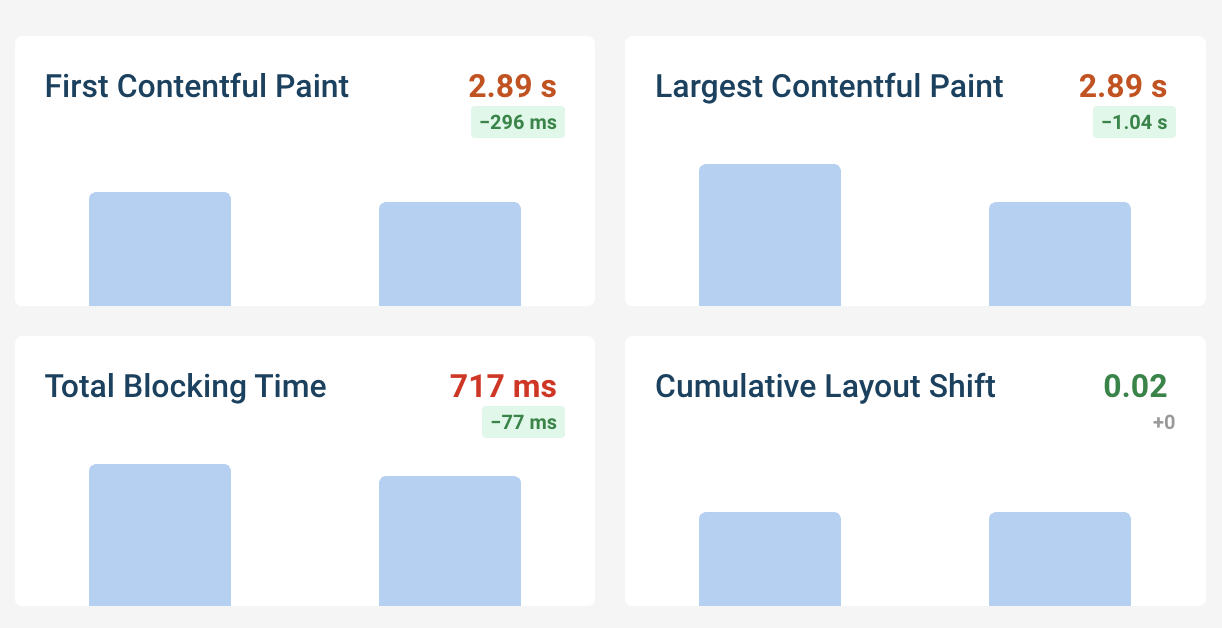
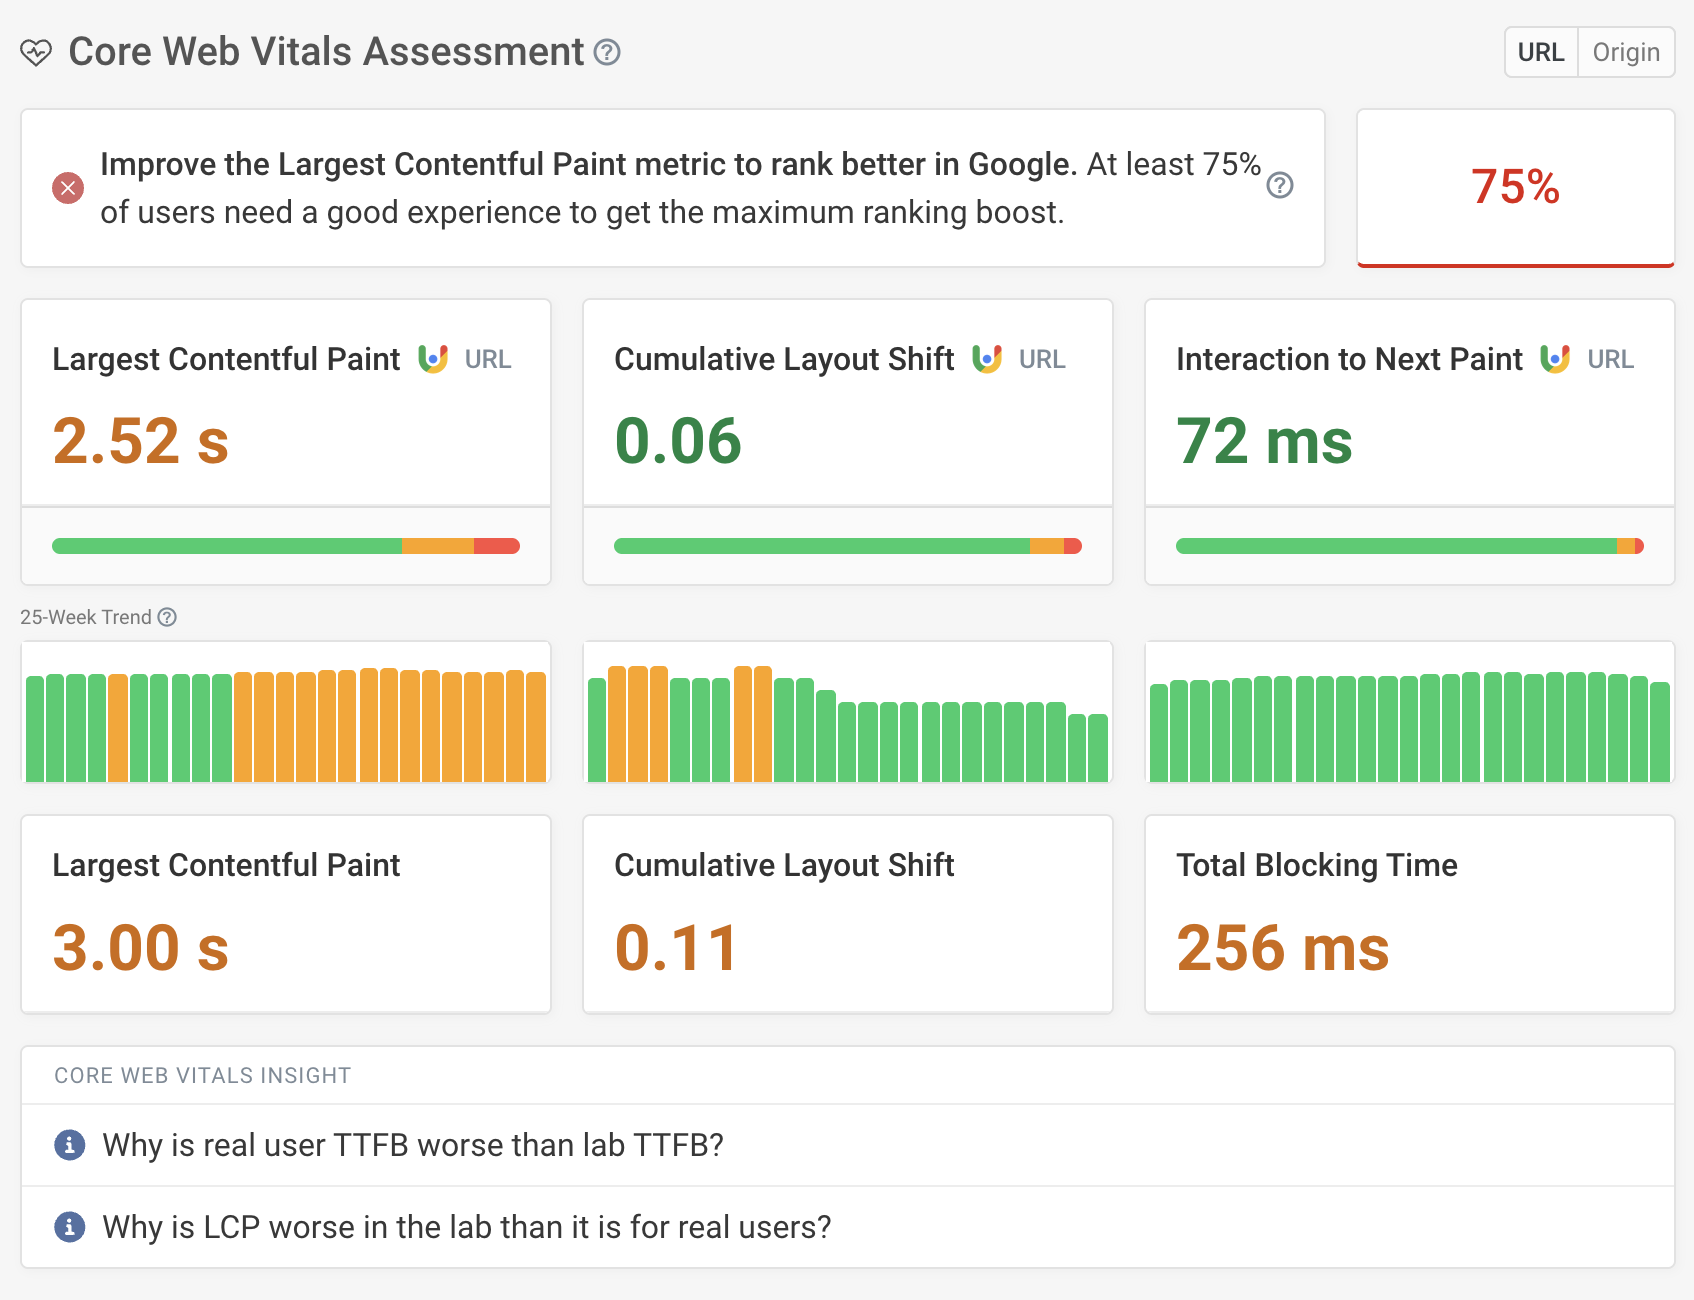
See how your Core Web Vitals scores have changed over the last 25 weeks.
”DebugBear delivers the
best stats for before and after changes
in exquisite detail. It also shows clear and easy to find data for
Google's Web Vitals.
”The reporting data is very helpful in pinpointing what causes
site speed issues – immediately actionable.
It's well above and beyond the info you get from Lighthouse
and the performance tests through Chrome.“
Loren McDonald
IT Director
”The most actionable-info packed page speed visualization
available. DebugBear provides unique features that are crucial
to debugging complex issues, like request-chain visualization."
Robin Marx
Web Protocol and Performance Expert
”DebugBear's alerts are our early warning system. They catch new scripts that could slow us down before they become a problem.”