
Monitor Page Speed and Core Web Vitals
Speed up your website, fast!
The powerful page speed optimization tool for developers, SEO experts, and performance specialists.


Be faster than your competition
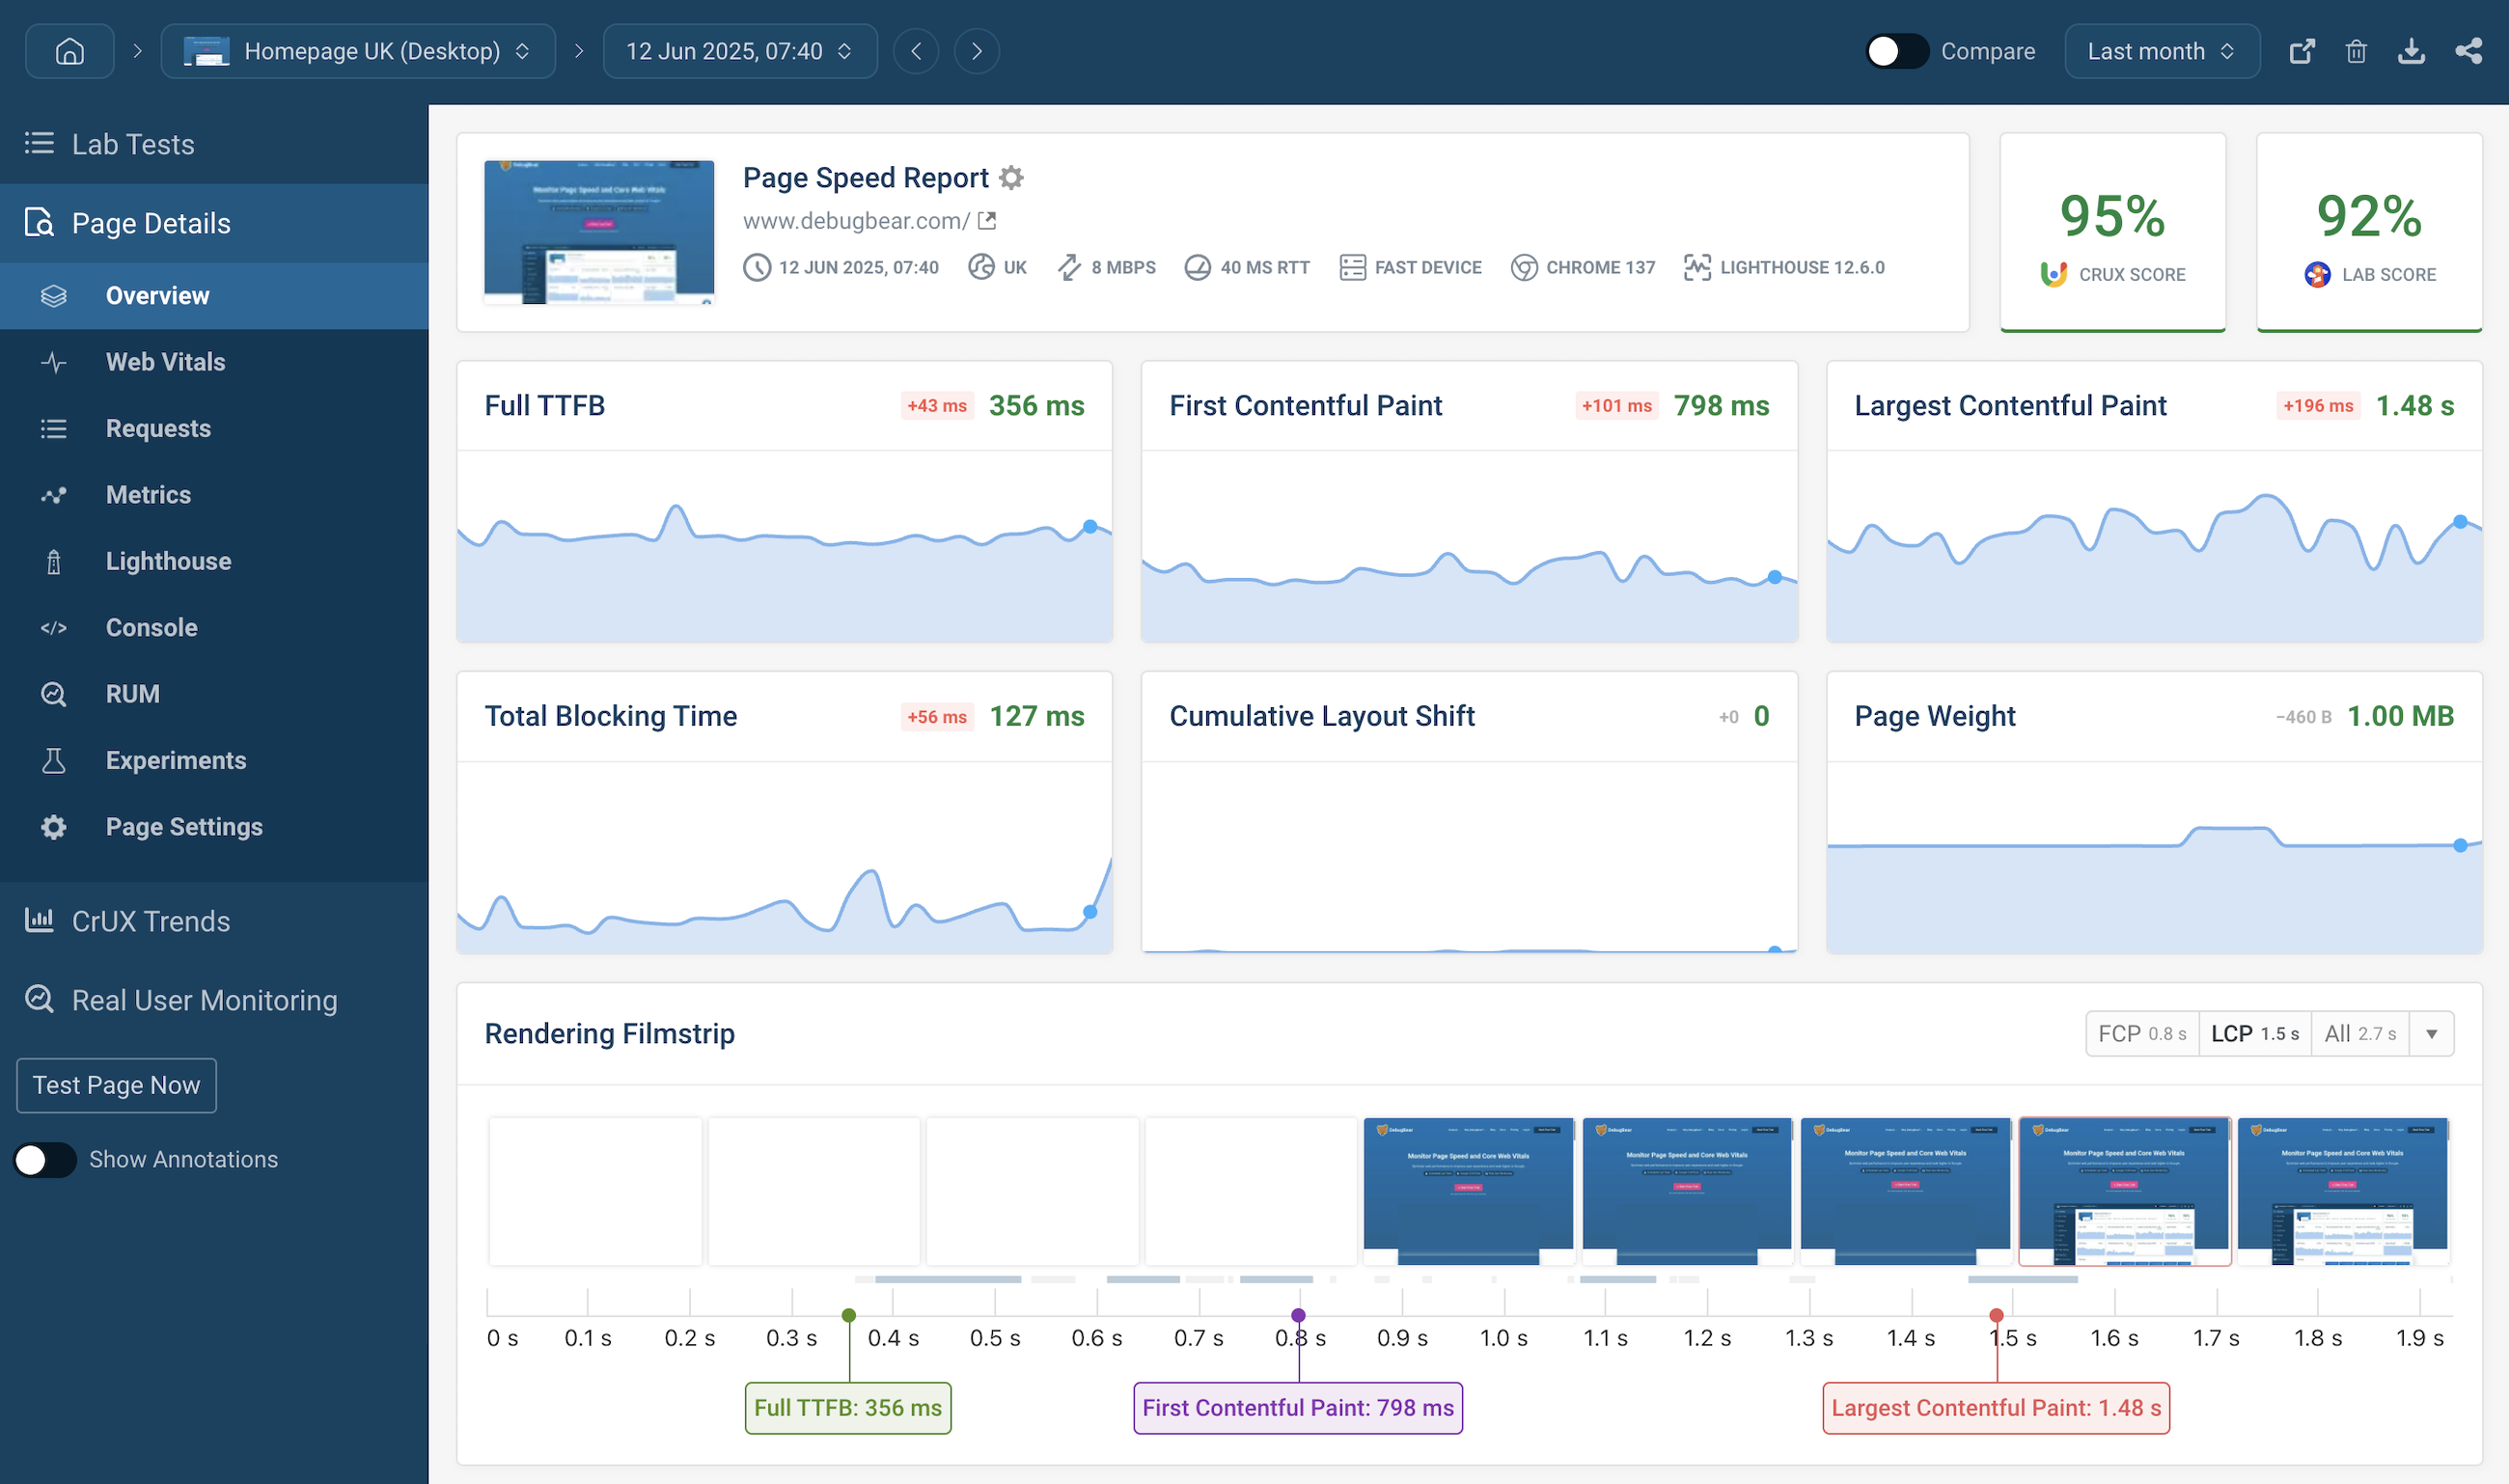
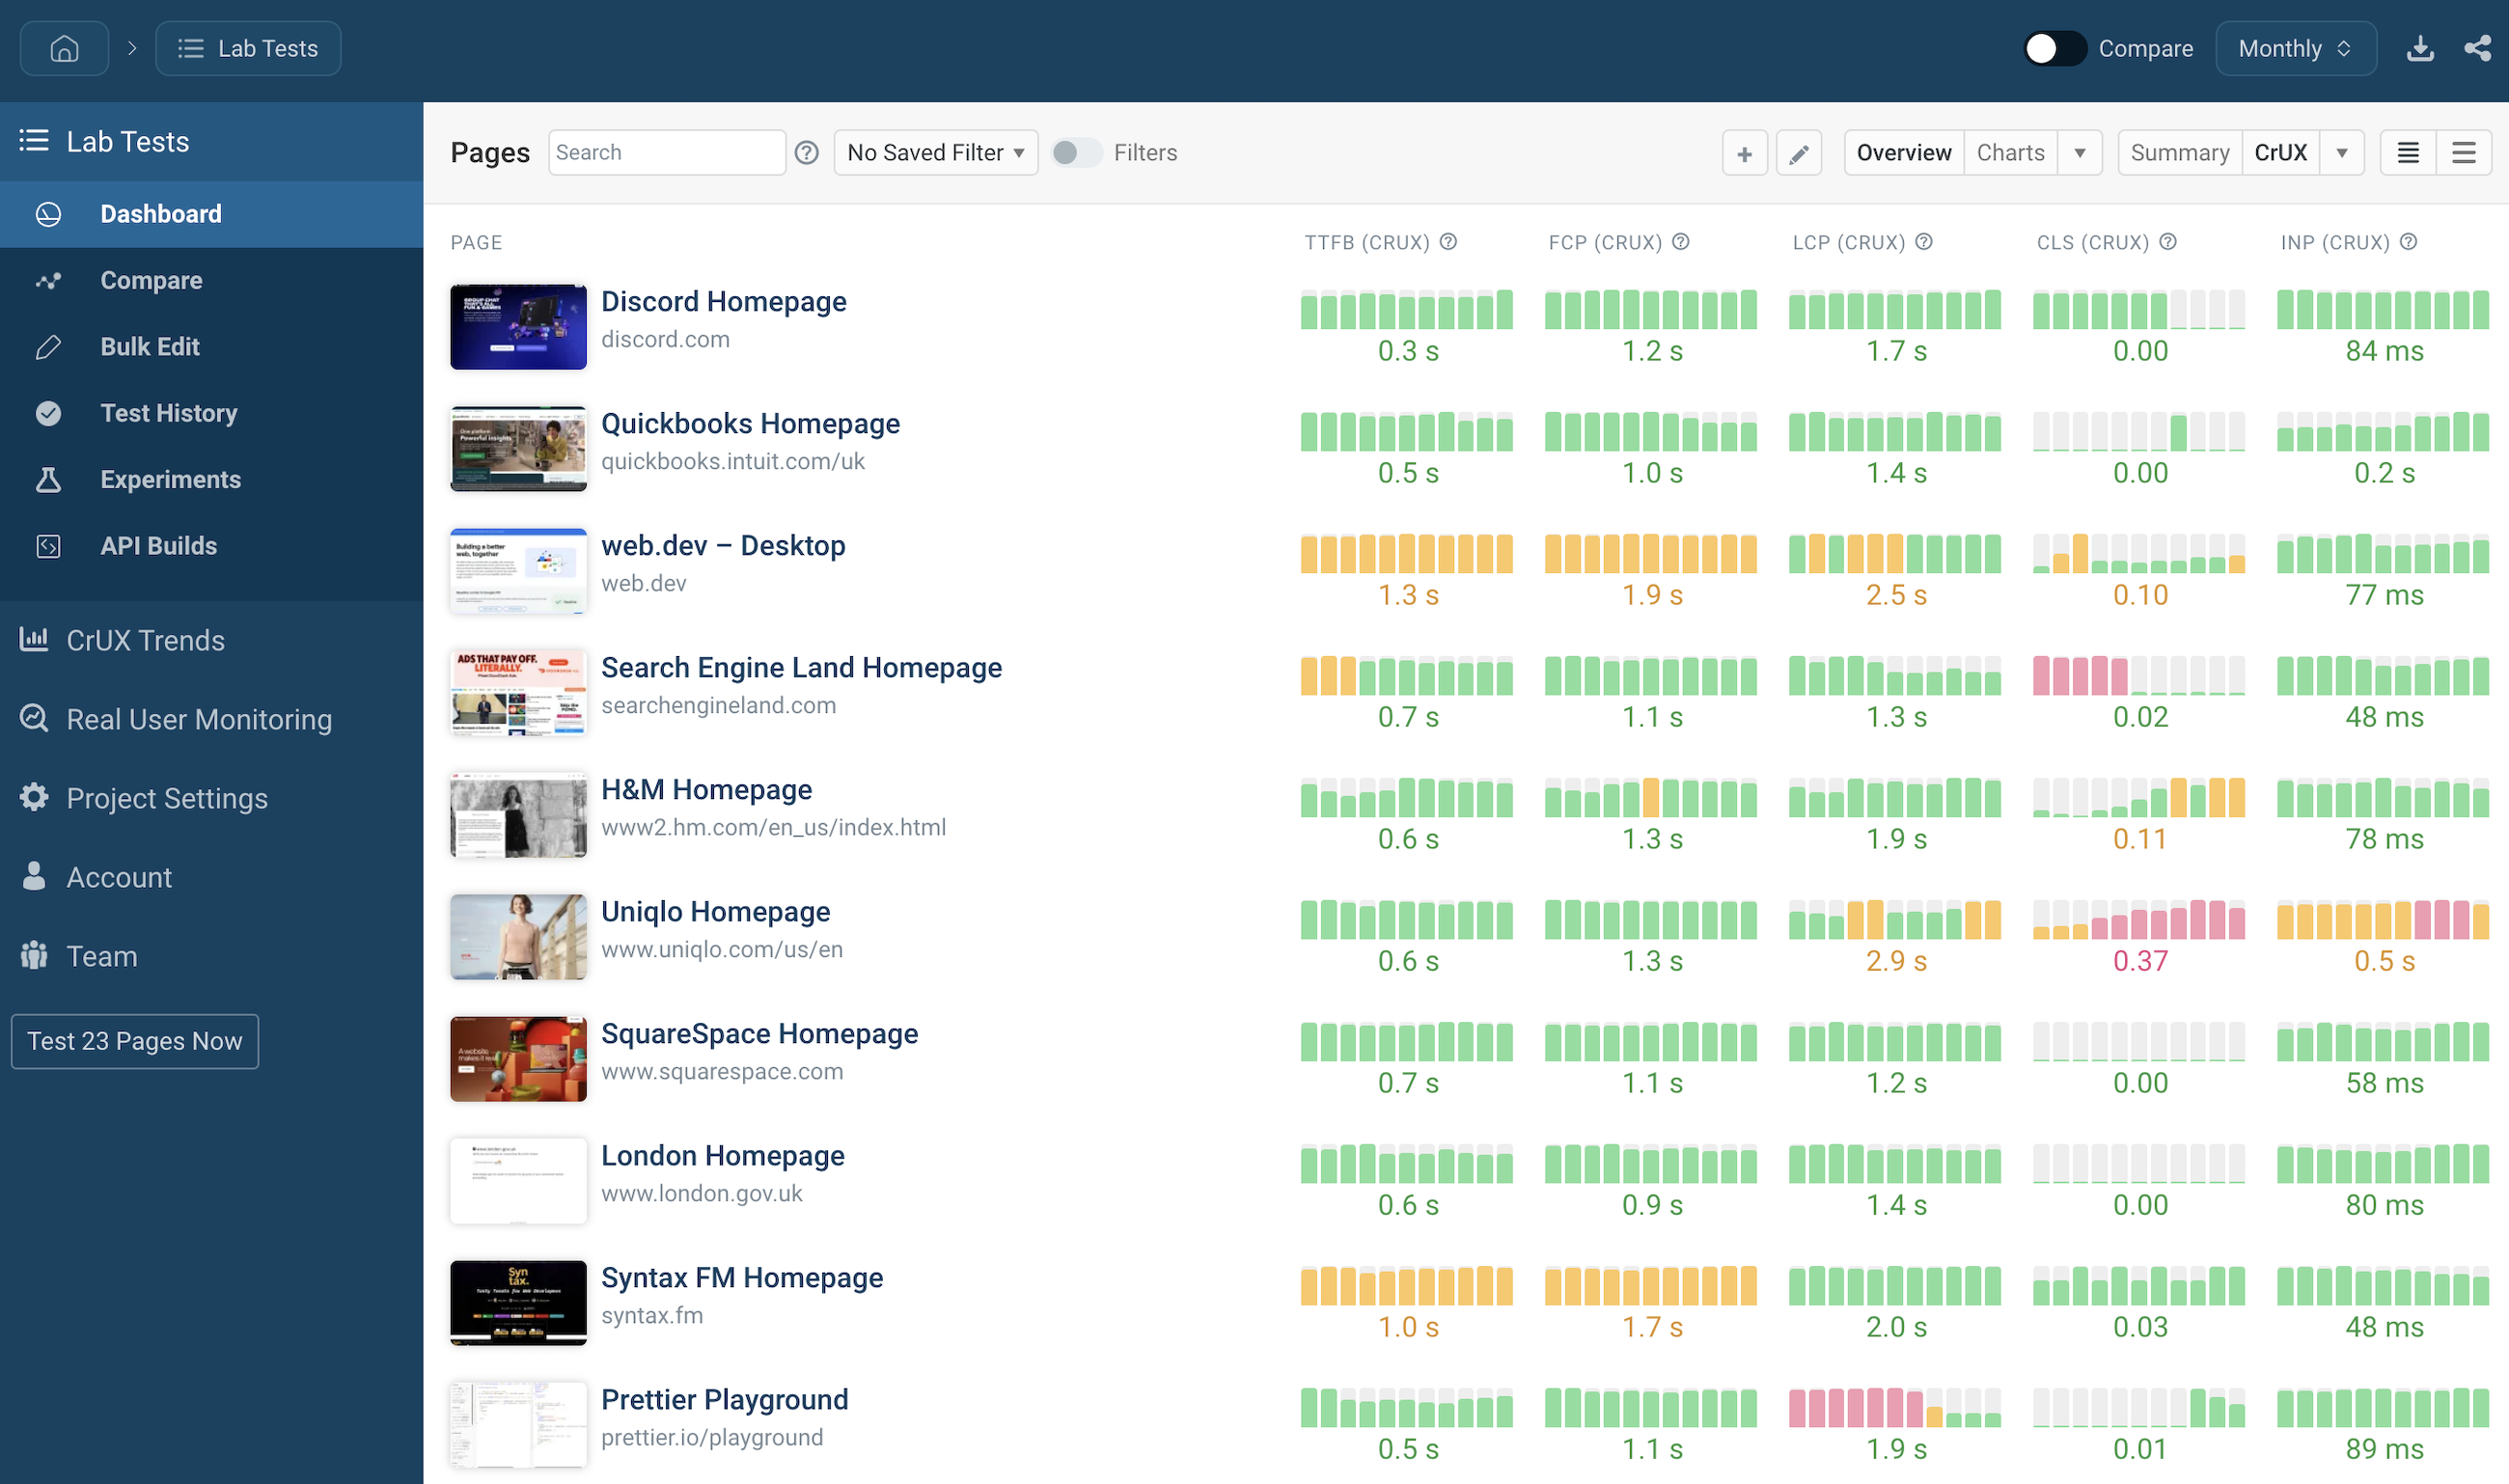
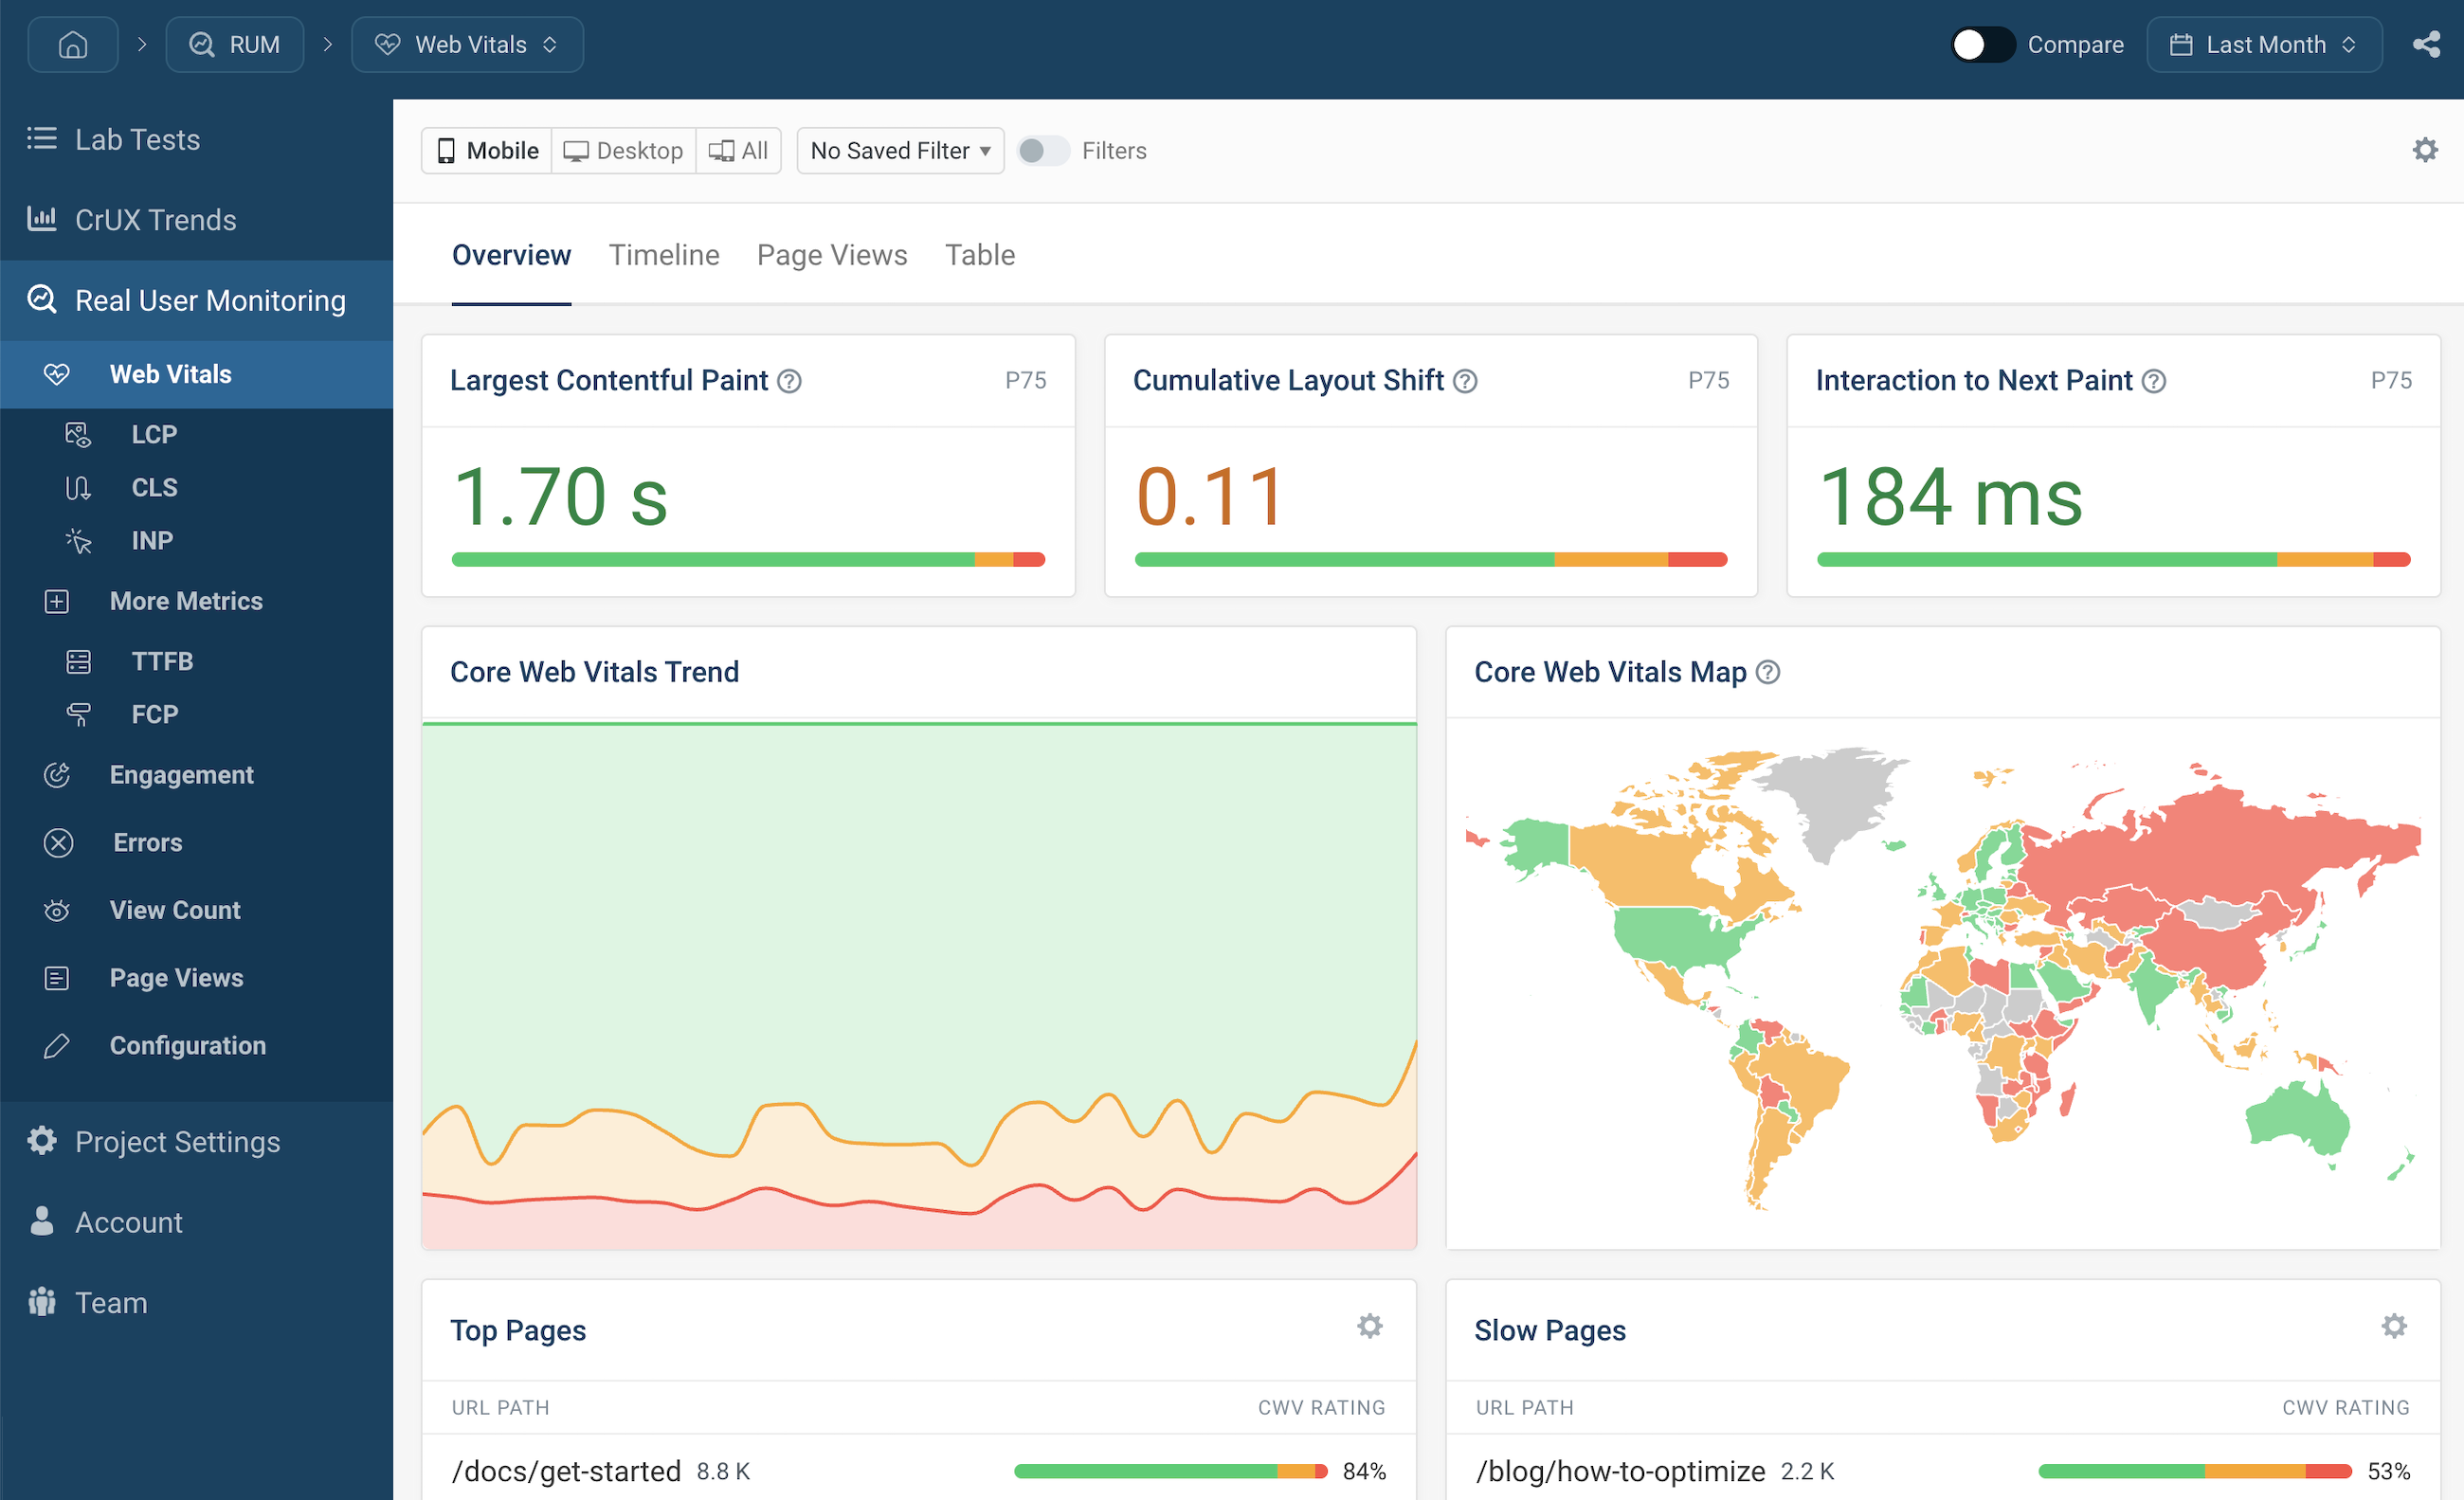
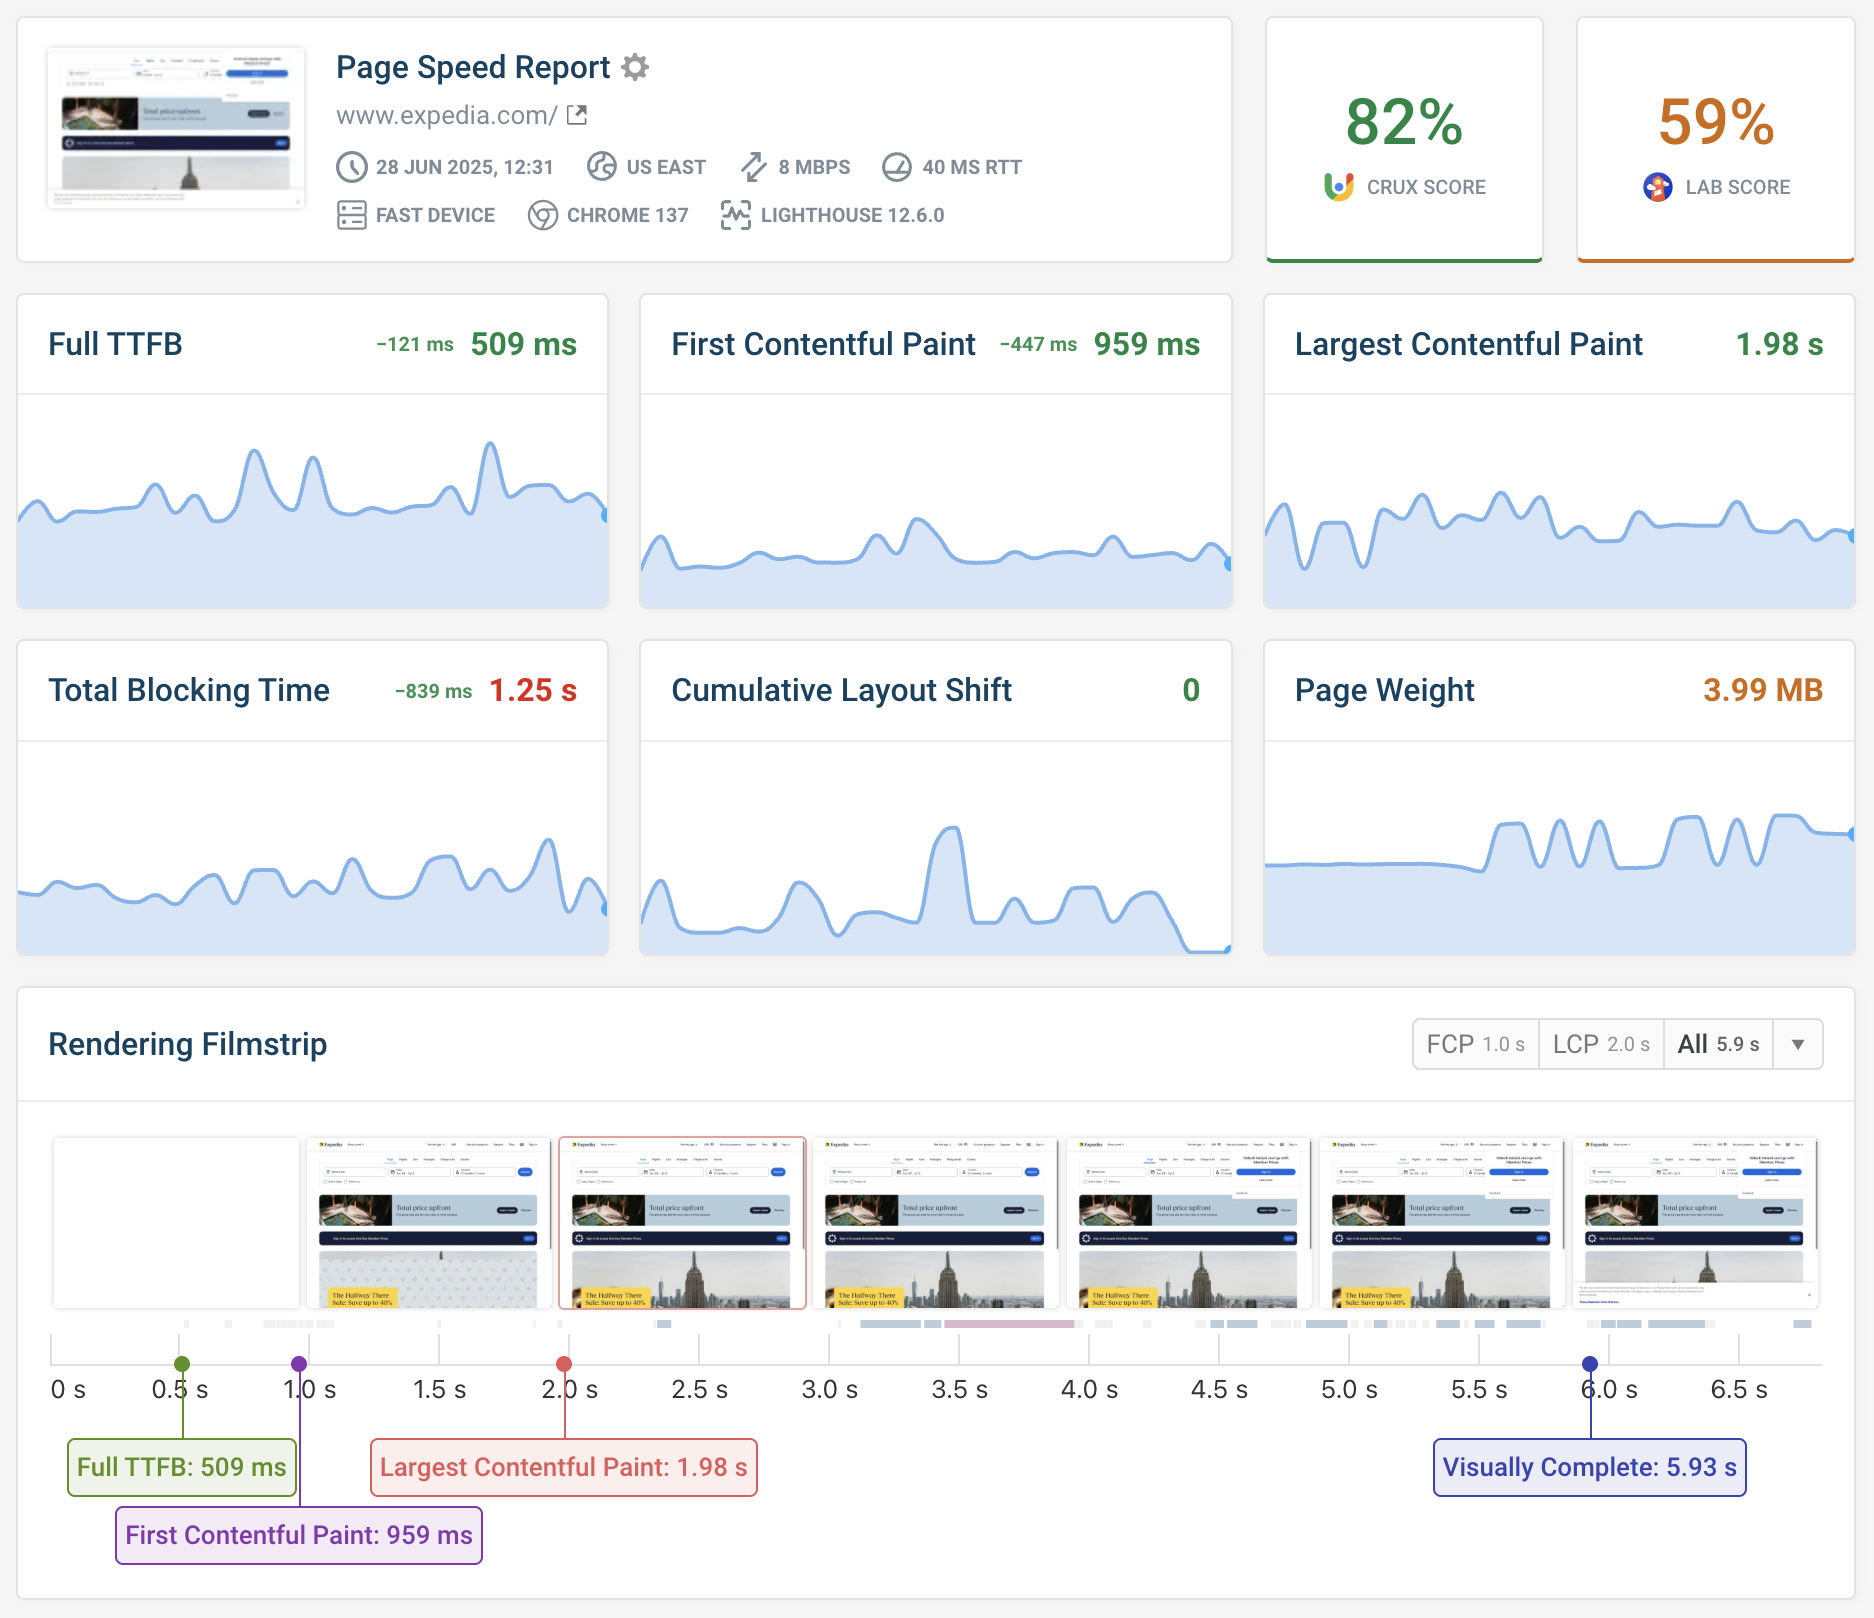
Comprehensive website performance monitoring
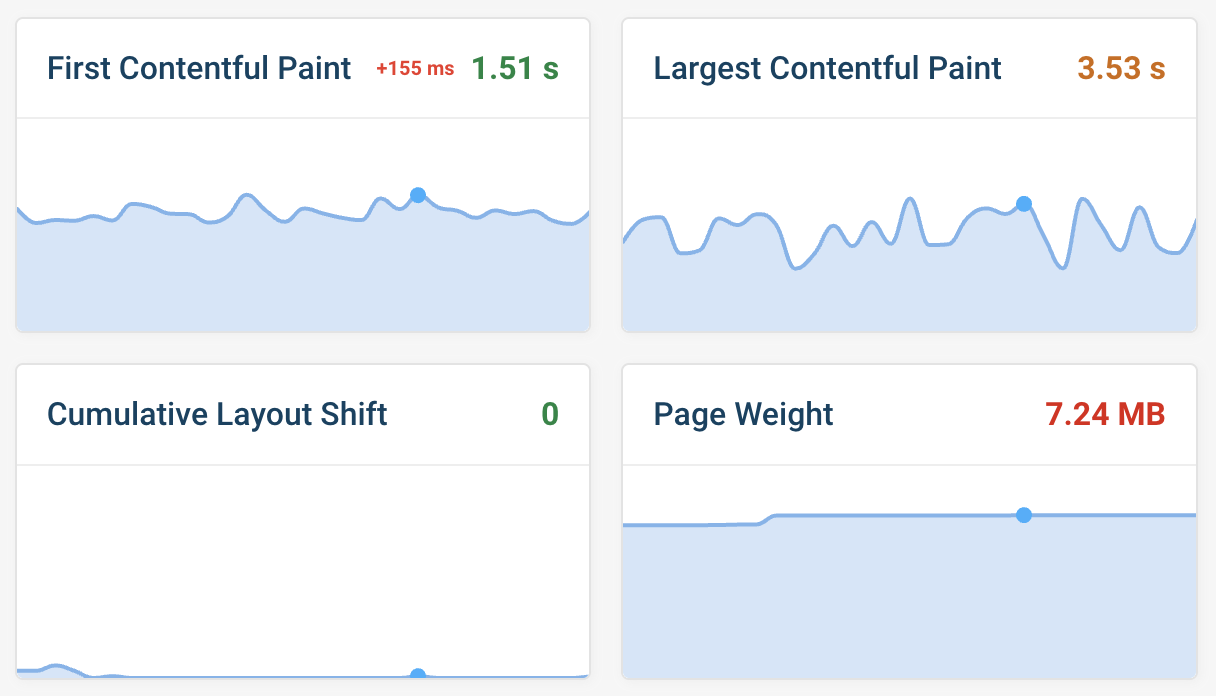
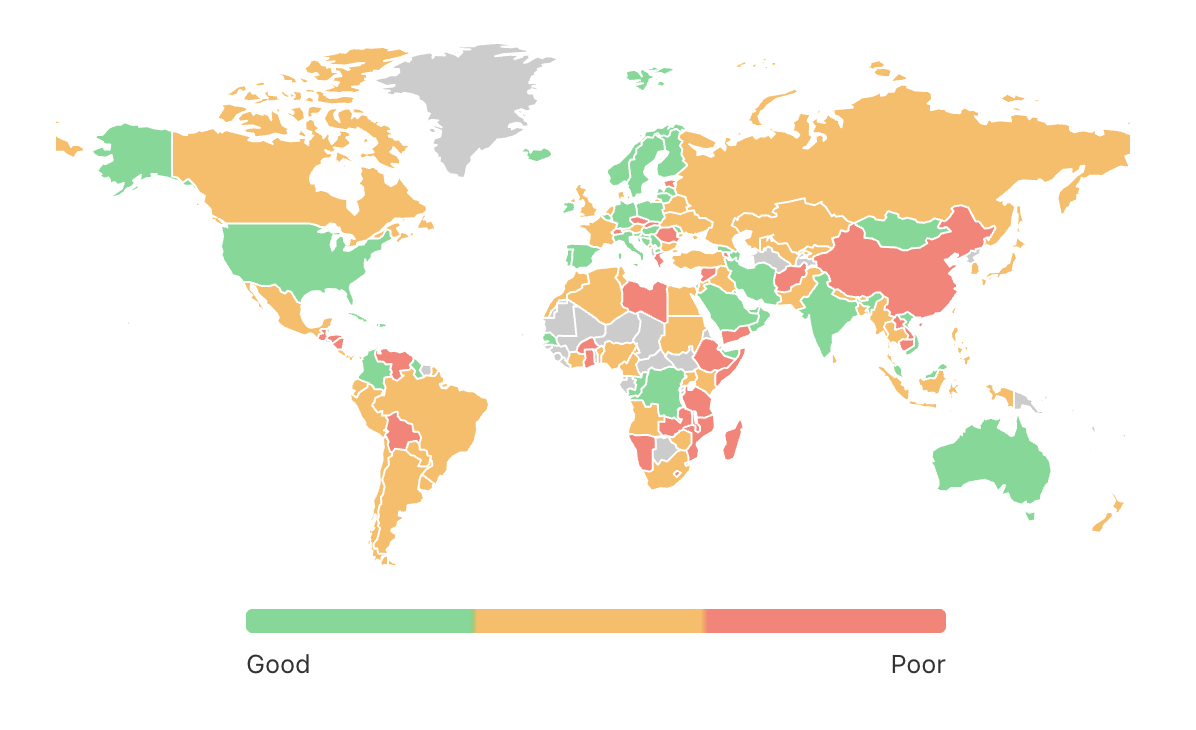
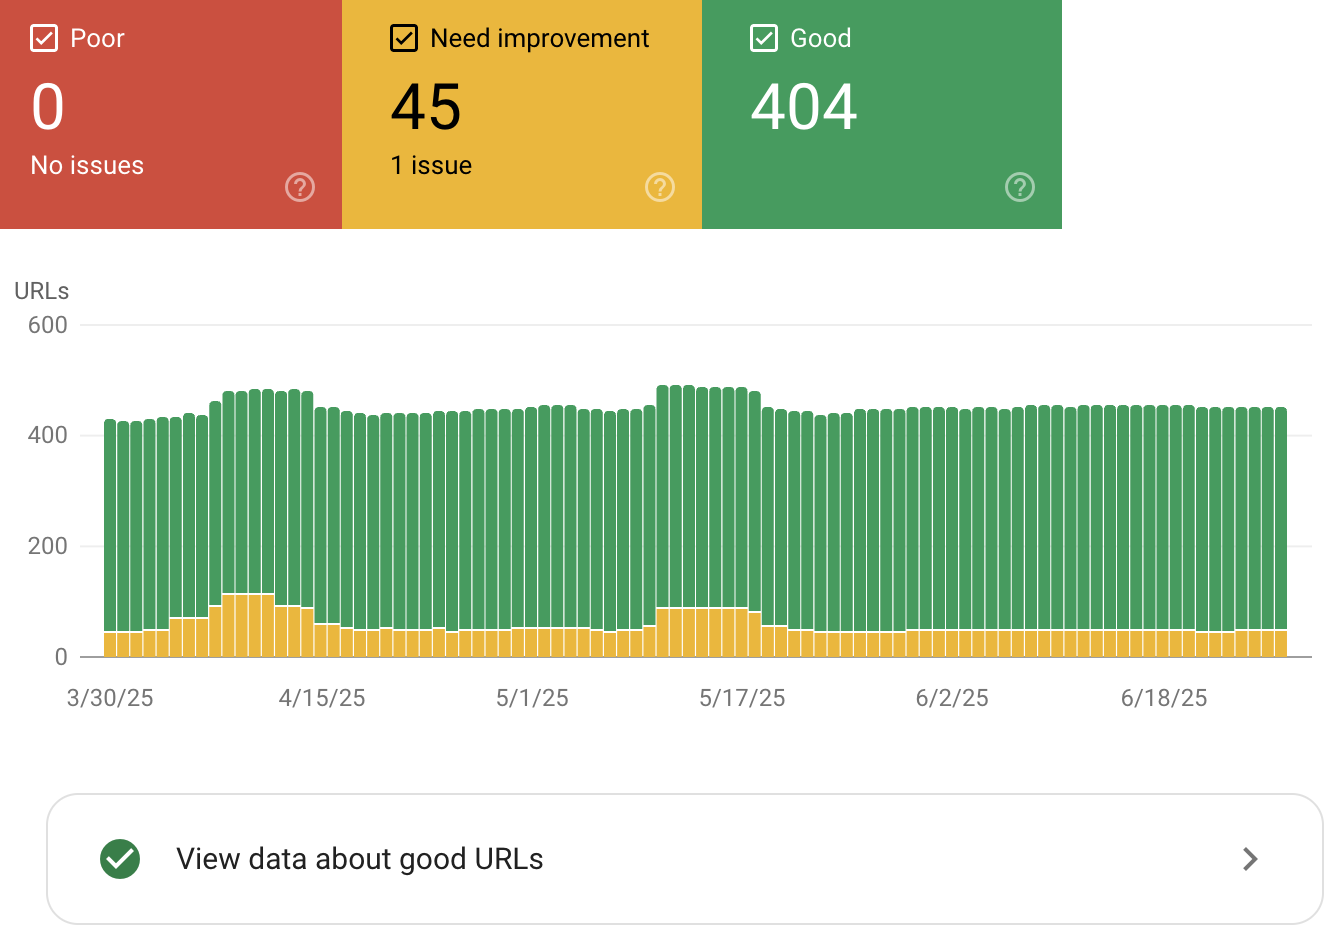
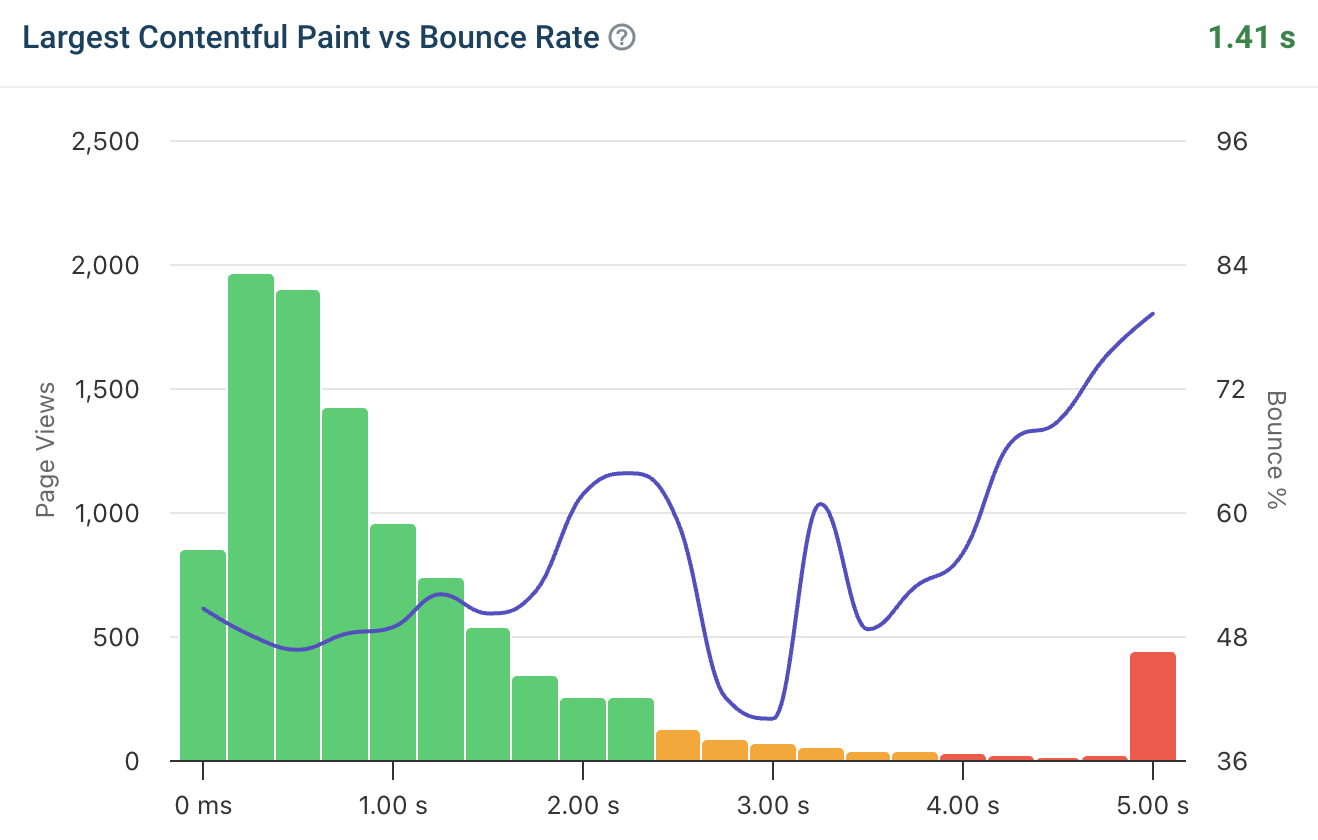
Identify web performance issues
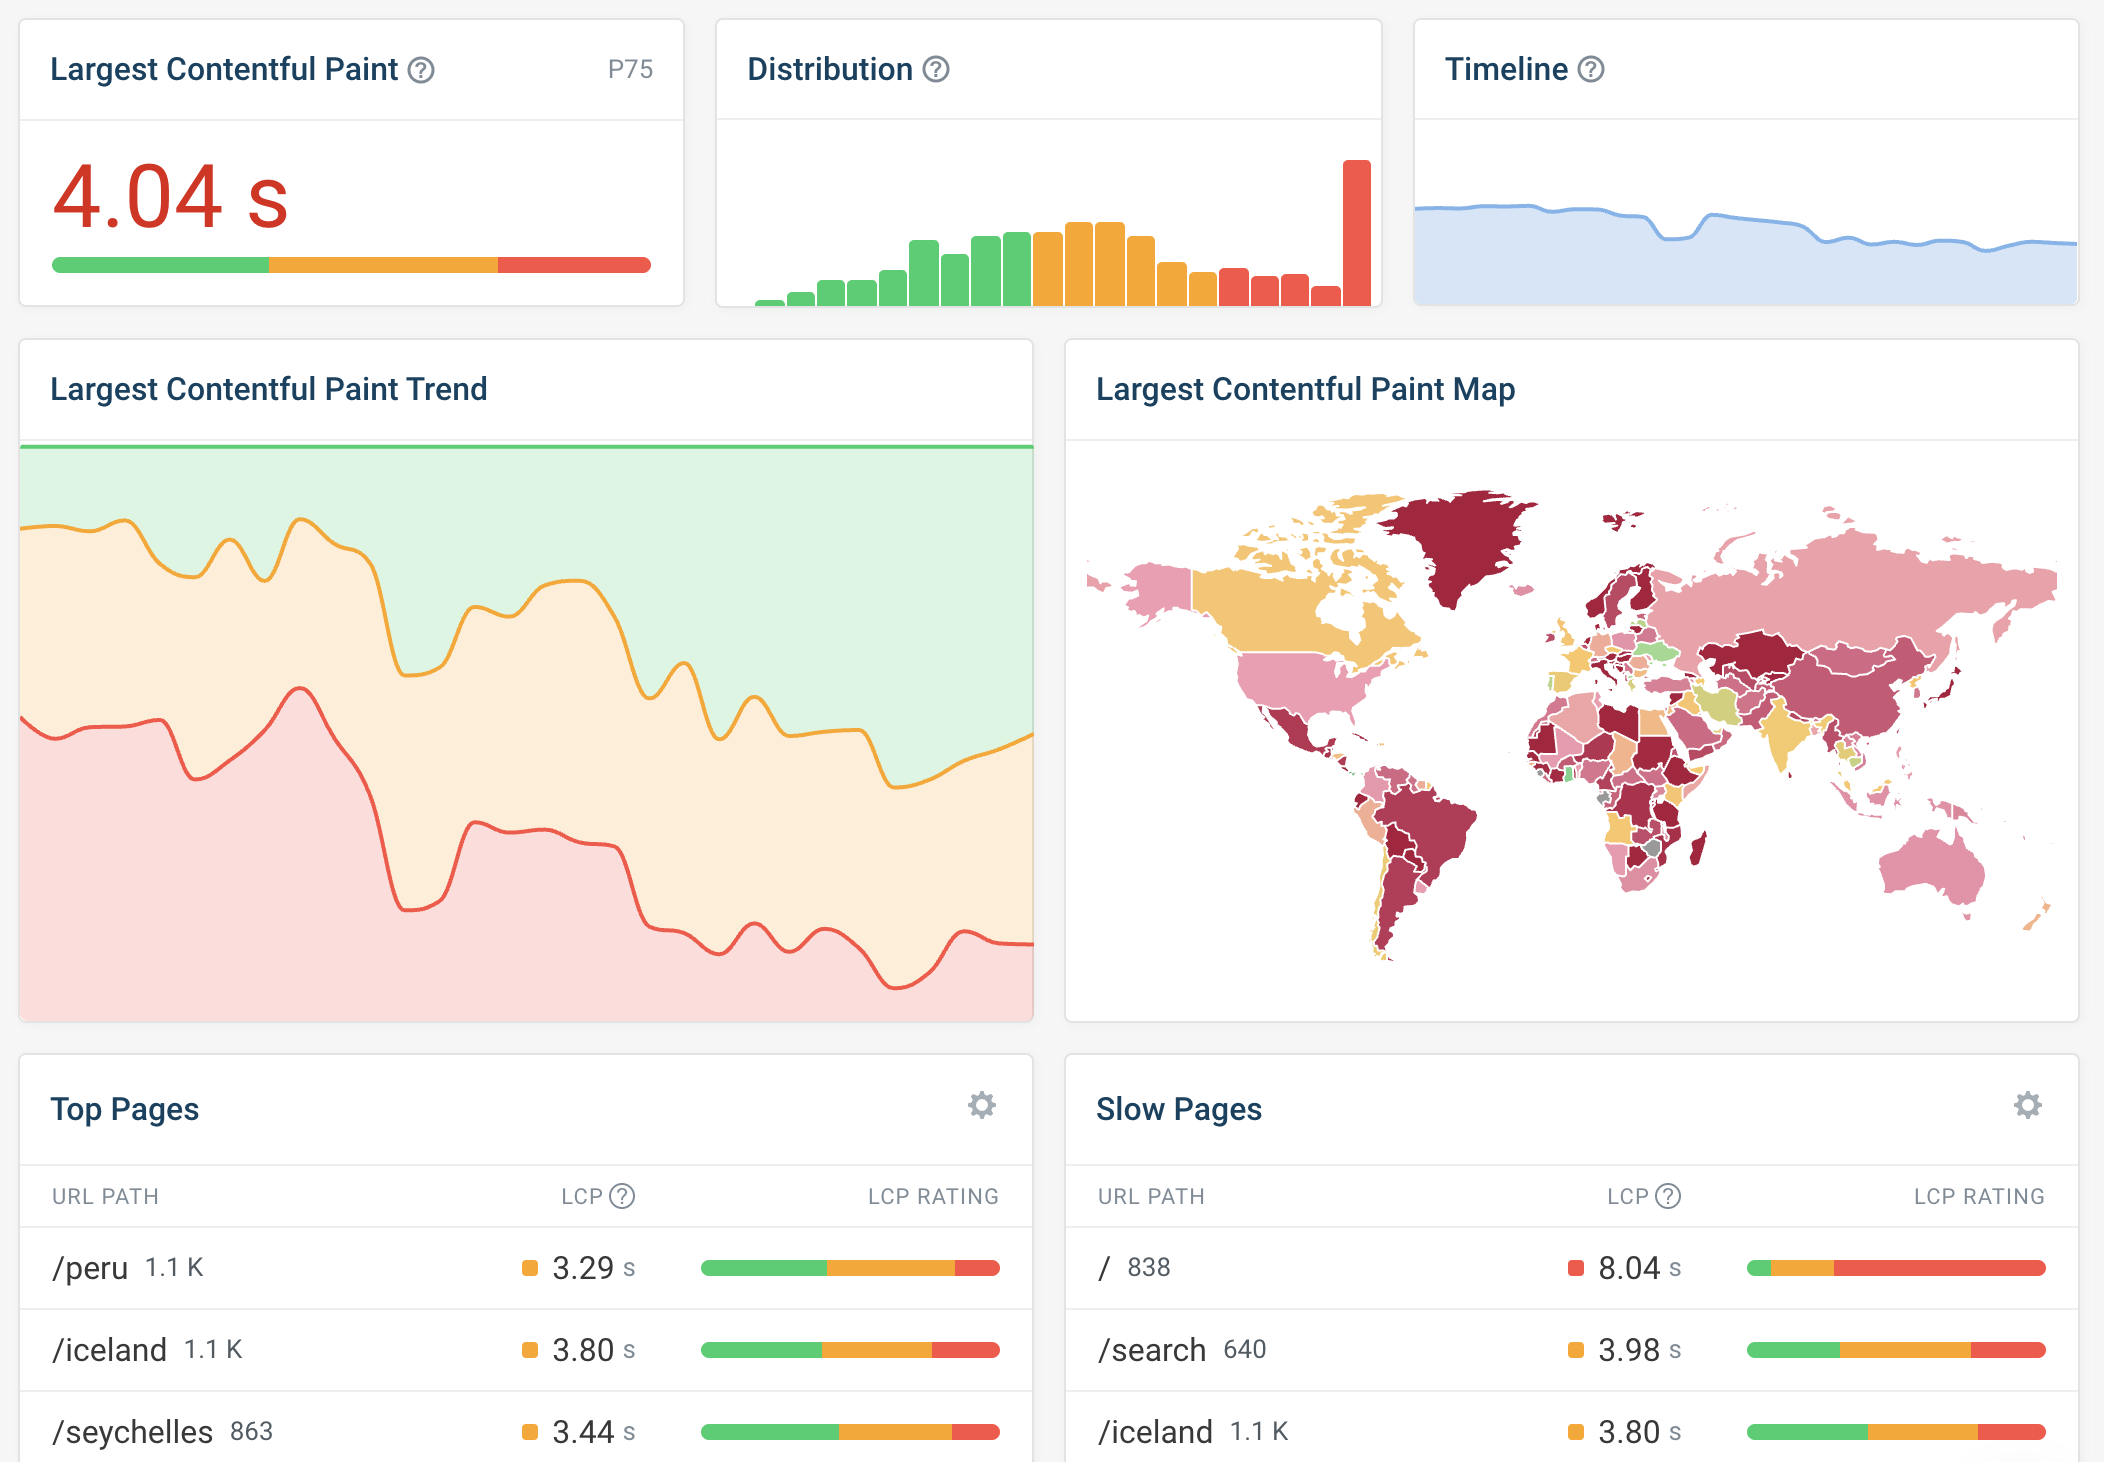
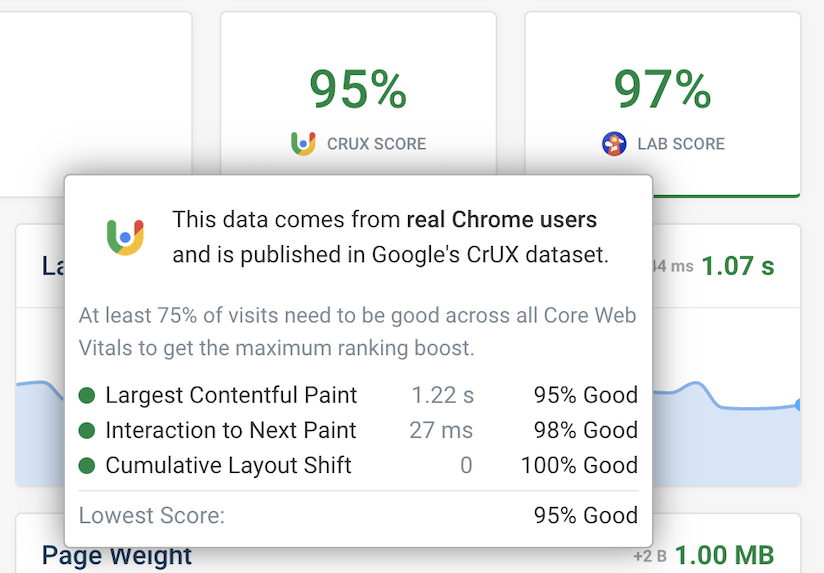
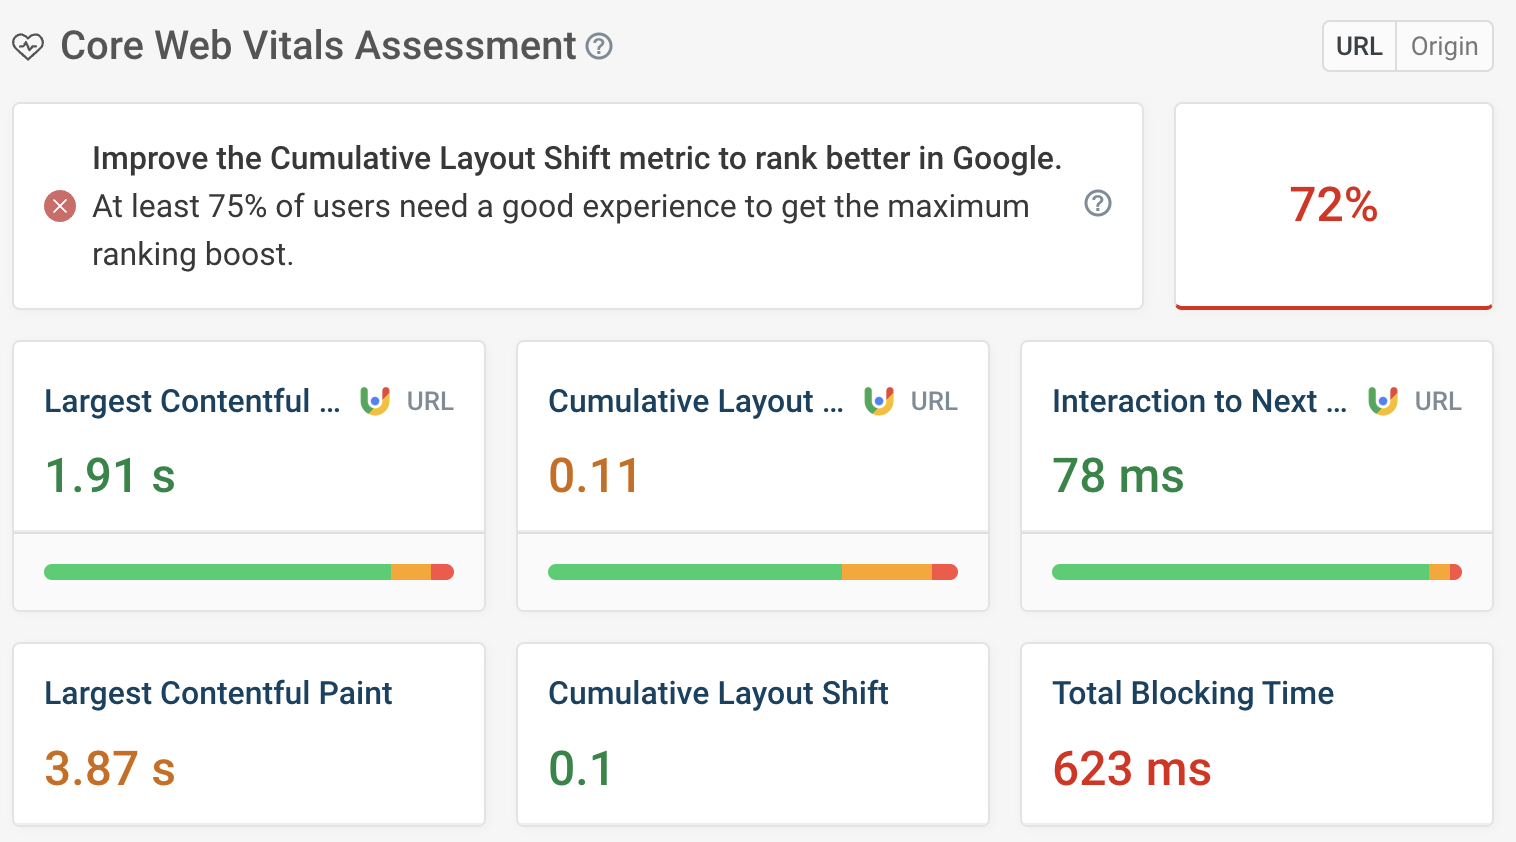
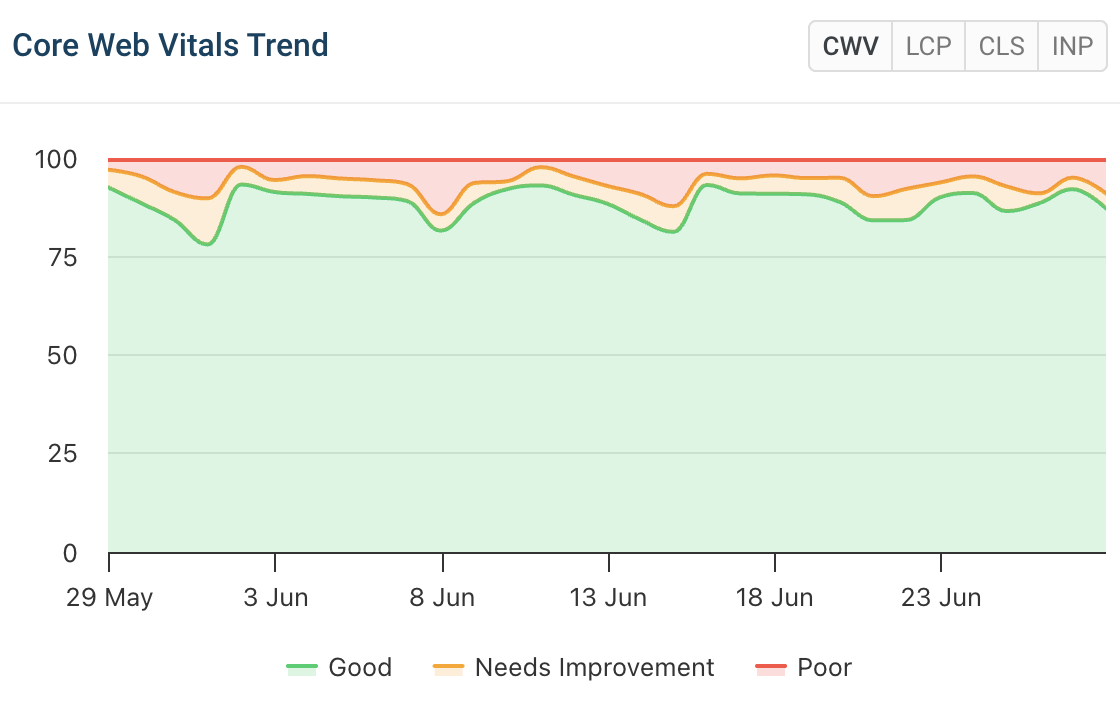
Optimize Core Web Vitals
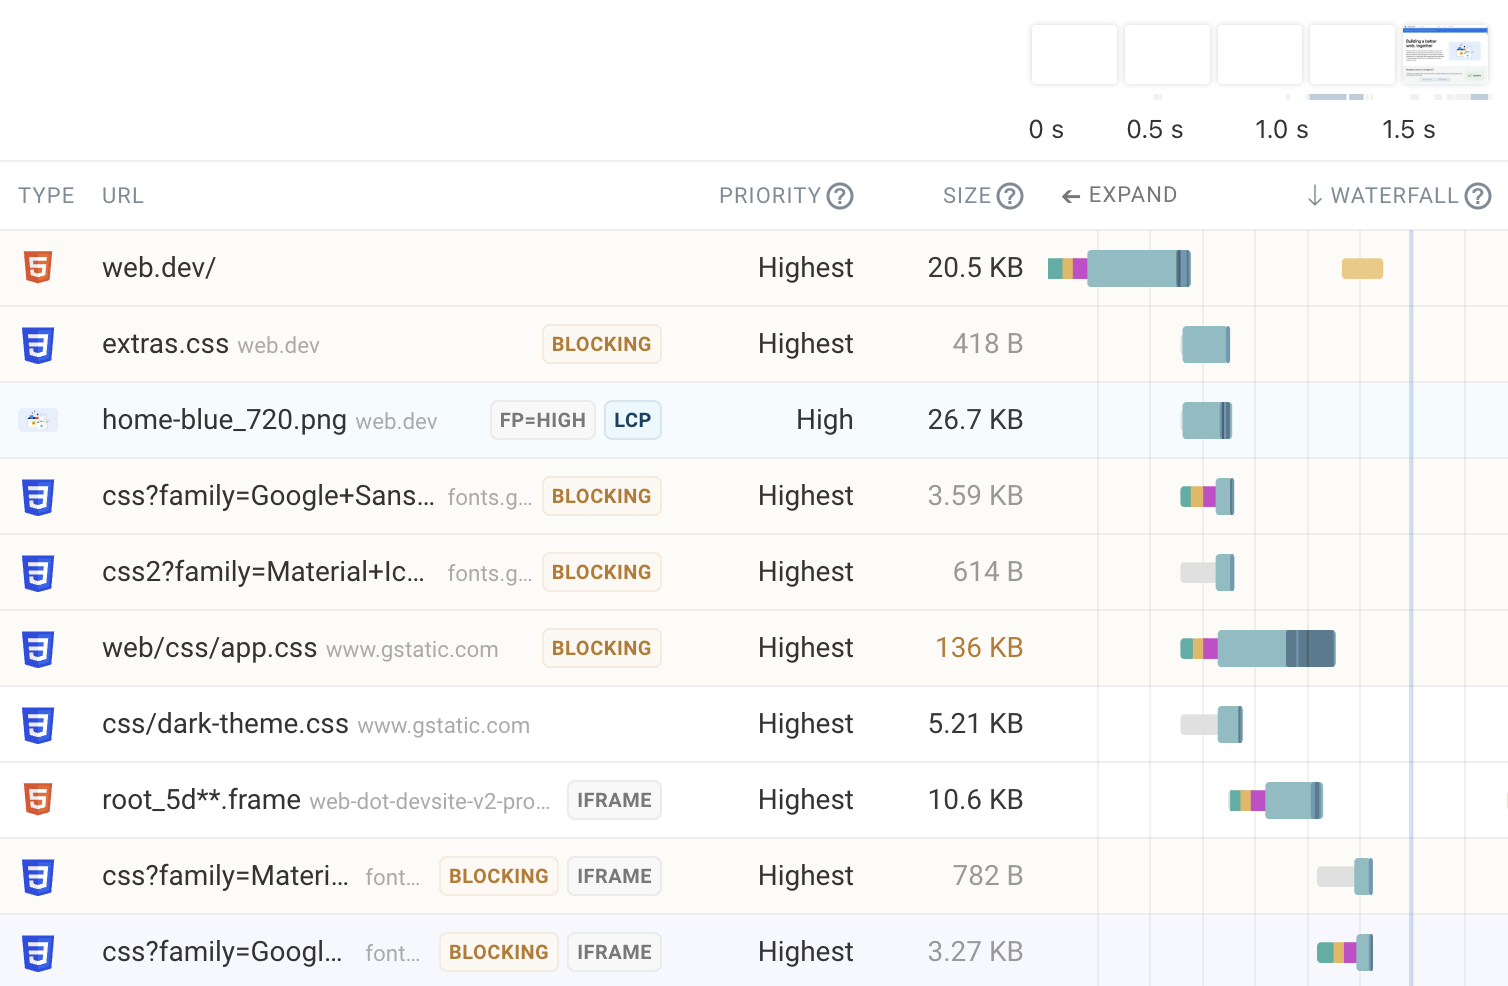
In-depth technical analysis
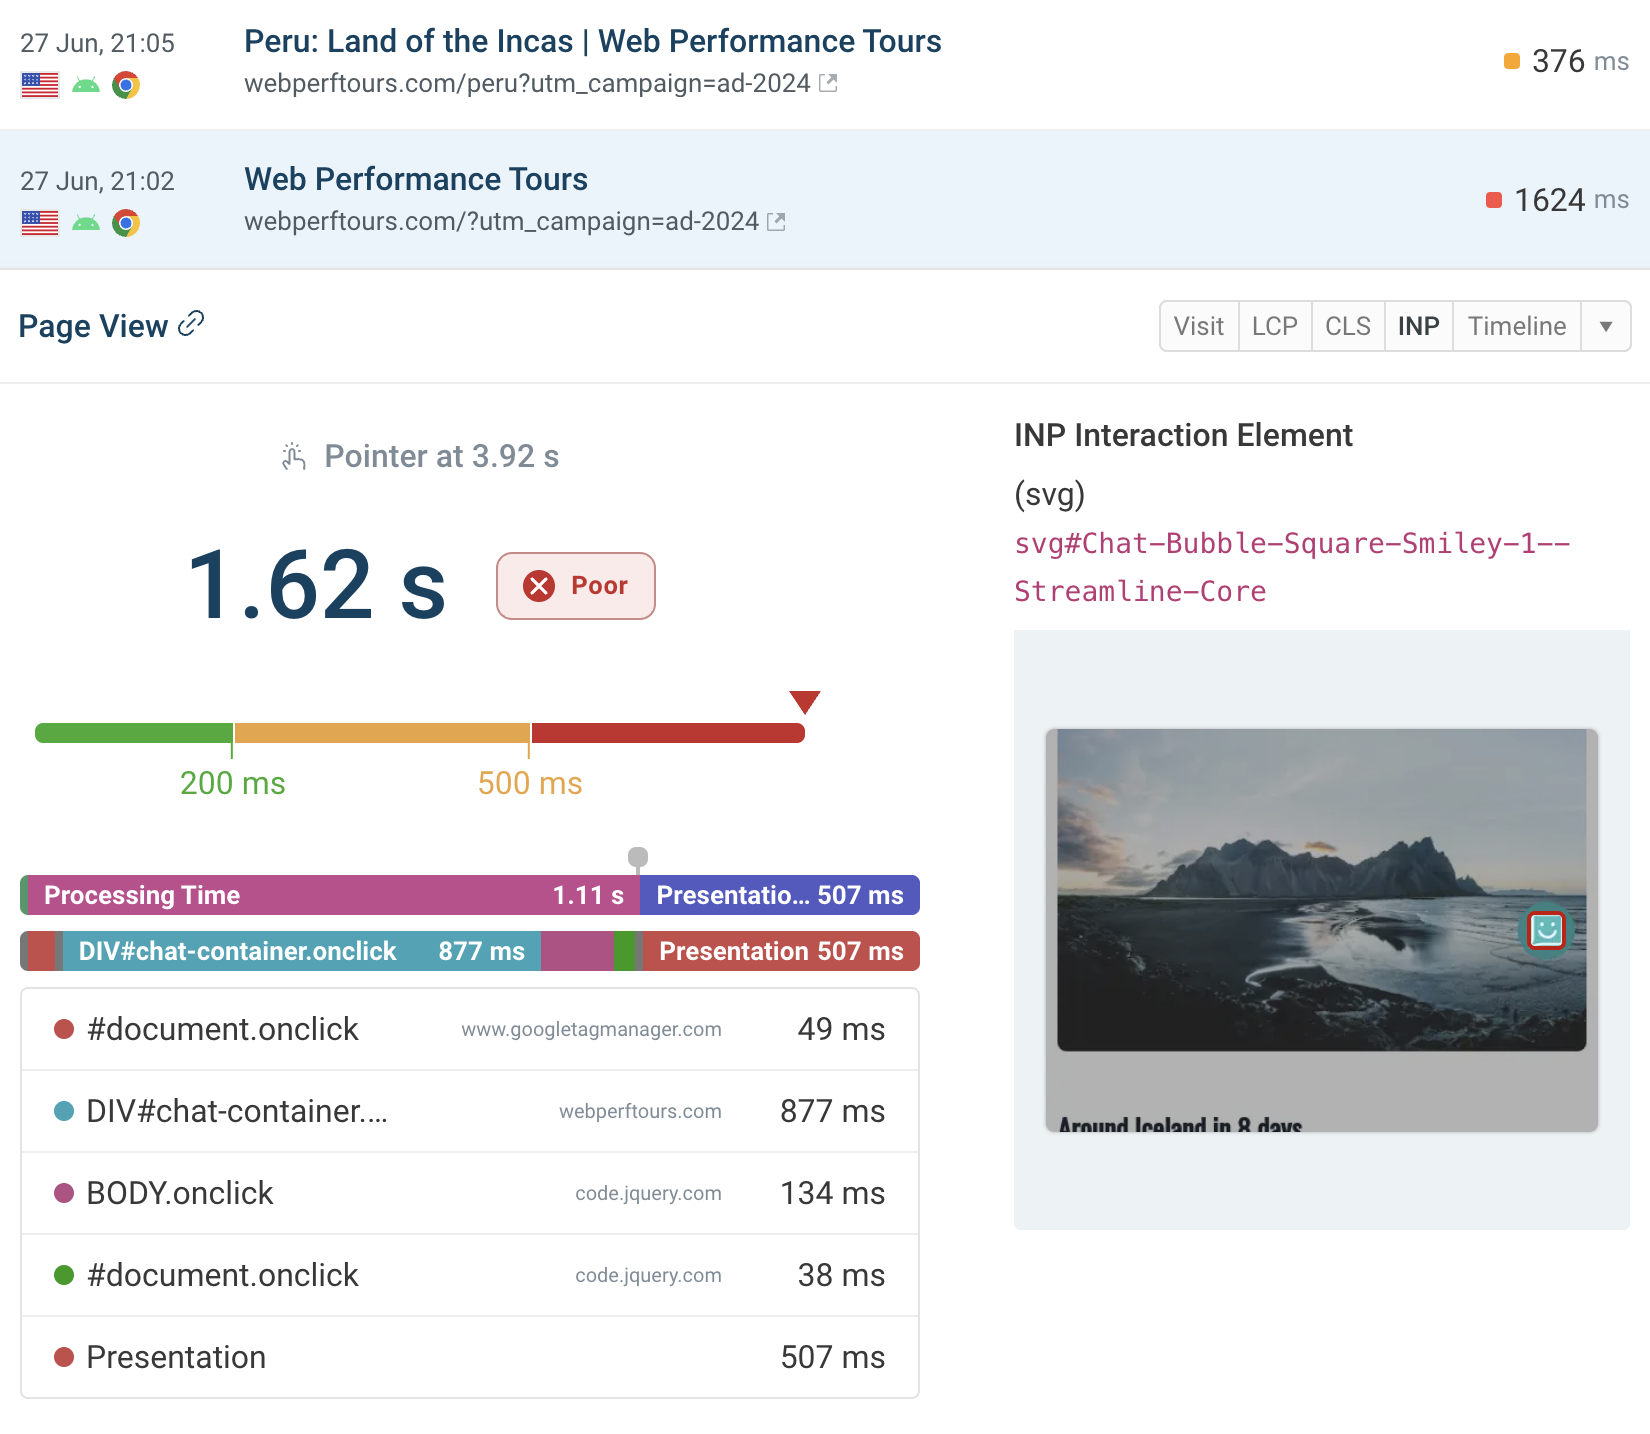
Improve slow interactions
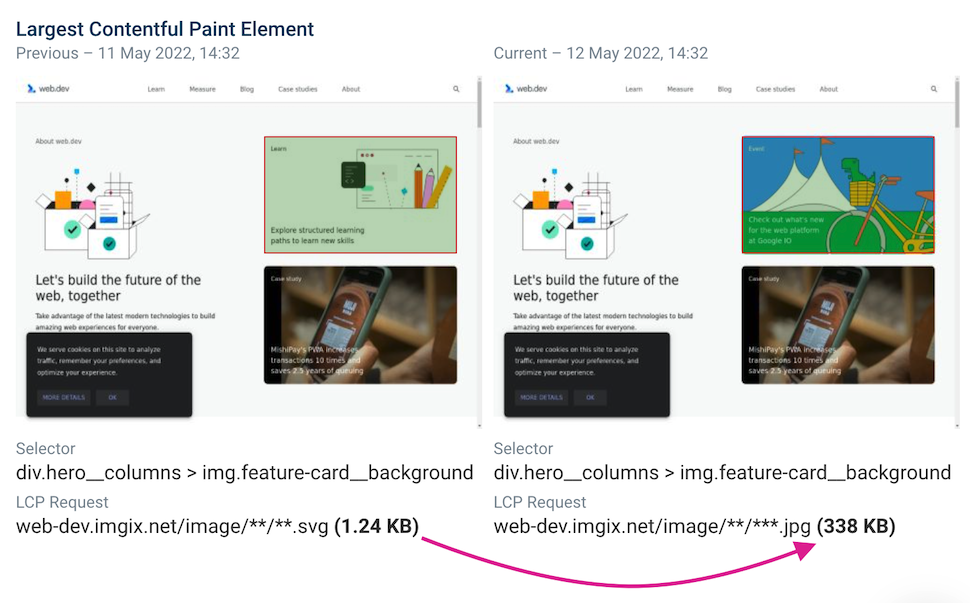
Catch and fix regressions
Communicate with clients and your team
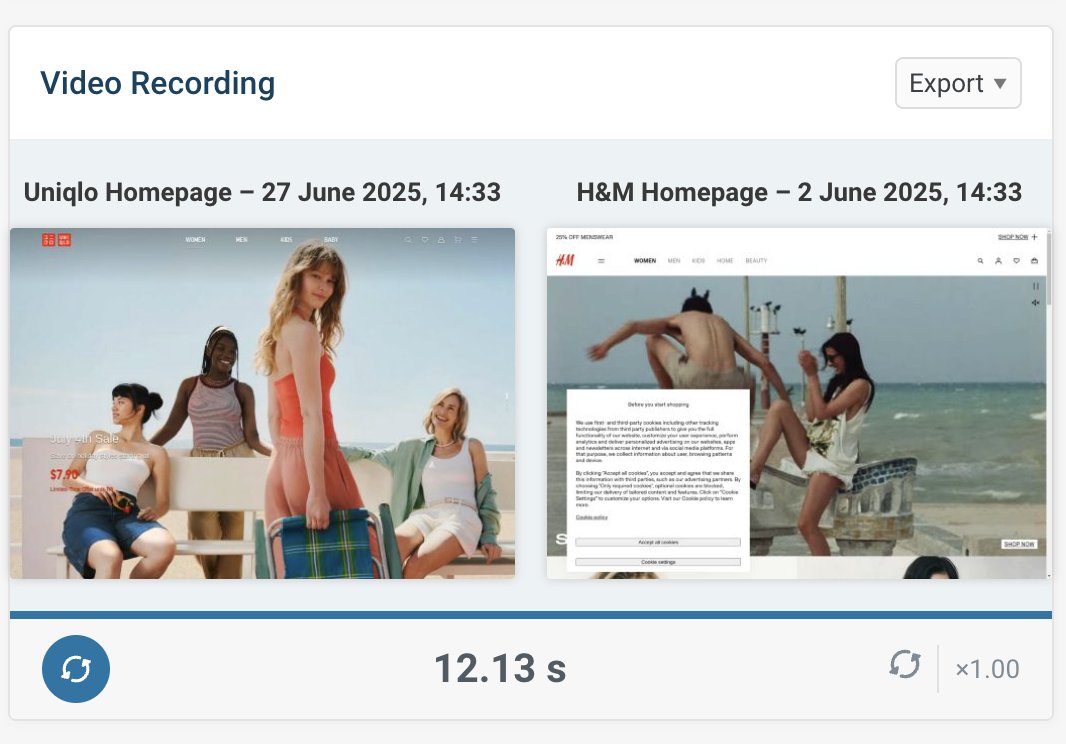
Video export
Demonstrate how visitors experience your website. Generate a side-by-side view with a competitor. Or share a before and after video showing the impact of your work.
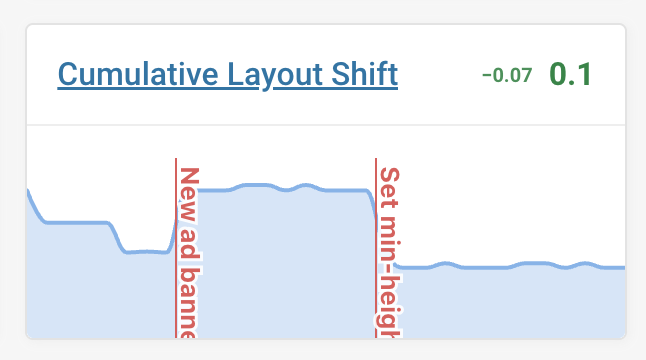
Chart annotations
Deployed a new version or added a new third-party? Mark this in your charts to clearly see the performance impact.
Share page speed data
Export performance metrics or share a link to your performance dashboard. Invite team members and clients to collaborate.
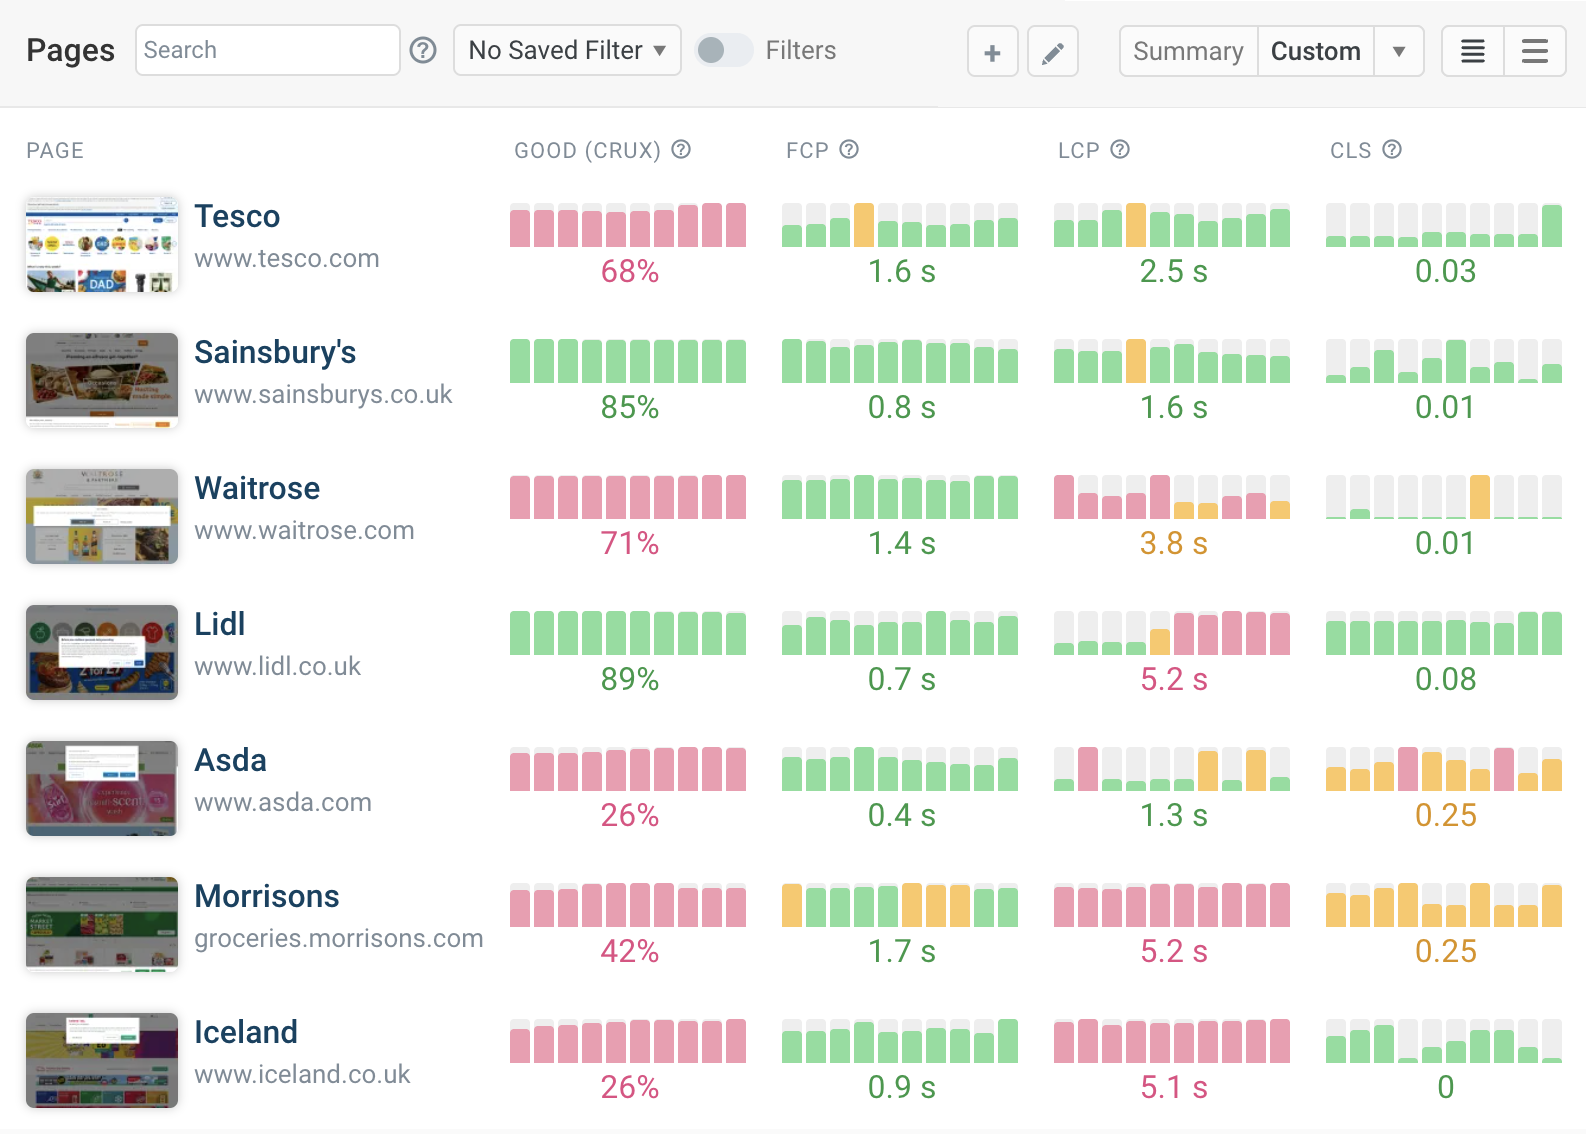
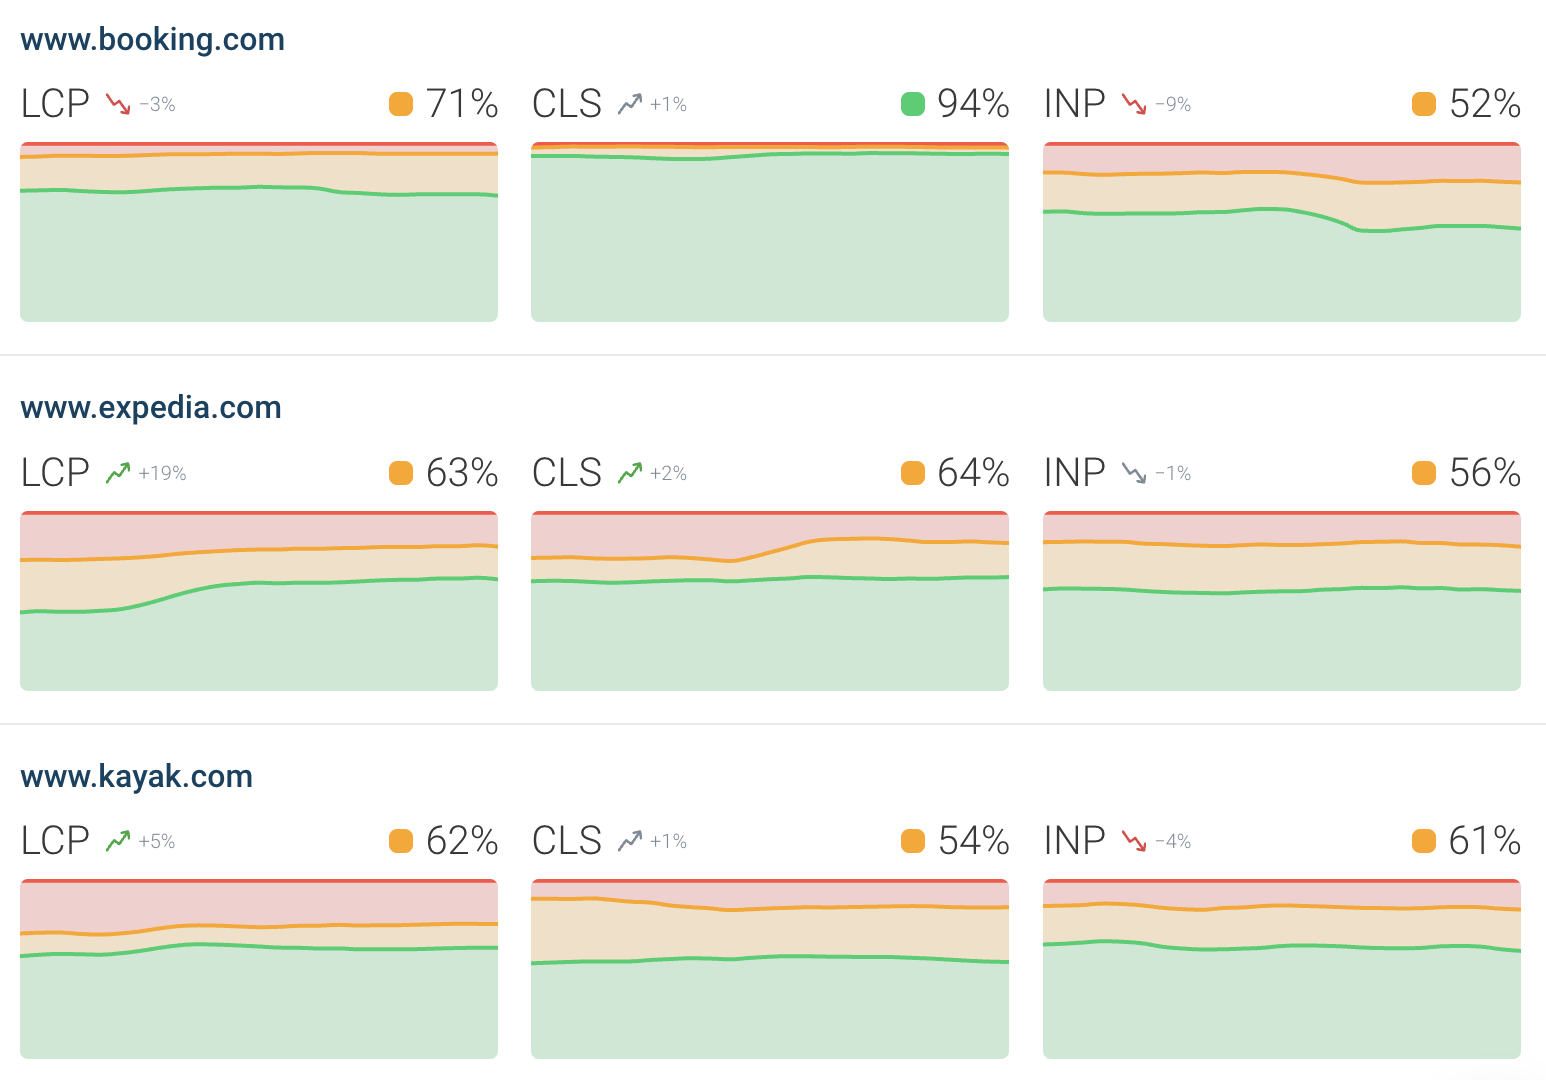
Benchmark within your industry
Why website performance matters to your business
Better Google rankings
The Core Web Vitals metrics are a Google ranking factor. Pass them to get more organic traffic.
Happier users
Deliver a stellar experience to visitors and make them happy to come back.
Hear from our users


You are using an old browser that is not supported anymore. You can continue using the site, but some things might not work as expected.