
Government websites are some of the most widely used digital platforms in the world. They serve as the primary gateway for citizens to access essential information, complete administrative tasks, and interact with public services. Nearly everyone relies on these sites at some point in their lives.
These services must be fast, accessible, and easy to navigate, ensuring that users of all backgrounds and abilities can complete tasks efficiently without frustration. Small delays can create significant barriers, especially when users are pressed for time or on slower connections.
To better understand how these sites perform, we analyzed 25 government websites from around the world.
We wanted to find out which website has the fastest Largest Contentful Paint (LCP), and to see what differentiates a fast government website from a slow one. Do all government websites follow best practices for site speed optimization?
Government Page Speed Rankings
We ranked all 25 homepages using real-world performance data collected by Google from Chrome users visiting these sites. This data, known as the Chrome User Experience Report (CrUX), reflects what actual visitors experience.
The metric we focused on is page load time, specifically how quickly the largest content appears on screen, also known as LCP.
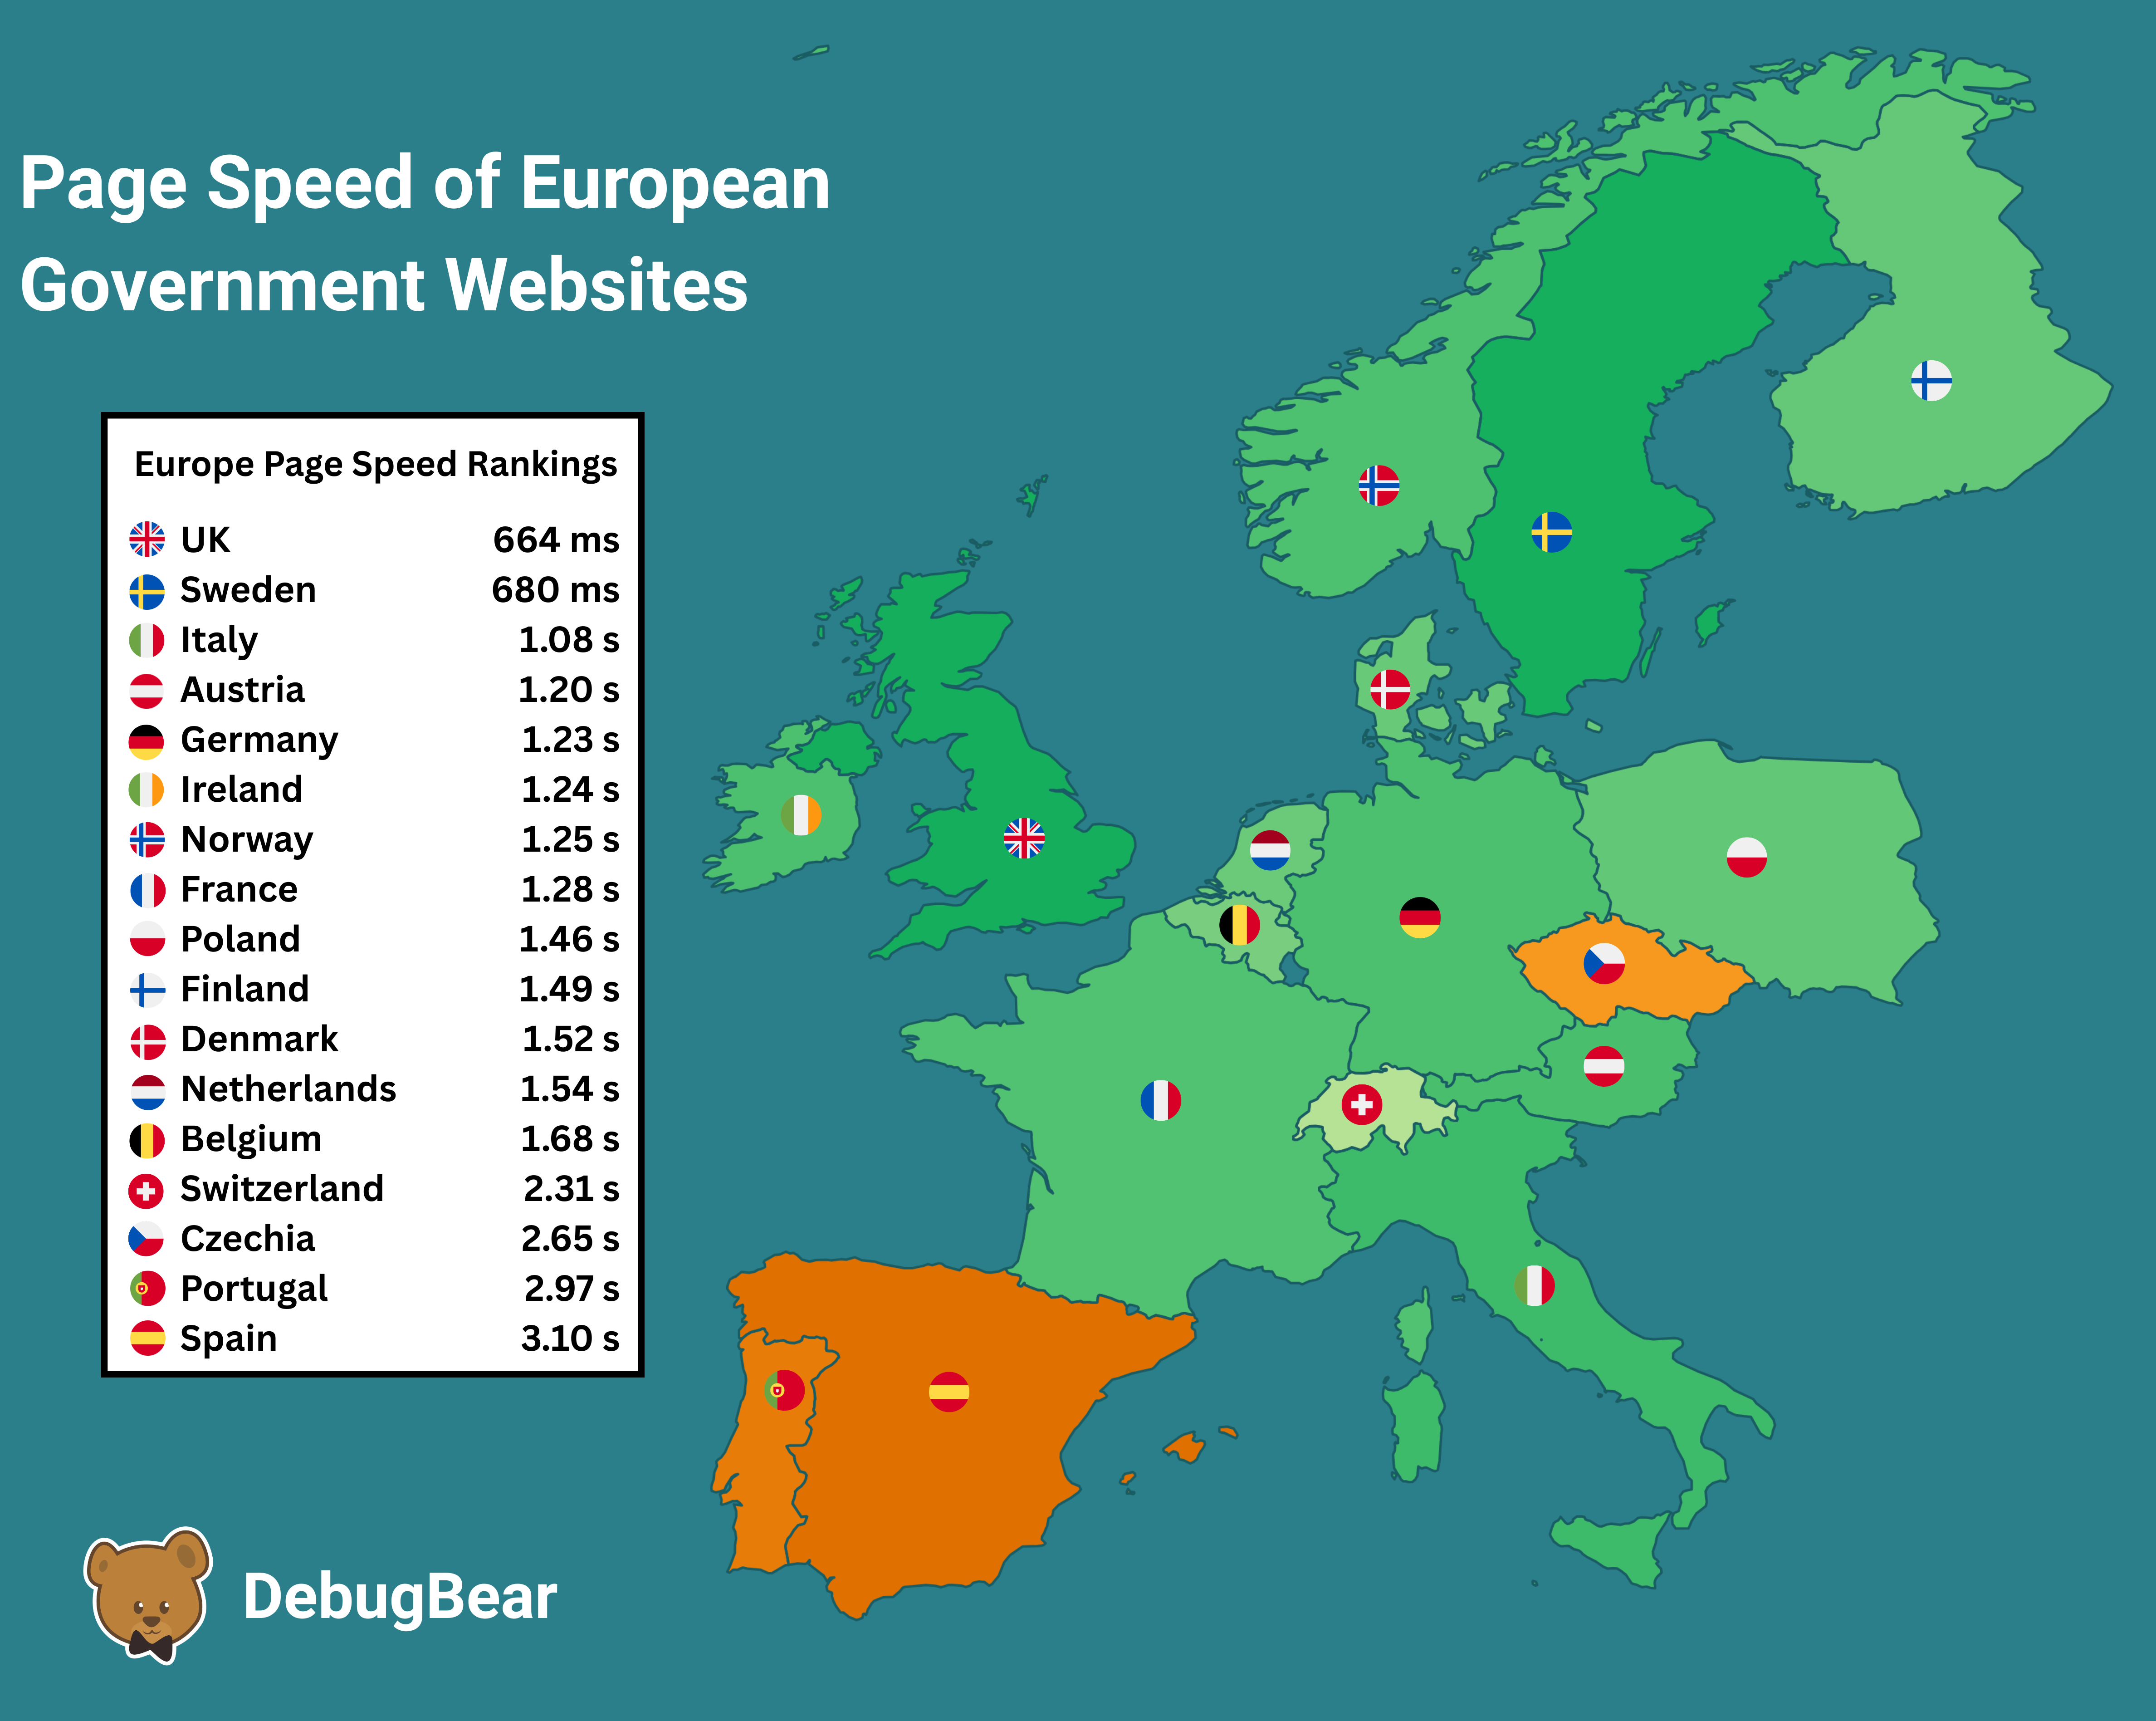
We visualized the European websites on our ranking with a map. The UK sets a high standard, with an LCP score of 661 ms, significantly inside the good range of 2.5 seconds. The majority of countries are also within the good range, though Czechia, Portugal and Spain are just outside the good threshold, while Sweden performs noticeably worse.
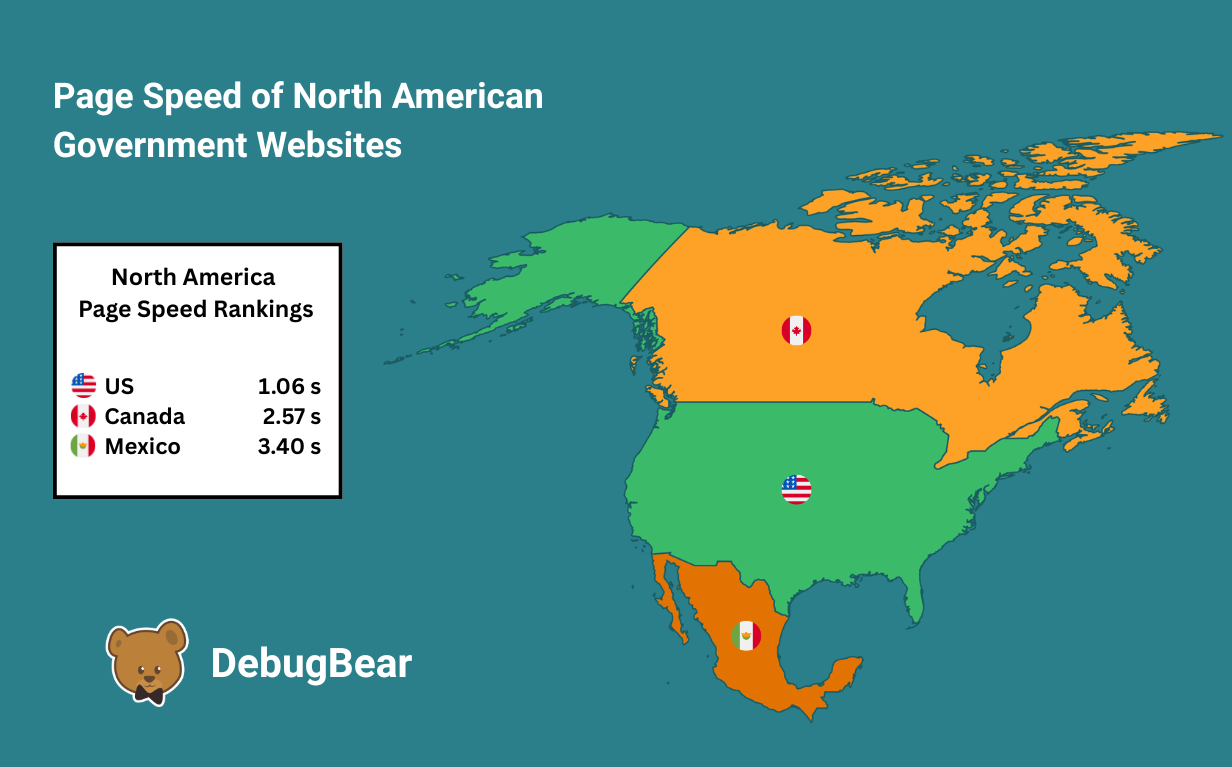
In North America, we see the US with the fastest government website, which takes just over 1 second to load.
Canada's website takes more than twice as long to load, and Mexico gets an LCP score of 3.4 seconds.
Top 10 Performing Websites
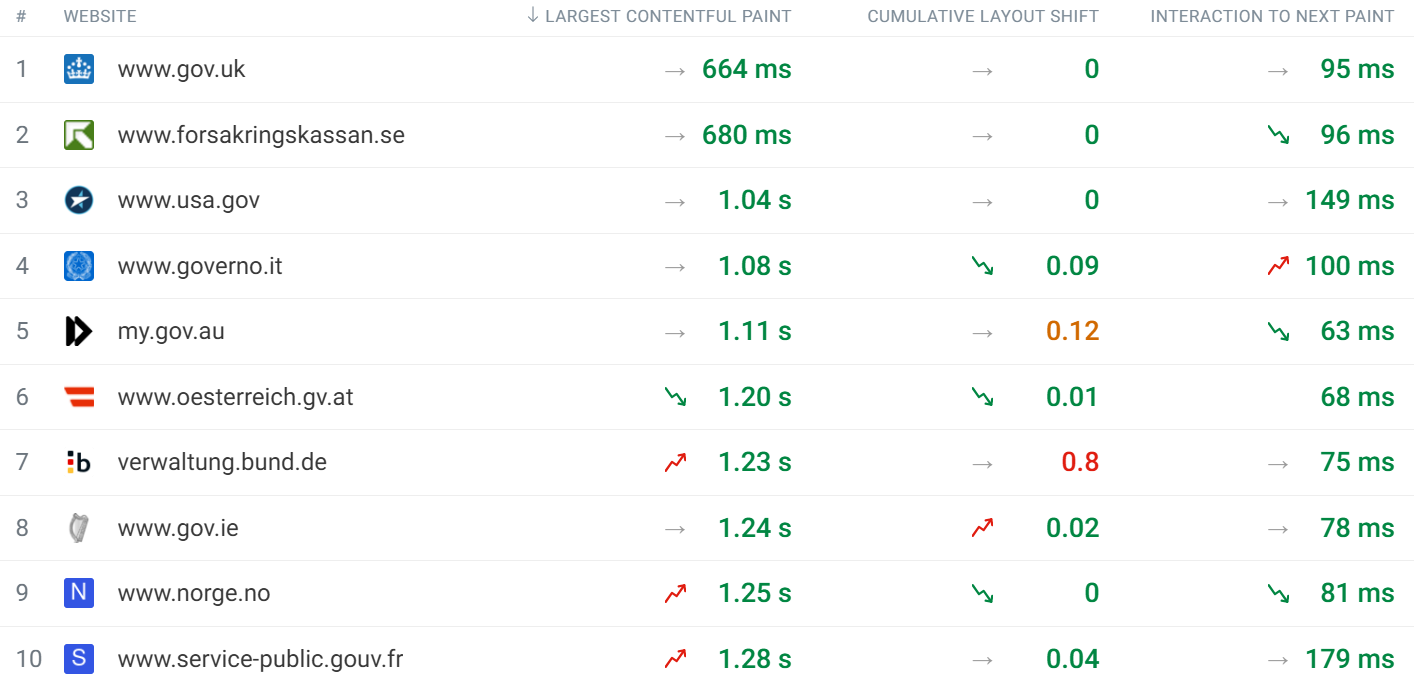
Below we can see the top ten performing websites. The table also shows the other Core Web Vitals: Cumulative Layout Shift (CLS) and Interaction to Next Paint (INP).
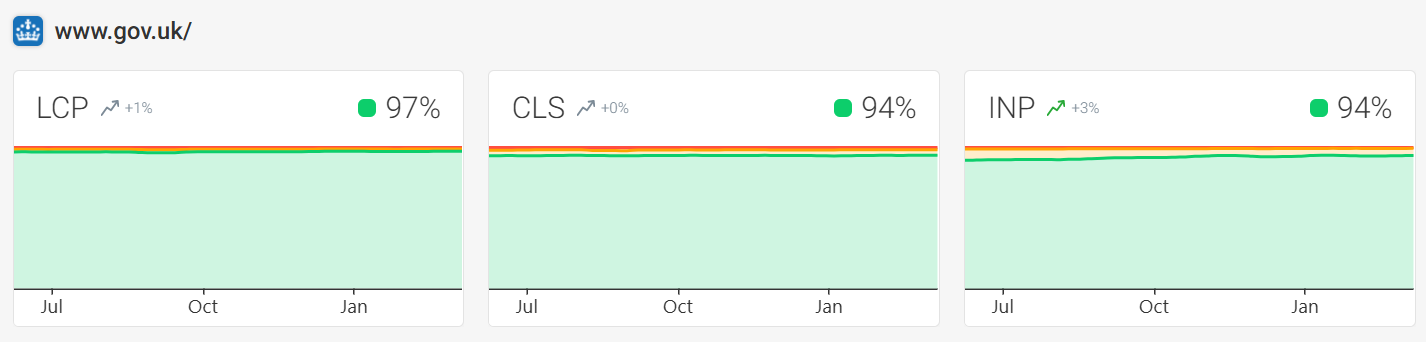
The UK gets a CLS score of 0, which means most users don't experience unexpected content shifts on the page. The INP score of 95 ms indicates that the site responds quickly to user interactions. It would take a significant regression in any of these metrics to push them out of the "good" range defined by Google.
All of the top ten websites have an LCP score of under 1.5 seconds, as well as INP scores under 200 ms, indicating that these websites are fast and responsive.
Bottom 10 Performing Websites
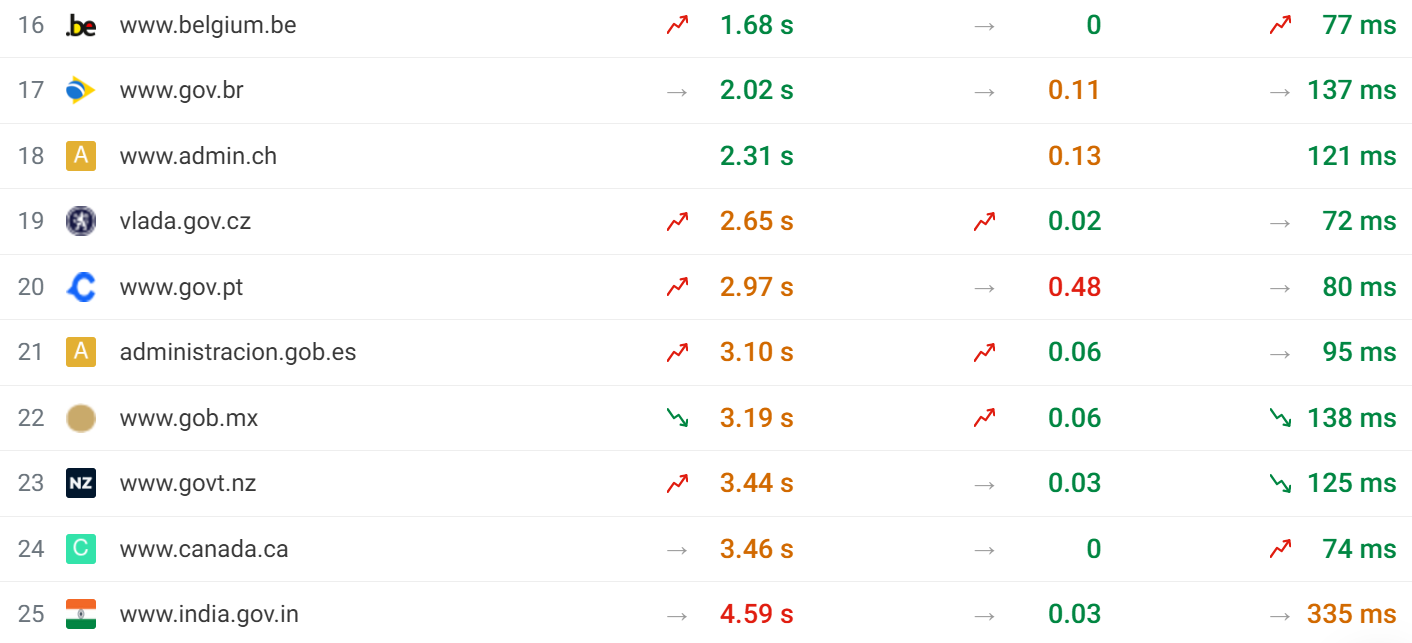
The bottom ten performing websites tell a different story. We can see 8 websites that are outside of the good threshold, with India being in last place with a score of 4.60 seconds, pushing it into the poor range. Visitors to these websites could ultimately have a more frustrating experience compared to the top performers.
Since this is real user data, it's worth keeping in mind that page speed also depends on the devices and network connections of the visitors coming to each country's website. A country with many rural internet users on slow connections will struggle to provide a fast experience for everyone.
Check out the full government website ranking. We've also created industry dashboards for a number of other sectors.
What makes gov.uk the best?
It's not only the UK's LCP score that is impressive. The site performs to an extremely high standard across all of the Core Web Vitals.
Matt Hobbs, former Head of Frontend Development at the Government Digital Service, has shared valuable insights into what makes gov.uk so fast. In his perf.now() 2023 presentation, he discusses the strategic decisions made in the early 2010s when the UK government made a big push to improve their online services.
Back then, public service websites were vital but not used as much as today. But with smartphones and mobile data becoming increasingly popular, the UK government decided to get ahead of the trend, focusing their effort on making these services accessible to as many residents as possible—particularly given the lack of mobile coverage across much of the UK.
From 2012 to 2017, gov.uk replaced 1,884 government websites with a single destination, featuring a stripped-back "mobile first" design, even on desktop.
Back when the redesign was launched, 80% of the visits were on desktop and the change was met with some criticism. Still, the bold move was the right choice and the website has won awards for design since.
Along with the redesign, the team focused their efforts on data compression to deliver resources faster, and most notably utilized Content Delivery Networks (CDNs) to maximize Time To First Byte (TTFB) speed. The UK also placed in first position for TTFB, with a score of 257 ms.
Why the US is second to the UK
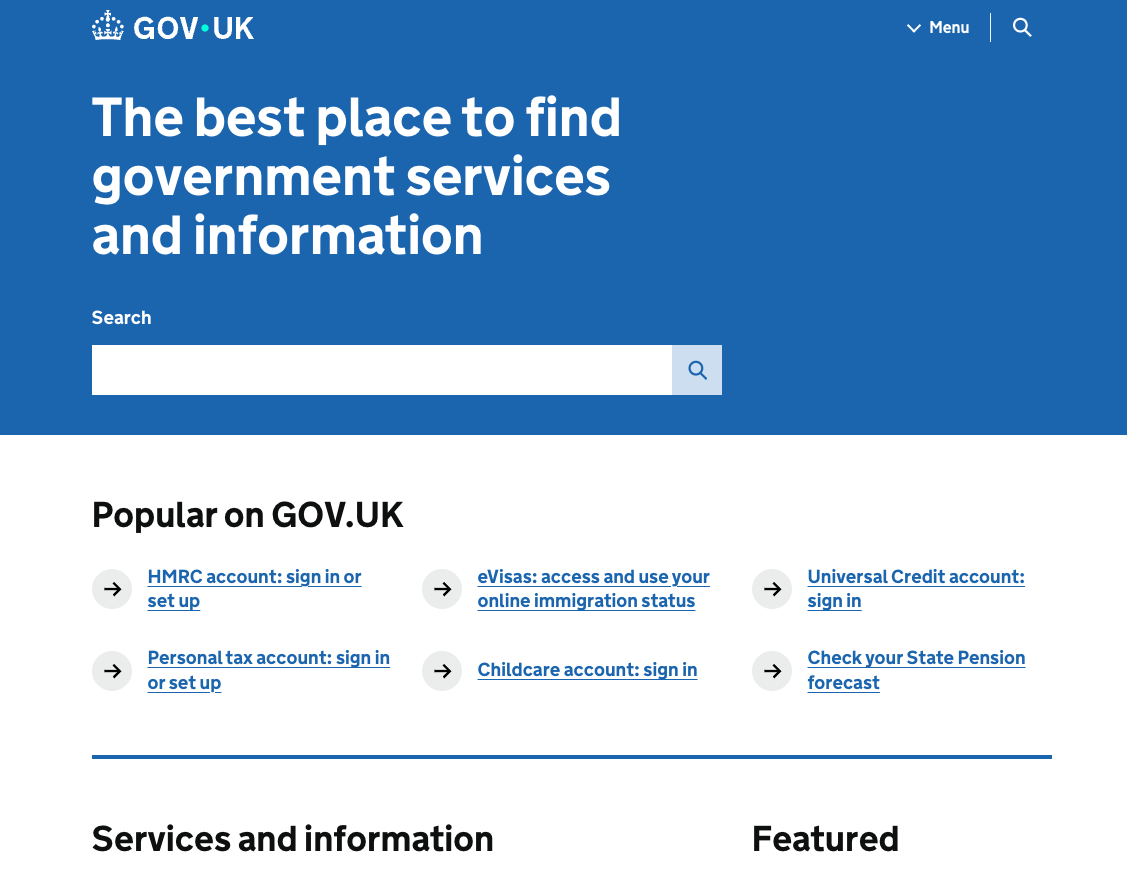
When comparing the UK website to the US, there's one main distinction between the LCP scores. As we mentioned before, the UK opted for a mobile-first design, meaning mostly text elements, focusing on content being delivered to the user faster.
The US website is ranked second in terms of LCP CrUX data, with 75% of visitors experiencing an LCP score of 1.04 seconds. Although this is a very good score, it's quite some way behind the UK's score of 661 ms.
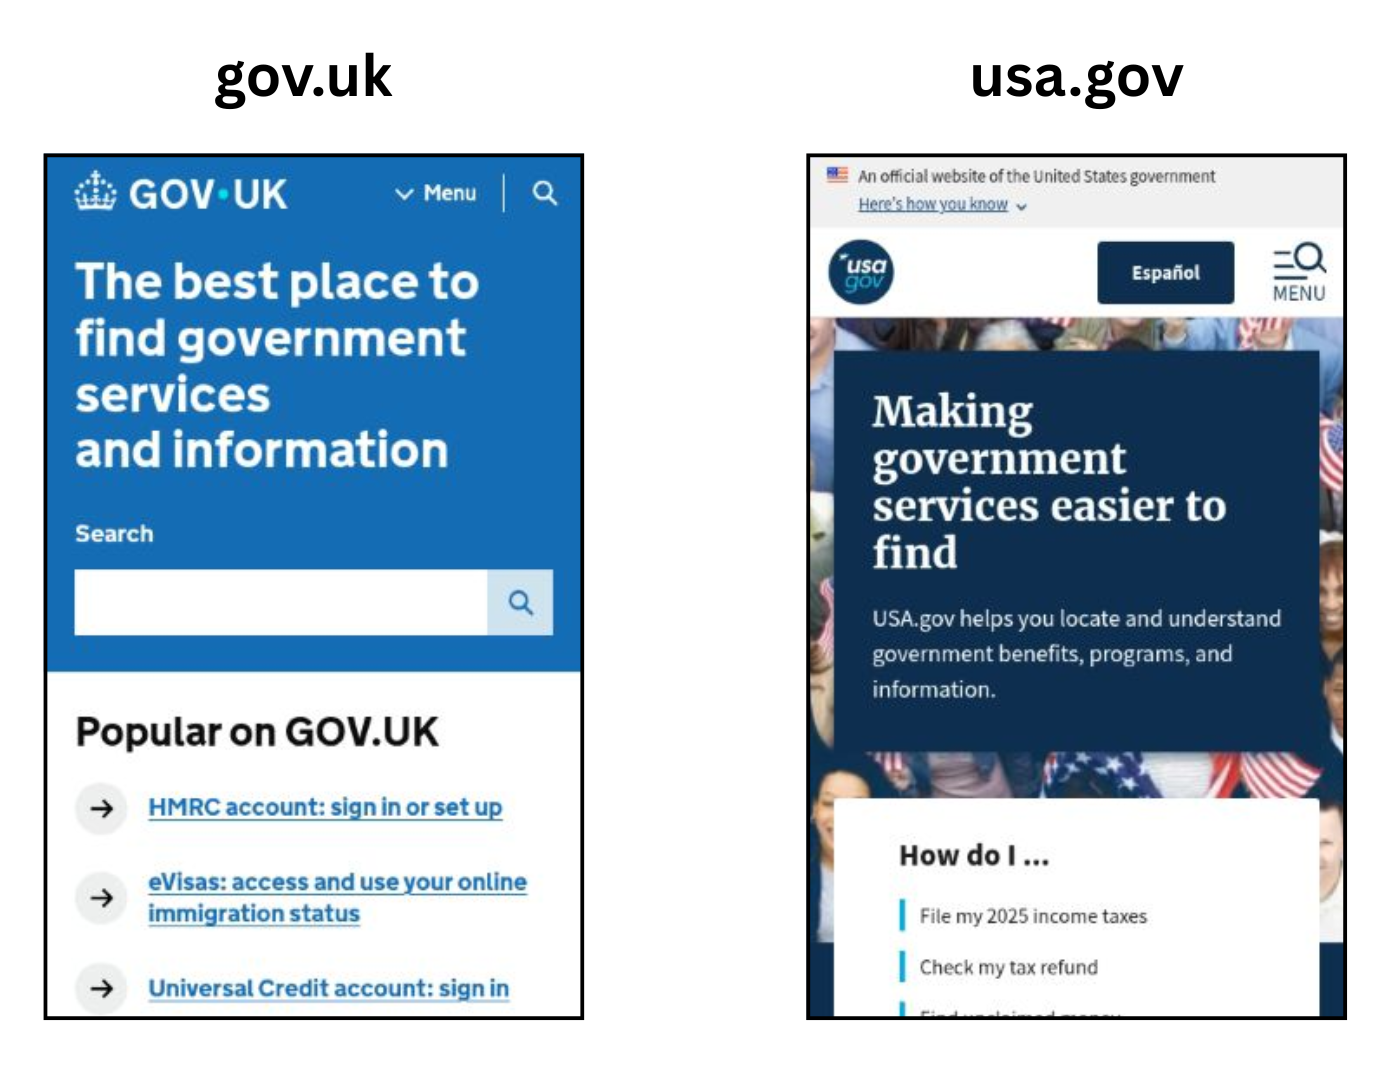
The designs are similar, as you can see in the side-by-side comparison below. However, with the background image rendering later on, the US website has a slower LCP than the UK's text-based approach.
Other factors contribute as well. The US page has a larger CSS file of 88kb which adds render delay. There's also a higher TTFB. Overall, the combination of CSS, image rendering, and server response time causes the slower LCP score.
Why is Sweden the slowest European website?
This analysis originally focused on sweden.se, a tourism website for Sweden. The updated list has been expanded to also include forsakringskassan.se, Sweden’s official government website.
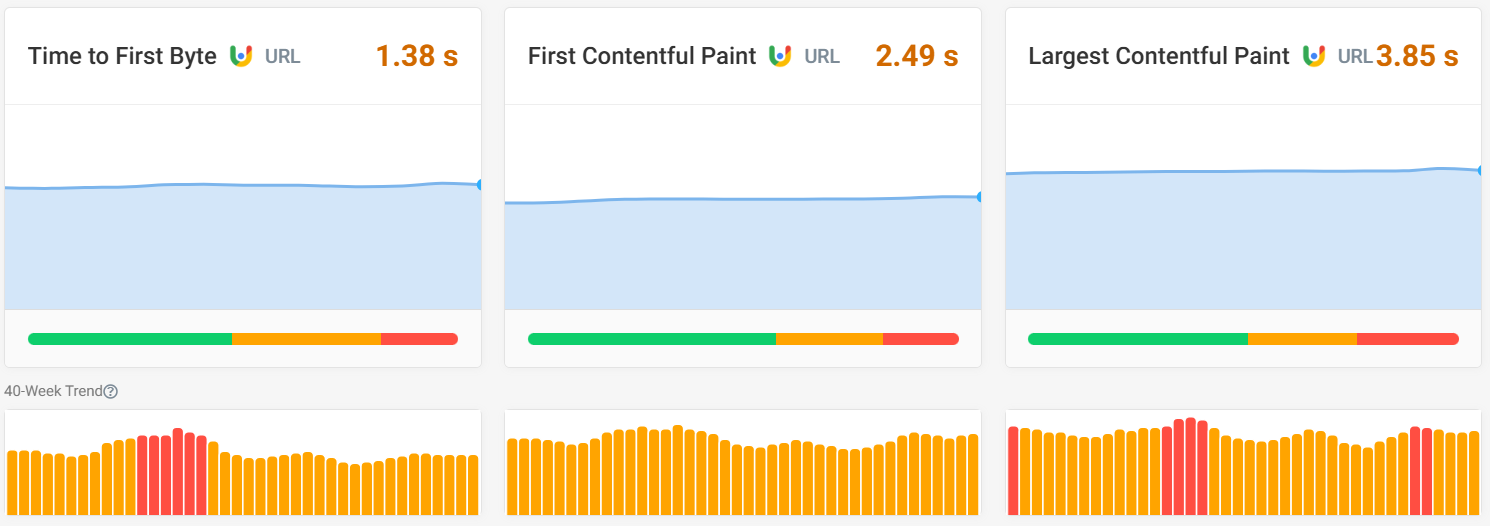
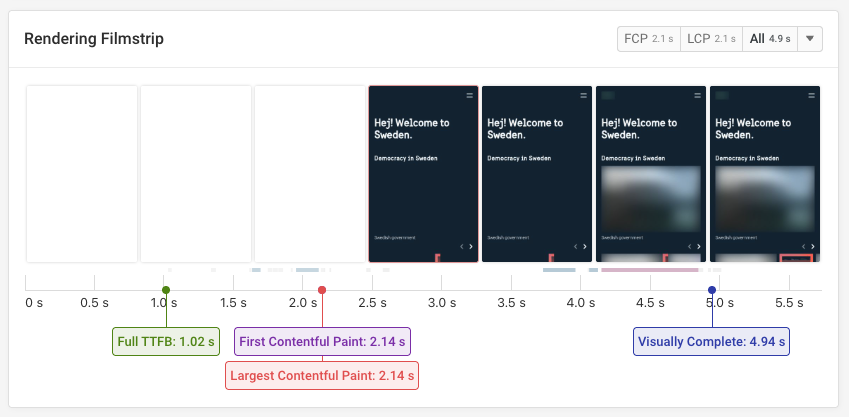
Sweden's poor score is mostly down to their slow TTFB, with the highest value from the 40-week trend drifting into the poor range at 1.99 seconds. The website is built using the Next.js JavaScript framework. The slow TTFB combined with client-side rendering results in a slower First Contentful Paint (FCP).
A particular issue on the website is the combination of partial server-side rendering combined with a dependency on client-side JavaScript. We can see that the server-rendered heading on the page appears relatively quickly. However, this initial version of the page only shows a low-resolution blurry version of the LCP image. The full image only appears after the client-side JavaScript code has run.
One quick way to fix this is to ensure the loading="eager" React prop is set on the <Image> component.
What makes the worst performing websites slow?
There are no consistent trends in what's causing slower LCP scores for the slower pages. With India being the only country scoring in the poor range, we may expect to see a slow TTFB. Yet their TTFB CrUX value is 849 ms, which is borderline but still allows for good LCP scores if handled correctly.
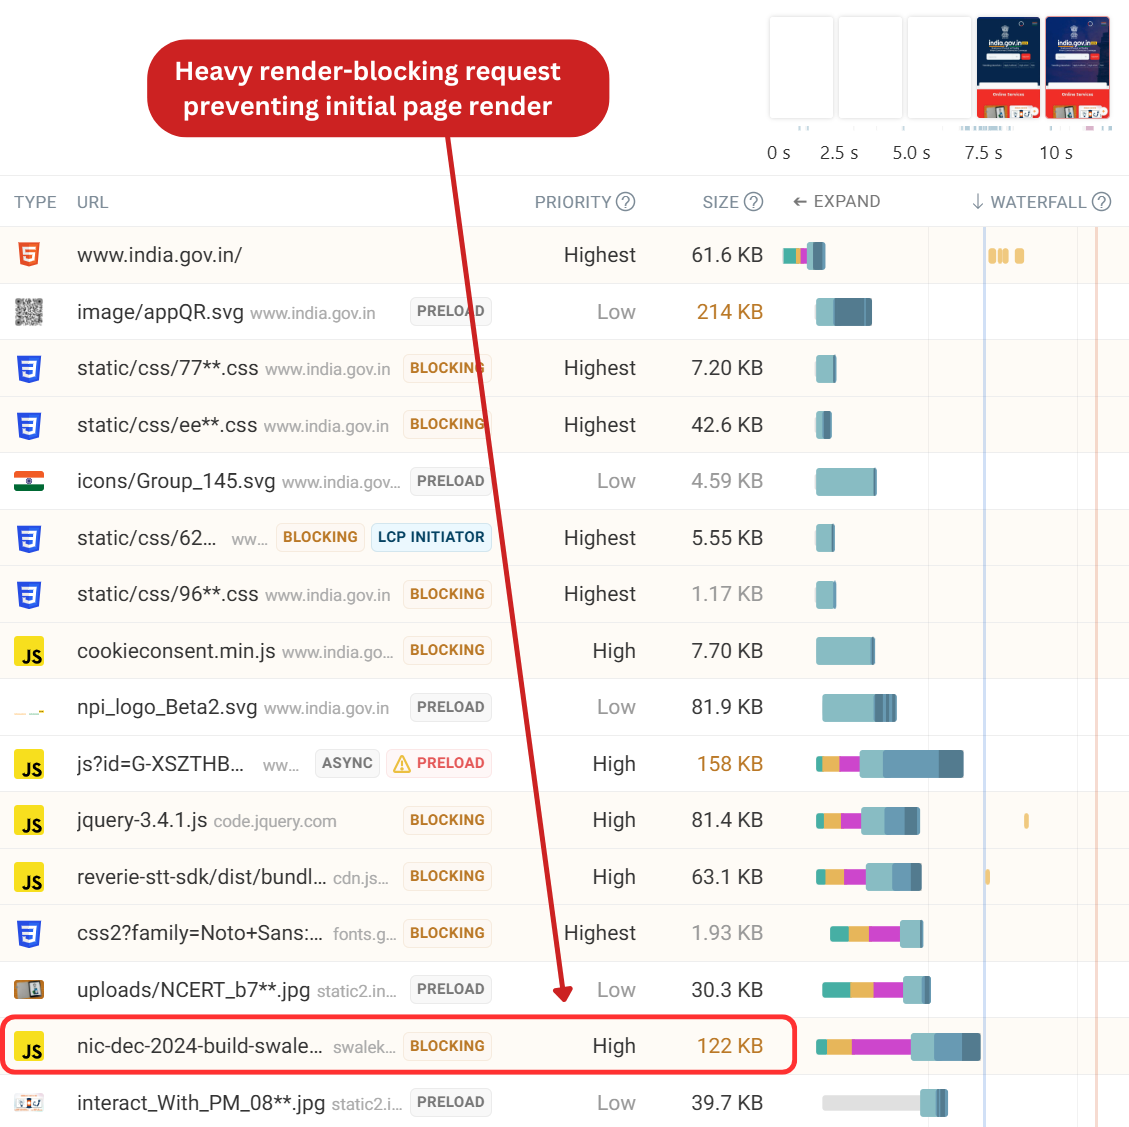
The CrUX data shows Render Delay being the main issue. Our lab test results show that the LCP request chain holds back the image from rendering on the page. The LCP element is a background image, which means the browser can only discover the image once rendering begins. Unlike a regular <img> tag, the URL isn't visible in the HTML.
This is why render-blocking requests matter so much in this case. For example, we can see a heavy JavaScript request that finishes late, delaying the start of rendering and, in turn, the discovery of the background image. By optimizing the render-blocking requests and preloading the LCP image, India would almost certainly not place last in our ranking.
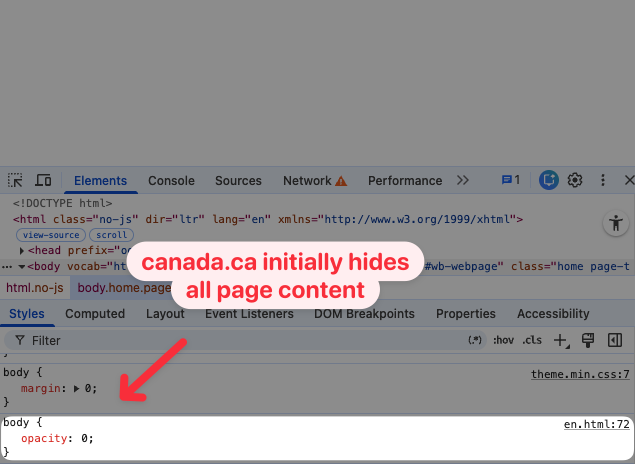
Canada has the second fastest TTFB of the 25 pages tested, at 185 ms. However, the main page content takes 3.46 seconds to load.
The issue is that they are hiding content with CSS until later in the page load, which means visitors have to wait longer before they can see content.
Accessibility
Accessibility is important for government websites because it ensures that all citizens, including those with disabilities, can equally access essential information and services.
Eleven of the government websites we tested scored 100 on Lighthouse's accessibility metric, with another 8 scoring in the good range (90 to 100).
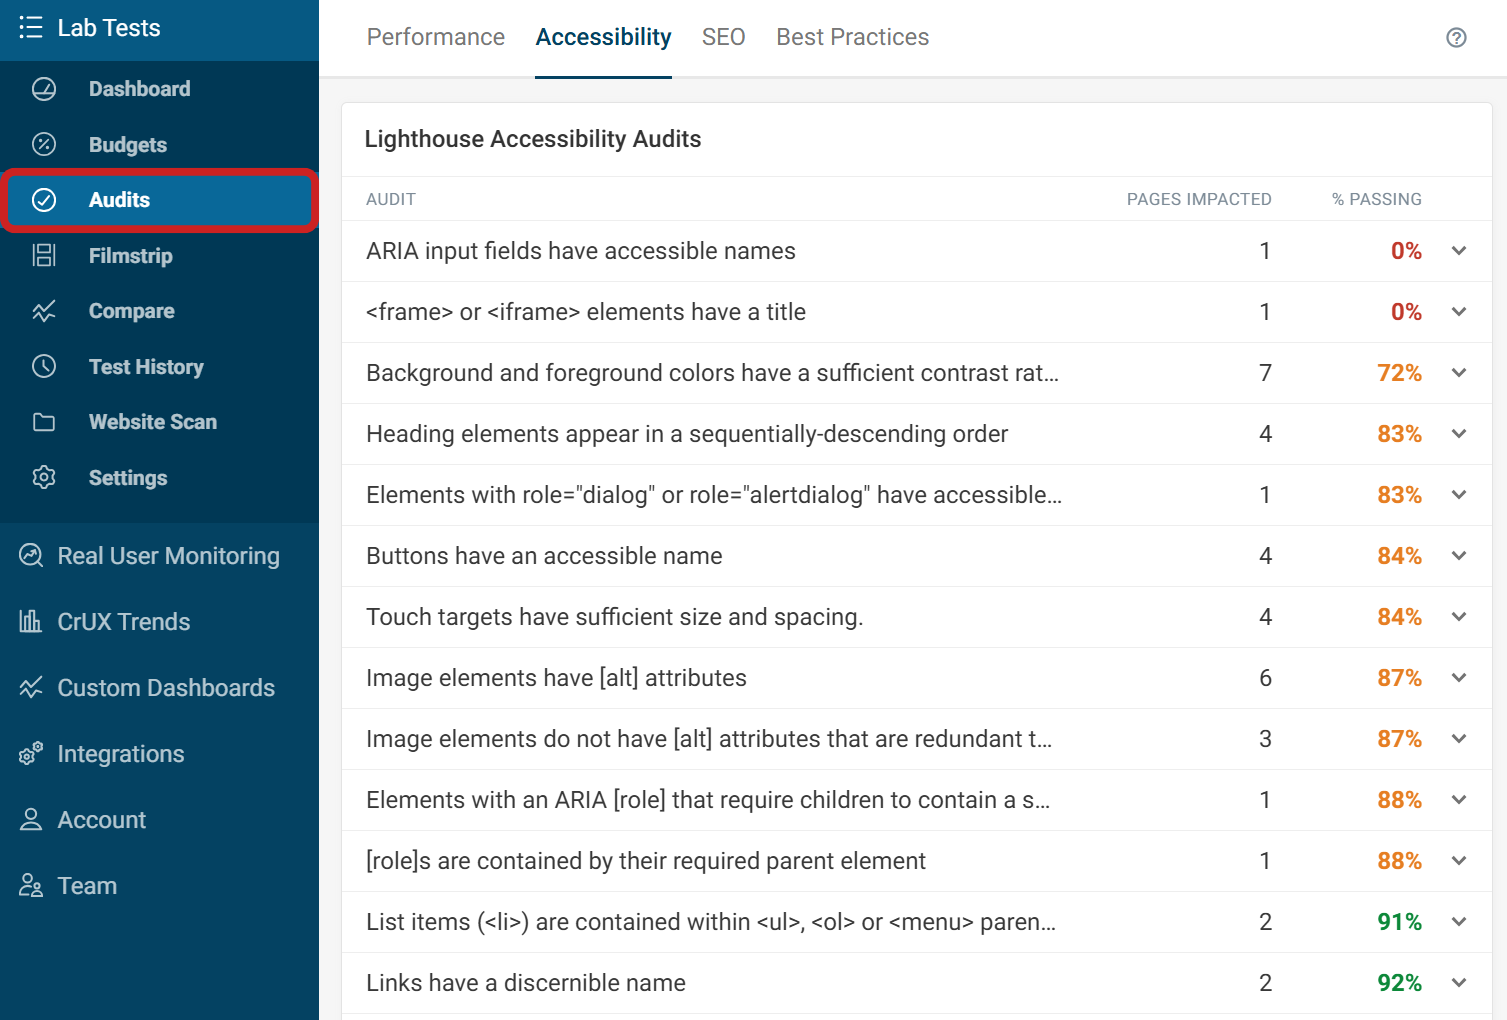
The remaining websites score in the needs improvement range, with the worst being Italy with a score of 72 and South Africa with a score of 73. Both of these websites lack alt tags for their images and struggle with contrasting colors. Italy specifically fails on multiple image alt text audits and has buttons without accessible names, while South Africa has similar issues with missing alternative text and insufficient color contrast on interactive elements.
A great way to view which Lighthouse audits are passing or failing is by viewing the Aggregate Audits Report and selecting the accessibility tab.
Conclusion
The success of gov.uk is the result of a well-executed long-term plan: a mobile-first design approach, strong CDN investment, and consolidating services into one streamlined platform.
The encouraging part is that most of these websites perform well enough to serve their purpose. For the slower sites, the fixes are often straightforward: optimizing images, reducing render-blocking resources, improving server response times.
Government websites are essential infrastructure, used by millions of people in varying conditions, including those on slower connections or older devices. Performance becomes a matter of accessibility. Faster sites are simply more inclusive.
To test your website, try our free website speed test or start monitoring your Core Web Vitals with a 14-day free trial.


Monitor Page Speed & Core Web Vitals
DebugBear monitoring includes:
- In-depth Page Speed Reports
- Automated Recommendations
- Real User Analytics Data