CLI
Getting started
To get started, globally install the debugbear Node module and generate an API key. You'll also need to know the ID of the page you want to test.
Read more about getting set up.
Running a normal test on the monitored page
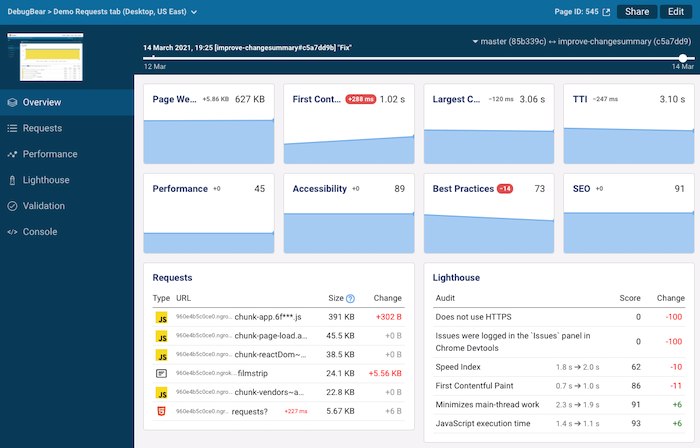
The command below will test the page and show it in the normal results view.
DEBUGBEAR_API_KEY=... debugbear --pageId=... --waitForResult
The output will look like this:
Repo: not specified
Commit: not specified
When the result is ready you can see it here: https://www.debugbear.com/viewResult/12345678
Waiting for result
Build complete
Running tests in CI
To run DebugBear as part of CI you either need to deploy the CI build to a public server or use a tool like ngrok to make the local server accessible.
If you customize a build it will not show up as part of the continuous monitoring of your live site, but will only show up as a build or on the branch. Customization could mean passing in a URL, tweaking the login details, or passing in custom headers. (This only applies if your test has a commitHash.)
The base build is either the latest daily monitoring result, or the latest build on a base branch, if --baseBranch is passed into the CLI and a build on that branch is available.
debugbear \
  --pageId=... \
  --commitHash=fd9aed3 \
  --commitBranch=my-feature-branch \
  --buildTitle="Commit message" \
  --baseBranch=master \
  http://deployed-branch.example.com
Often these options can be inferred using env-ci, so you usually don't need to pass in --commitHash, --commitBranch, or --buildTitle. To enable this feature pass in the --inferBuildInfo flag.

Running tests in CI with ngrok
If you aren't deploying your build to a staging server you can use your CI environment as one. You can use ngrok to expose your CI environment publicly.
When running debugbear, pass in the --ngrokWebPort=4040 option. This lets DebugBear find out the domain name of your server. The pathname will be taken from the monitored page, or you can use --path=/somewhere to override it.
Make sure to also pass in --waitForResult to keep your CLI server up until the test has finished.
You can read a more detailed how-to guide here.
CLI options
This is the full list of available CLI options.
| Option Name | Description |
|---|---|
| ...url | Override the URL that's tested |
| --pageId | Which of the pages in your project the tested page belongs to |
| --waitForResult | [CLI only] Don't exit CLI command until the test has finished |
| --inferBuildInfo | Infer commit hash, commit branch, build title, base branch, and base hash from the local version control environment and the environment variables of the CI system |
| --commitHash | Hash of the commit being built, used for build comparison and Github integration |
| --commitBranch | Branch that's being built, used for build comparison and Github integration |
| --buildTitle | Name of the build, defaults to the git commit message |
| --baseBranch | Branch to compare the commit to, usually something like master or develop (this only works if you previously ran a test on this branch using commitBranch) |
| --baseHash | Commit hash to compare the commit to |
| --repoOwner | Used for Github integration, username or organization that owns the repo |
| --repoName | Used for Github integration, name of the git repo |
| --ngrokWebPort | Port for the ngrok admin interface, usually 4040 |
| --path | Pathname of the page if different than what the --pageId page uses |
| --customHeader | Extra HTTP header to be sent for each request, formatted as headerName:headerValue. The node API uses a customHeaders object instead, e.g. {a: "b"} |
| --userFlowReplacement | Replace values in a user/setup flow, e.g change login details to your staging server. Formatted as search:replacement. The node API uses a userFlowReplacements object instead, e.g. {a: "b"} |
| --fail | Return a non-zero status code if the build status is failure. Use in combination with --waitForResult |
| --output | Save test result JSON with metrics to this file location |