Webhooks
Webhooks let you process every DebugBear test result on your own infrastructure.
For example, with webhooks you can:
- Store performance metrics in your own analytics solution
- Set the status of a build in your CI solution after the DebugBear test completes
How to set up a webhook
- Select Integrations in the sidebar
- Click Create Webhook
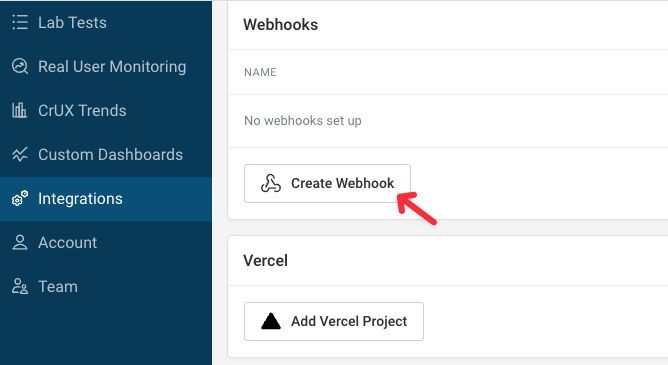
- Provide a URL where you can handle incoming
POSTrequests - Click Save
To test the webhook, go to a page in your project and trigger a one-off test.
Webhook data
For each test result, the webhook URL will receive a POST request with a JSON body like this one:
{
  "page": {
    "id": "123456",
    "url": "http://example.com",
    "name": "",
    "tags": [],
    "region": "us-east",
    "formFactor": "mobile",
    "NOTE": "Some page details omitted"
  },
  "event": "testComplete",
  "result": {
    "url": "https://www.debugbear.com/viewResult/52680/overview",
    "status": "failure",
    "budgets": [
      {
        "type": "maxValue",
        "value": 40238,
        "metric": "pageWeight.script",
        "status": "fail",
        "message": "19.8 KB over the budget of 19.5 KB",
        "threshold": 20000,
        "budgetName": "Budget 1",
        "metricTitle": "Page Weight (JavaScript)",
        "previousValue": 10238,
        "previousStatus": "pass"
      }
    ],
    "metrics": {
      "load": 233,
      "nodes": 11,
      "jsTime": 6.9,
      "cpu.other": 22.9,
      "cpu.total": 31.4,
      "seo.score": 0.67,
      "firstPaint": 138,
      "hints.count": 0,
      "html.errors": 1,
      "layoutCount": 3,
      "requestTtfb": 91,
      "console.logs": 0,
      "crux.cls.p75": null,
      "crux.fcp.p75": null,
      "hints.errors": 0,
      "requestCount": 3,
      "analysis.date": "2023-05-10T16:51:03.405Z",
      "console.other": 0,
      "cpu.parseHTML": 0.4,
      "html.warnings": 1,
      "thirdParty.ms": 0,
      "console.errors": 0,
      "cpu.styleLayout": 1,
      "outerHtmlLength": 329,
      "pageWeight.ajax": 0,
      "pageWeight.font": 0,
      "domContentLoaded": 233,
      "visuallyComplete": 132,
      "performance.speedIndex": 133,
      "performance.interactive": 233,
      "performance.totalBlockingTime": 0,
      "performance.firstContentfulPaint": 137,
      "performance.cumulativeLayoutShift": 0,
      "performance.largestContentfulPaint": 137,
      "NOTE": "Some metrics have been omitted"
    },
    "oneLineSummary": "Page Weight (JavaScript): 19.8 KB over the budget of 19.5 KB"
  },
  "project": {
    "id": "19064",
    "name": "New project"
  },
  "analysis": {
    "id": "52680",
    "baseHash": null,
    "isPrimary": true,
    "baseBranch": null,
    "commitHash": null,
    "commitBranch": null,
    "commitMessage": null
  }
}
The analysis.isPrimary property indicates whether the page test was run on the normal URL that's configured for scheduled tests. For example, if you use the API to test a feature branch on your staging server then isPrimary would be false.
Budgets will be included in the webhook body if performance budgets have been configured for the page.
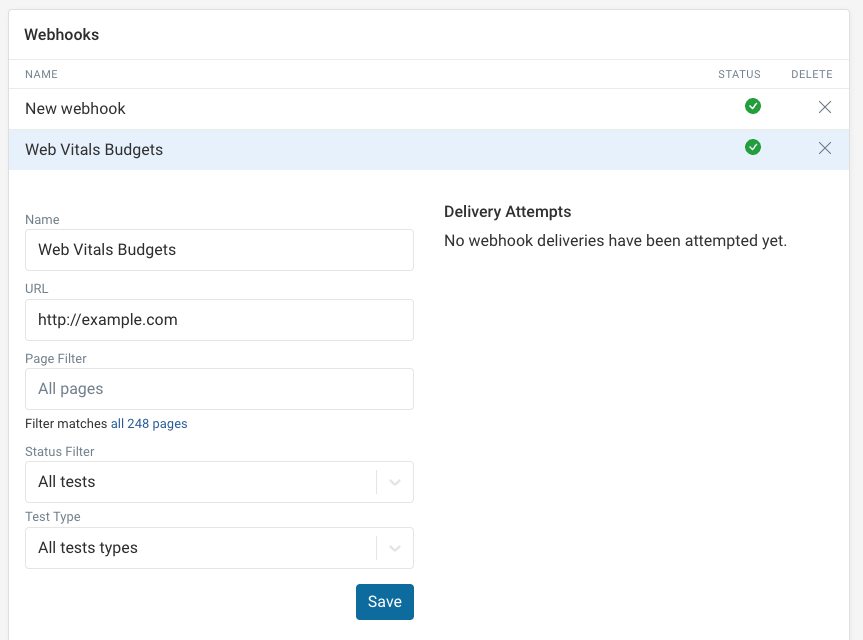
Webhook filters
By default a webhook will receive a message for almost every test result in the project. Only the results of experiments and CI builds are normally excluded.
You can configure what pages and tests you want to receive notifications for.
Page filter
Only send webhook events for some pages using a page search filter.
For example, you can add tags to specific pages and then enter [tag-name] as the search filter.
Status filter
Select Failed tests to only send a notification if the test didn't run successfully (e.g. no server response) or when a performance budget has been breached.
Test type filter
Select All tests types to include experiments and API builds that collect data from outside of your primary testing environment.