Monitoring Lighthouse scores and bundle sizes with CircleCI, Github, and DebugBear
In this guide we'll set up DebugBear monitoring for every commit to a React app. We'll use CircleCI for continuous integration and ngrok to make the CI server publicly accessible. Finally we'll analyze the site with DebugBear and report the results to Github.
You can find the example repo here.
Getting started and setting up Continuous Integration with CircleCI
First, we need to create a repository on Github and use create-react-app to set up a new React application.
To configure CircleCI we first need to create a .circleci folder in the root of the project and then create a config.yml file in that directory.
Put this into your config.yml to build the app every time we push a commit to Github.
version: 2
jobs:
  build:
    docker:
      - image: circleci/node:10

    working_directory: ~/repo

    steps:
      - checkout

      - run: yarn install
      - run: yarn build
Now, in order for CircleCI to build the project we need to create a CircleCI account and tell CircleCI about the repo. Click "Set Up Project" on this page:
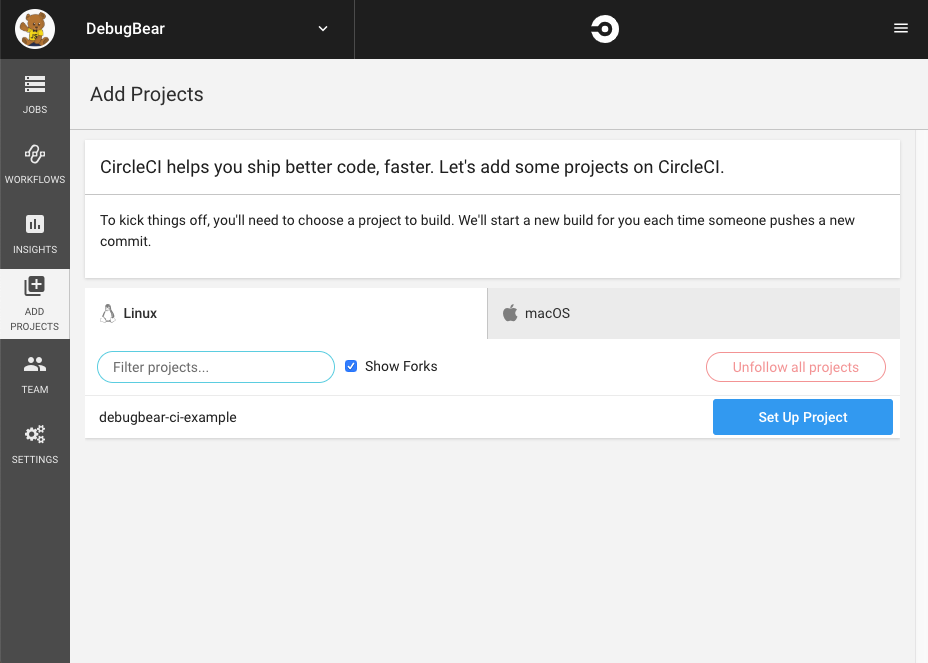
The instructions CircleCI gives you are good (you should run yarn test in CI), but you can ignore them for now and just click "Start building".
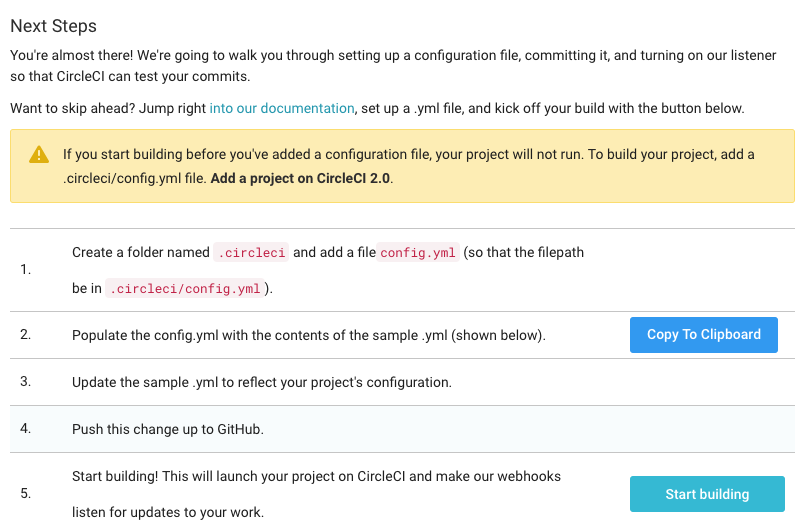
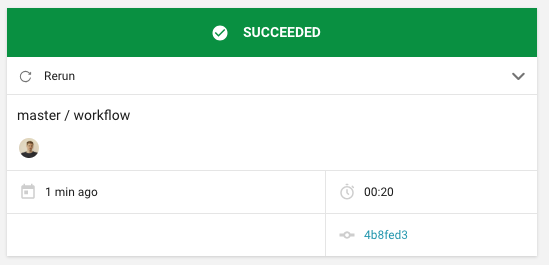
About a minute later the project should have been built successfully.
Starting a server in CI
The yarn build command builds the app and writes the result to the build directory. To serve this directory we need a static file server, so let's install one with yarn add http-server --dev.
Then update config.yml by adding ./node_modules/.bin/http-server build to start the server.
    steps:
      - checkout

      - run: yarn install
      - run: yarn build
      - run:
        background: true
        command: ./node_modules/.bin/http-server build
Try pushing to Github now to make sure the build still succeeds. For now, the server won't be up for long, because the build finishes right after it started.
Configuring CircleCI environment variables for ngrok and DebugBear
In the next step we'll use ngrok to make the CI server publicly accessible. Later on we'll use the DebugBear API to analyze our app.
To use ngrok and the DebugBear API we need to pass in API keys or tokens. For security, these should not be hard-coded in the config.yml. Instead we'll use environment variables.
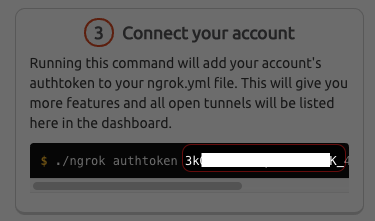
First let's get the keys we need. Sign up to ngrok and find the auth token.
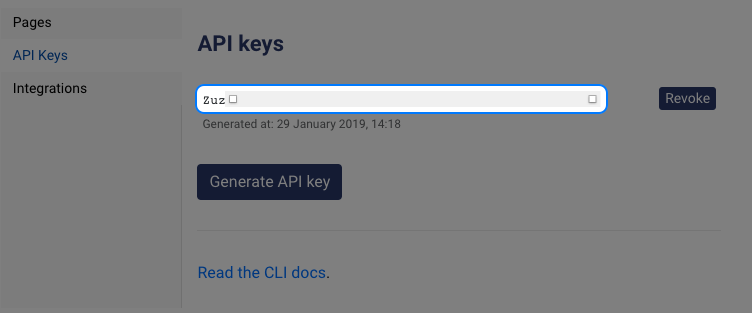
Then generate a DebugBear API key.
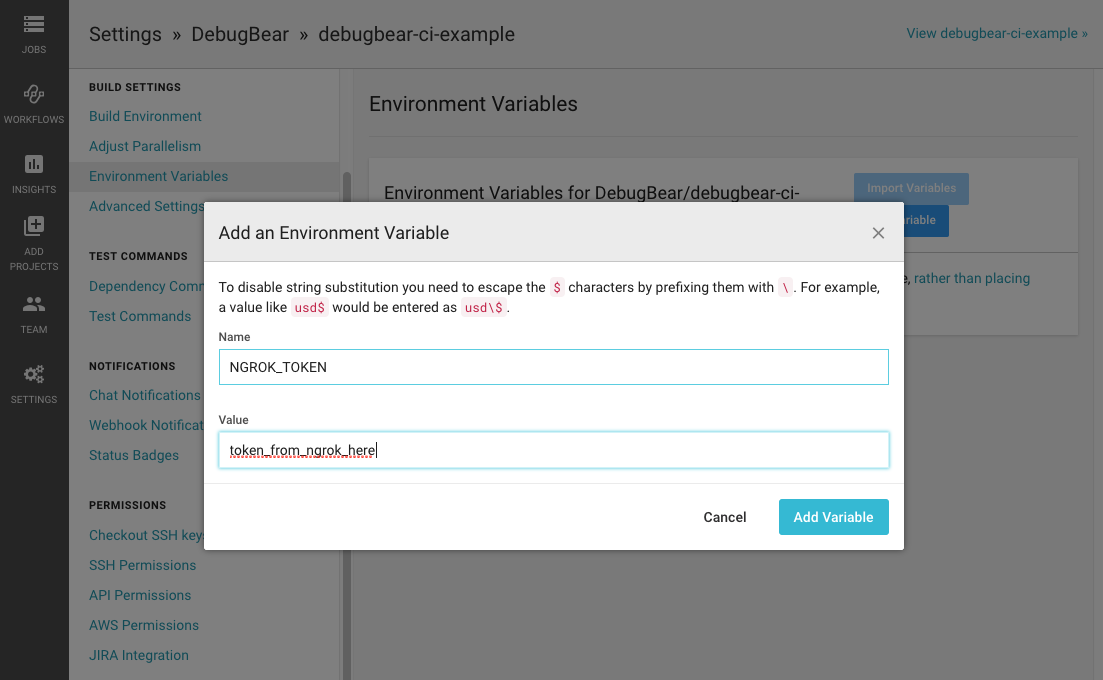
To set the environment variables in CircleCI first click on the project you want to edit and then click the gear icon in the top right. (Don't click on the "Settings" tab, this will take you to settings for the organization instead of the project.)
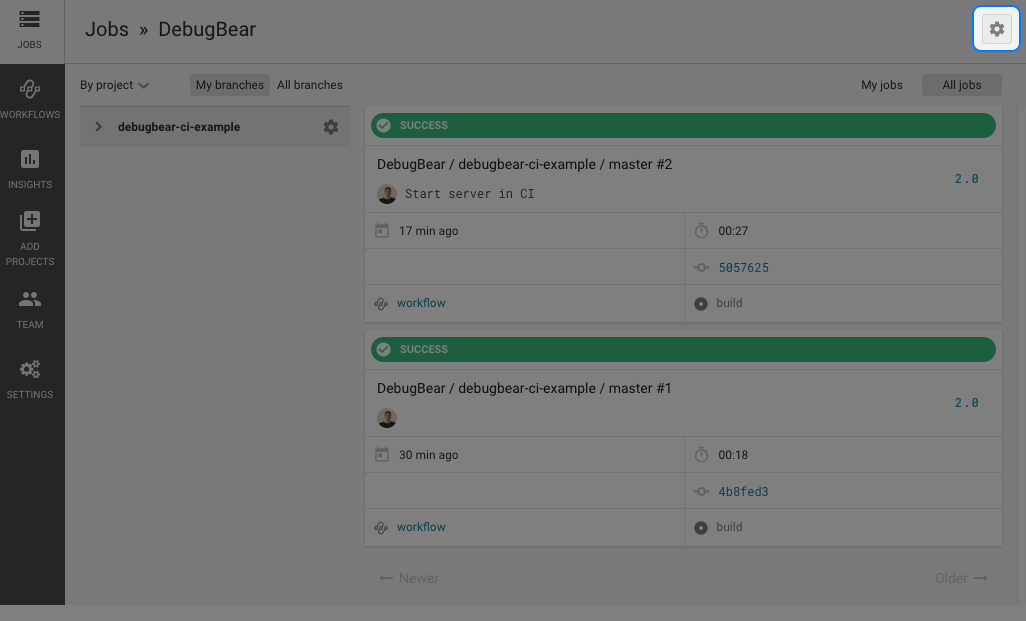
Select the "Environment variables" tab and create two of them, NGROK_TOKEN and DEBUGBEAR_API_KEY with the values from above.
Exposing the CI server publicly with ngrok
Now run ngrok to expose port 8080 publicly by adding this to the end of your config.yml:
- run: wget https://bin.equinox.io/c/4VmDzA7iaHb/ngrok-stable-linux-amd64.zip
- run: unzip ngrok-stable-linux-amd64.zip
- run: chmod +x ngrok
- run: ./ngrok authtoken ${NGROK_TOKEN}
- run:
    background: true
    # stdout of this: https://github.com/inconshreveable/ngrok/issues/57
    command: ./ngrok http 8080 -log=stdout
- run: sleep 60
The sleep 60 at the end is so that we have a minute to actually access the app, before the build task finishes.
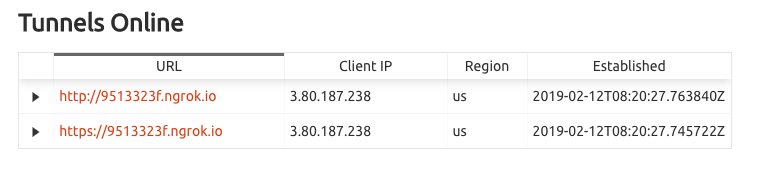
Commit your changes and watch the build on CircleCI. After ngrok has started you can find the public URL of your app on the ngrok Status page.
For your own app, make sure that publicly exposing your dev server is secure! If your dev server can leak things like API keys or data from a production database don't expose it publicly.
Analyze your app with DebugBear
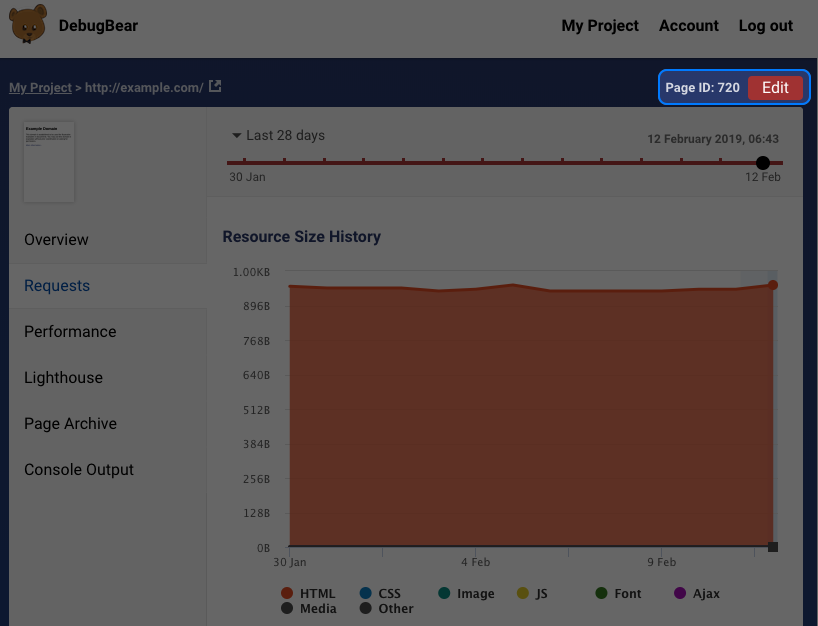
First, monitor the staging or production version of your app with DebugBear. (If you don't have a production site yet or you aren't monitoring it, just set up monitoring for example.com.)
Now find the pageId of your page at the top right of the results page:
Run yarn add debugbear --dev on your local machine to install the DebugBear CLI tool.
Then replace the sleep 60 with this line, substituting the pageId for your page.
- run: ./node_modules/.bin/debugbear --pageId=11111 --ngrokWebPort=4040 --waitForResult --baseBranch=master --inferBuildInfo
4040 is the default port ngrok uses for its admin panel. DebugBear uses it to detect the public URL of your page and then analyzes it.
--inferBuildInfo means DebugBear will detect the build's commit hash, commit message, and branch.
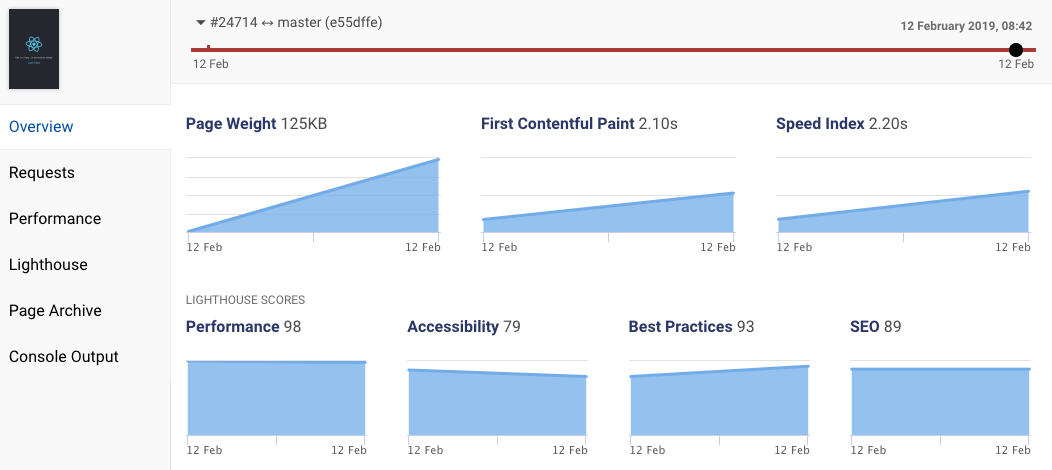
After committing your changes and checking the CI build the debugbear output will look something like this:
| Repo: DebugBear/debugbear-ci-example
| Commit: e55dffe93732ad264ddbe239fa8db391fda9b889 on branch master, base branch: master
When the result is ready you can see it here: https://www.debugbear.com/viewResult/123456
Waiting for result
Build complete
For your first build you may see bigger changes since it will be compared to the production monitoring results rather than the CI server.
Set up the DebugBear Github integration
In order for DebugBear to report results on Github you need to install the DebugBear Github app. Follow step 1 in this article to do that.
You won't need to do step 2, because the commit hash and repo details are already detected automatically from the CI environment. You can confirm that's the case by checking that the CLI outputs this information, like it does in the example above.
Create a pull request and watch the magic
We're all set up now, so let's give it a try! Create a new branch called my-new-feature then add a new dependency on lodash.
First install lodash with yarn add lodash and then add these two lines at the top of App.js (from create-react-app):
import _ from "lodash"
console.log(_)
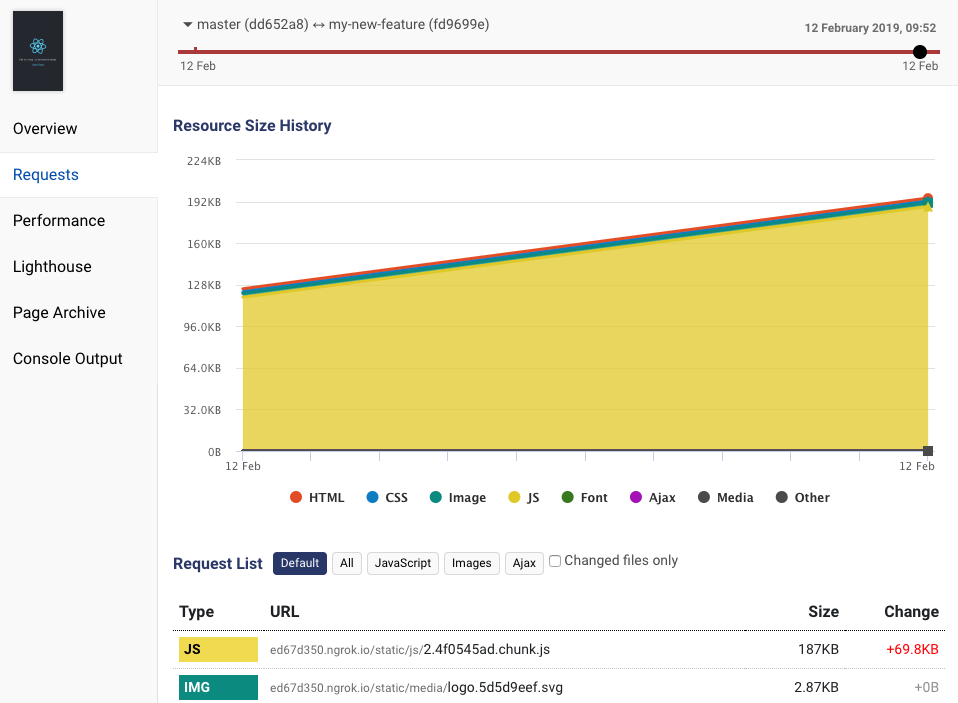
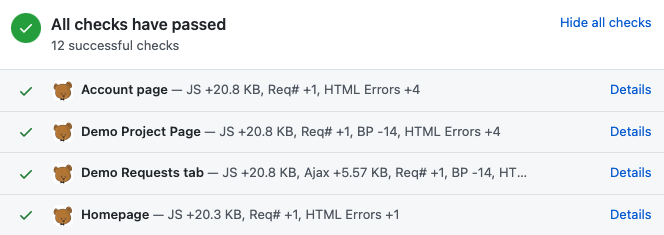
Publish your branch and create a new pull request. Wait a minute or two and here we go:
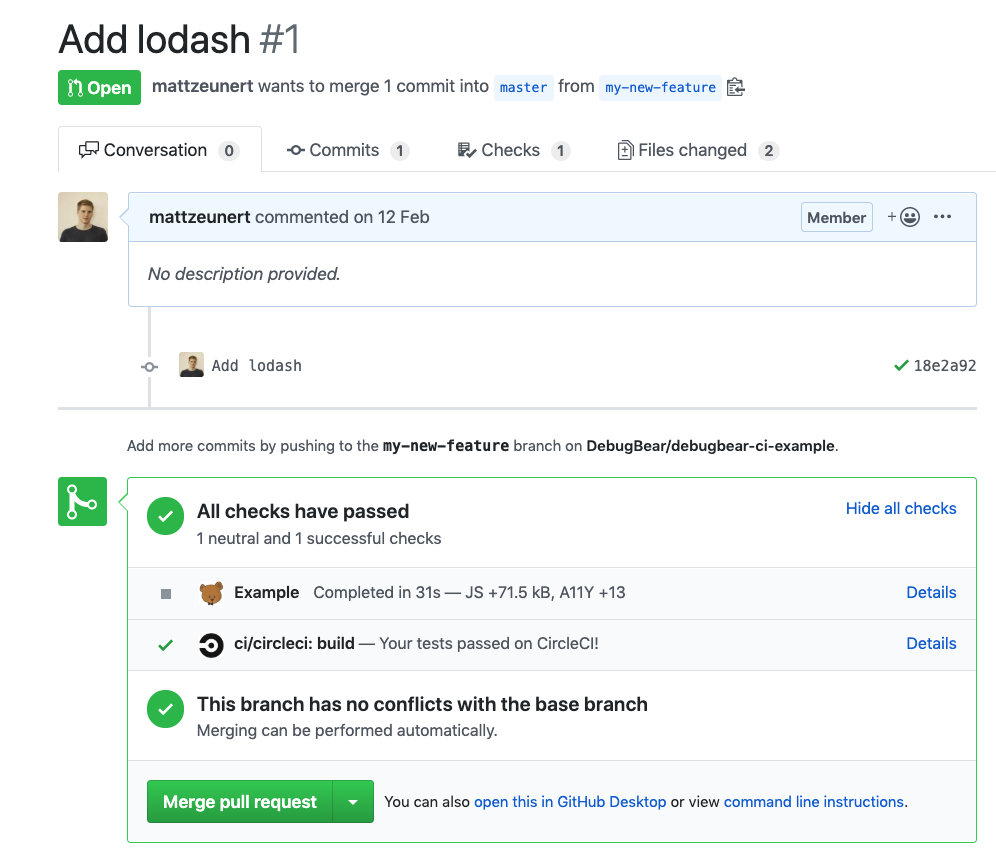
Click on "Details" and then "See full details" to find out what caused the JS size increase: