Getting Started With DebugBear
This guide explains how to set up DebugBear for your website. Get comprehensive monitoring data to help you detect, diagnose, and resolve web performance problems.
DebugBear offers both detailed synthetic monitoring and real user analytics.
Demo Video
See how DebugBear works and an example of how to investigate a performance regression.
Set up lab-based website monitoring
DebugBear runs website tests in a controlled lab environment built on top of Google's Lighthouse tool, so you also get recommendations for SEO and accessibility.
To get started, click the Add Website URL button.
All you need to do is provide a URL you want to test and configure the test environment:
- Select a simulated test device
- Select a test location
The standard Lighthouse Mobile and Desktop test devices are usually a good starting point.
Pick a test location that's close to where most of your users are located. Then click Add Page.
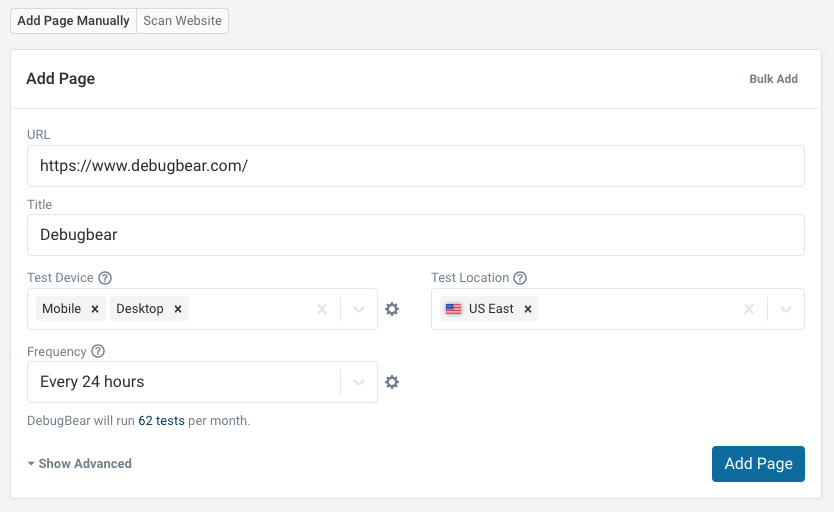
You can also choose Bulk Add to paste in a list of URLs and set up many pages in one go.
Test result data: an overview
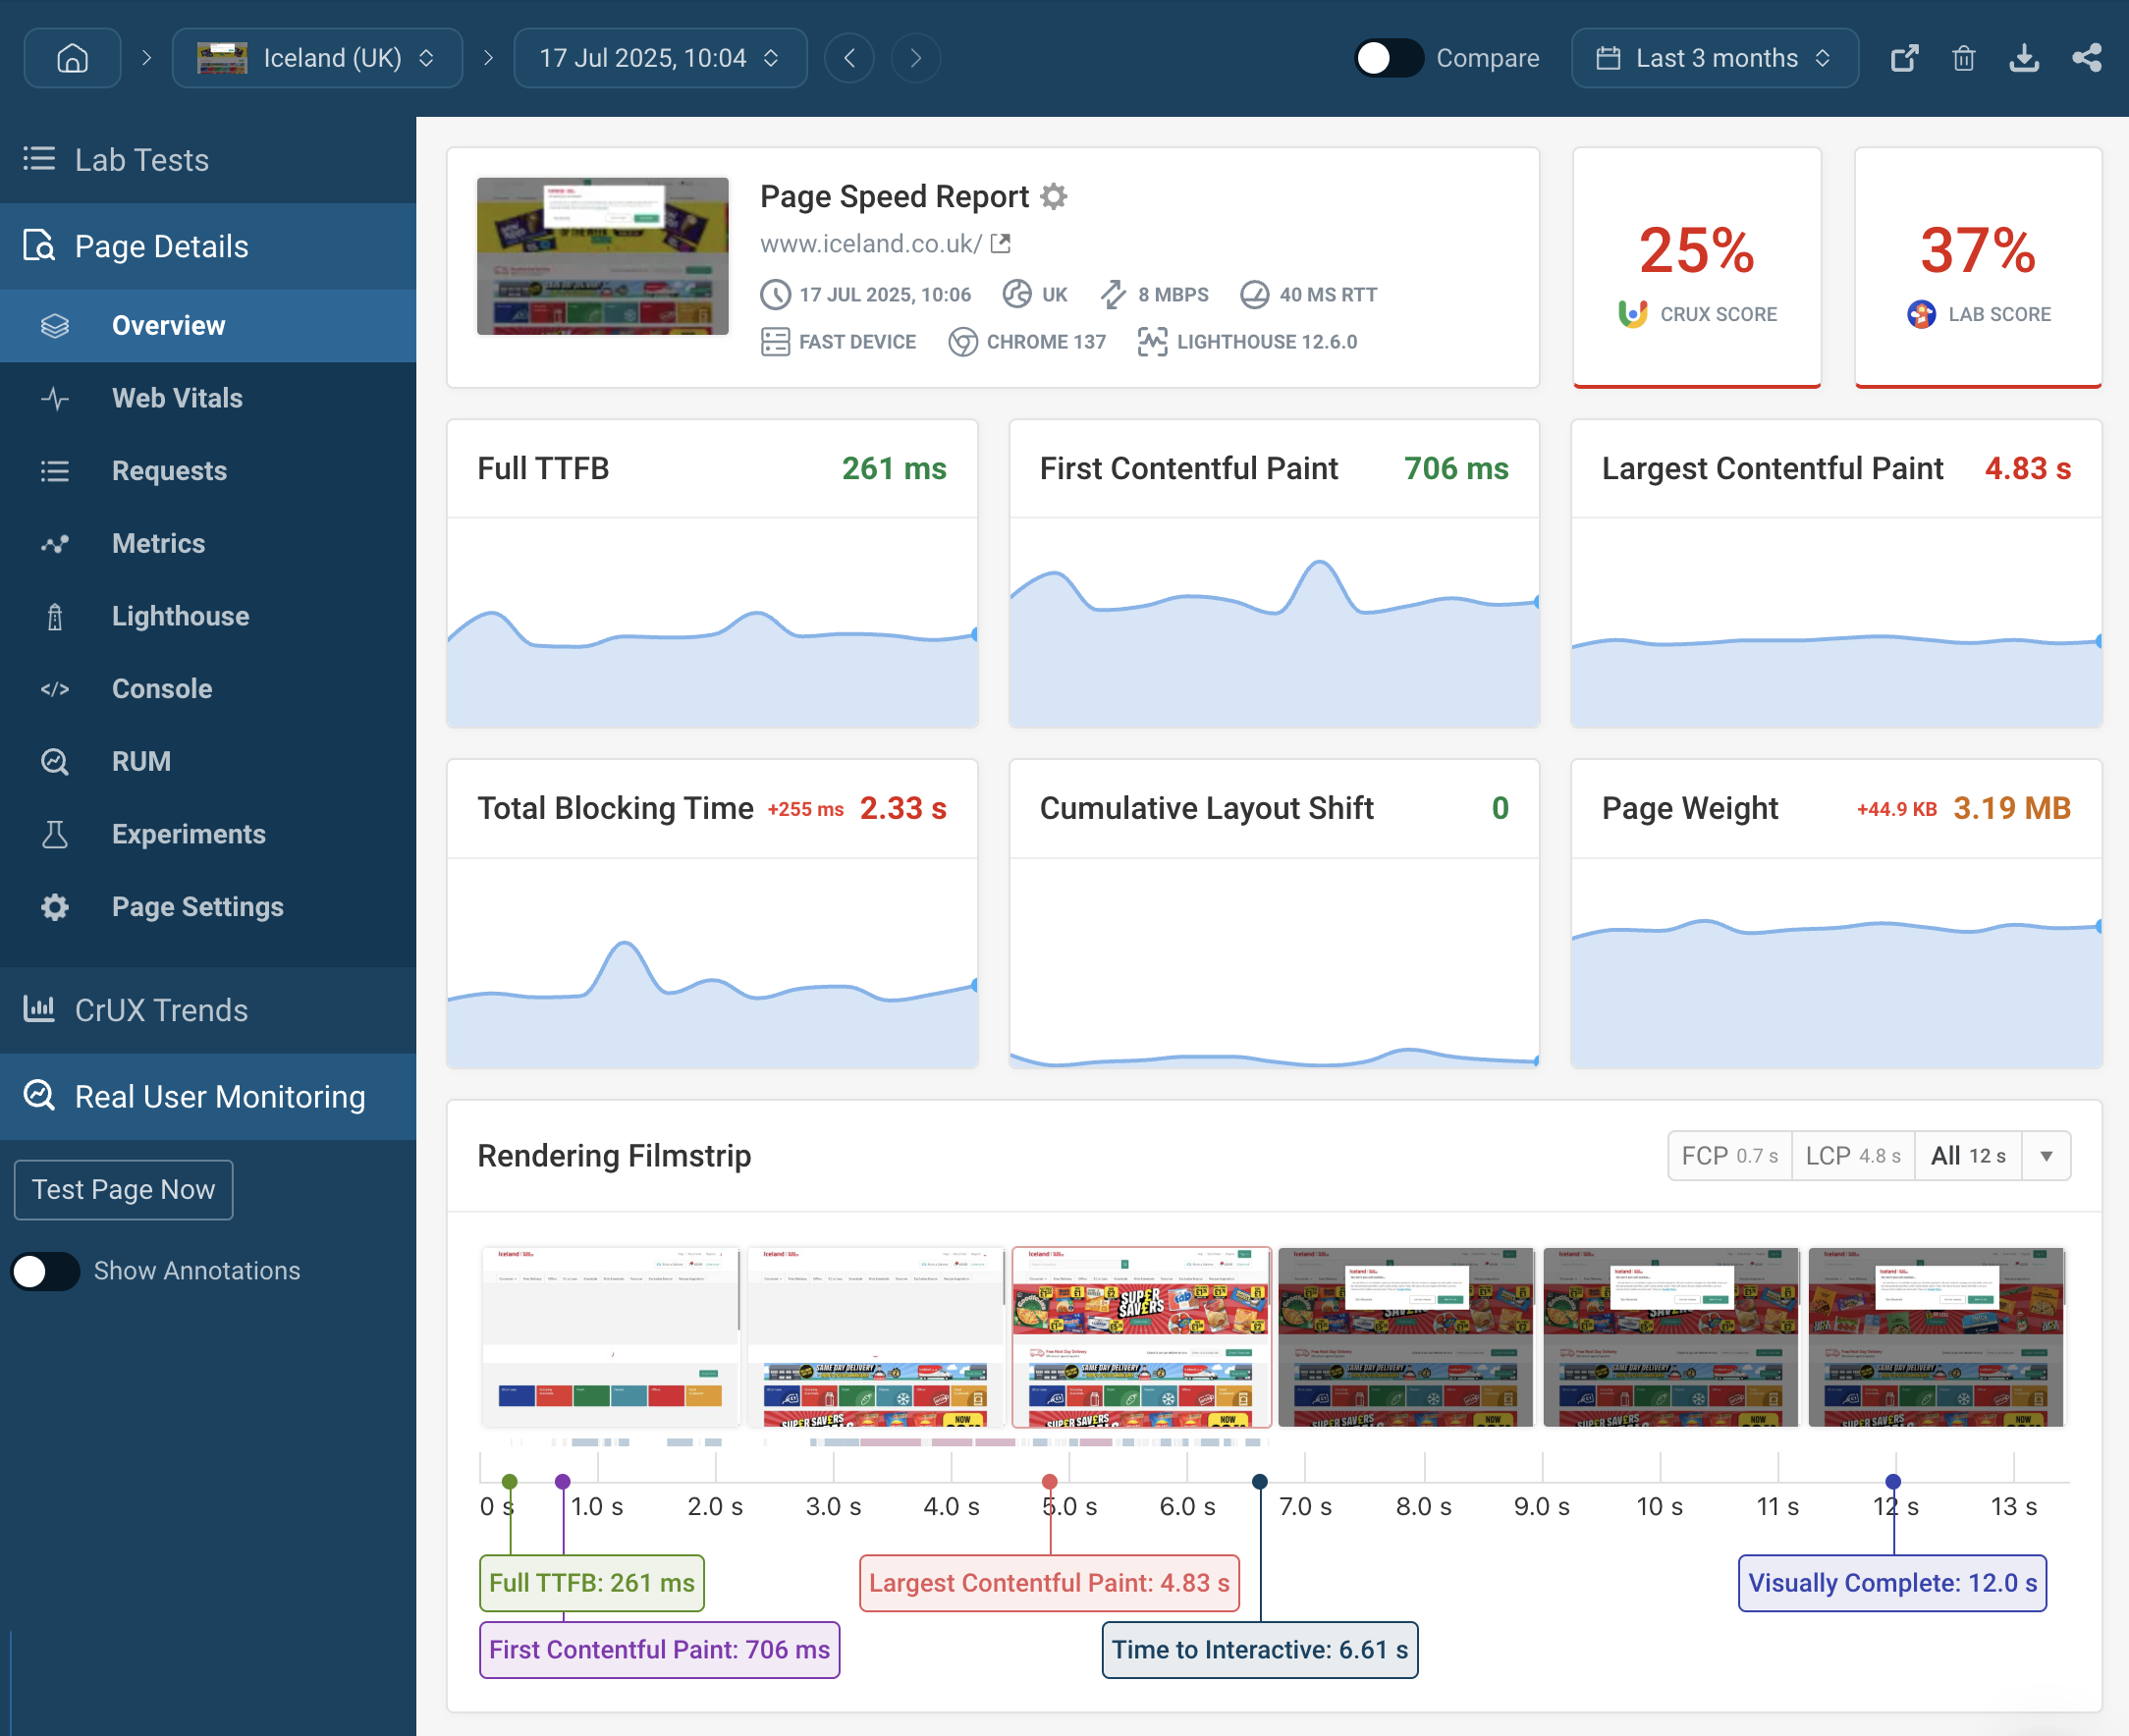
Each DebugBear test result provides detailed data for diagnosing website performance issues.
- The Overview tab shows a high-level summary of all your site metrics.
- The Web Vitals tab provides information specifically for improving Core Web Vitals, and shows Google field data from the Chrome User Experience Report (CrUX) alongside the lab results from DebugBear.
- The Requests tab provides in-depth data on what happened on the network when loading your website. This includes page size and an in-depth request waterfall that shows blocking requests, request prioritization, and rendering progress.
- The Metrics tab contains all of the web performance metrics data for the page. A metric can be added to the trends graph to compare its impact on other metrics.
- The Lighthouse tab provides an overview and history of Lighthouse scores for the page.
- The Console tab shows any errors and logs that were shown in the console while running your tests.
- The Experiments tab lets you try out performance optimizations and measure their impact without deploying any code.
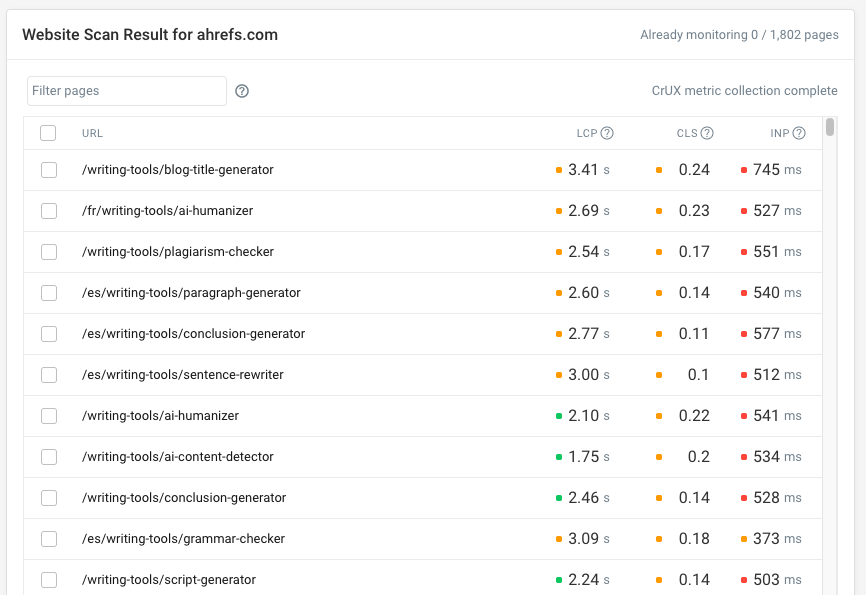
CrUX website scan
To identify slow pages on your website you can use the website scan feature to check the pages from your sitemap using Google's Chrome User Experience Report (CrUX) data. You can then easily set up monitoring for them.
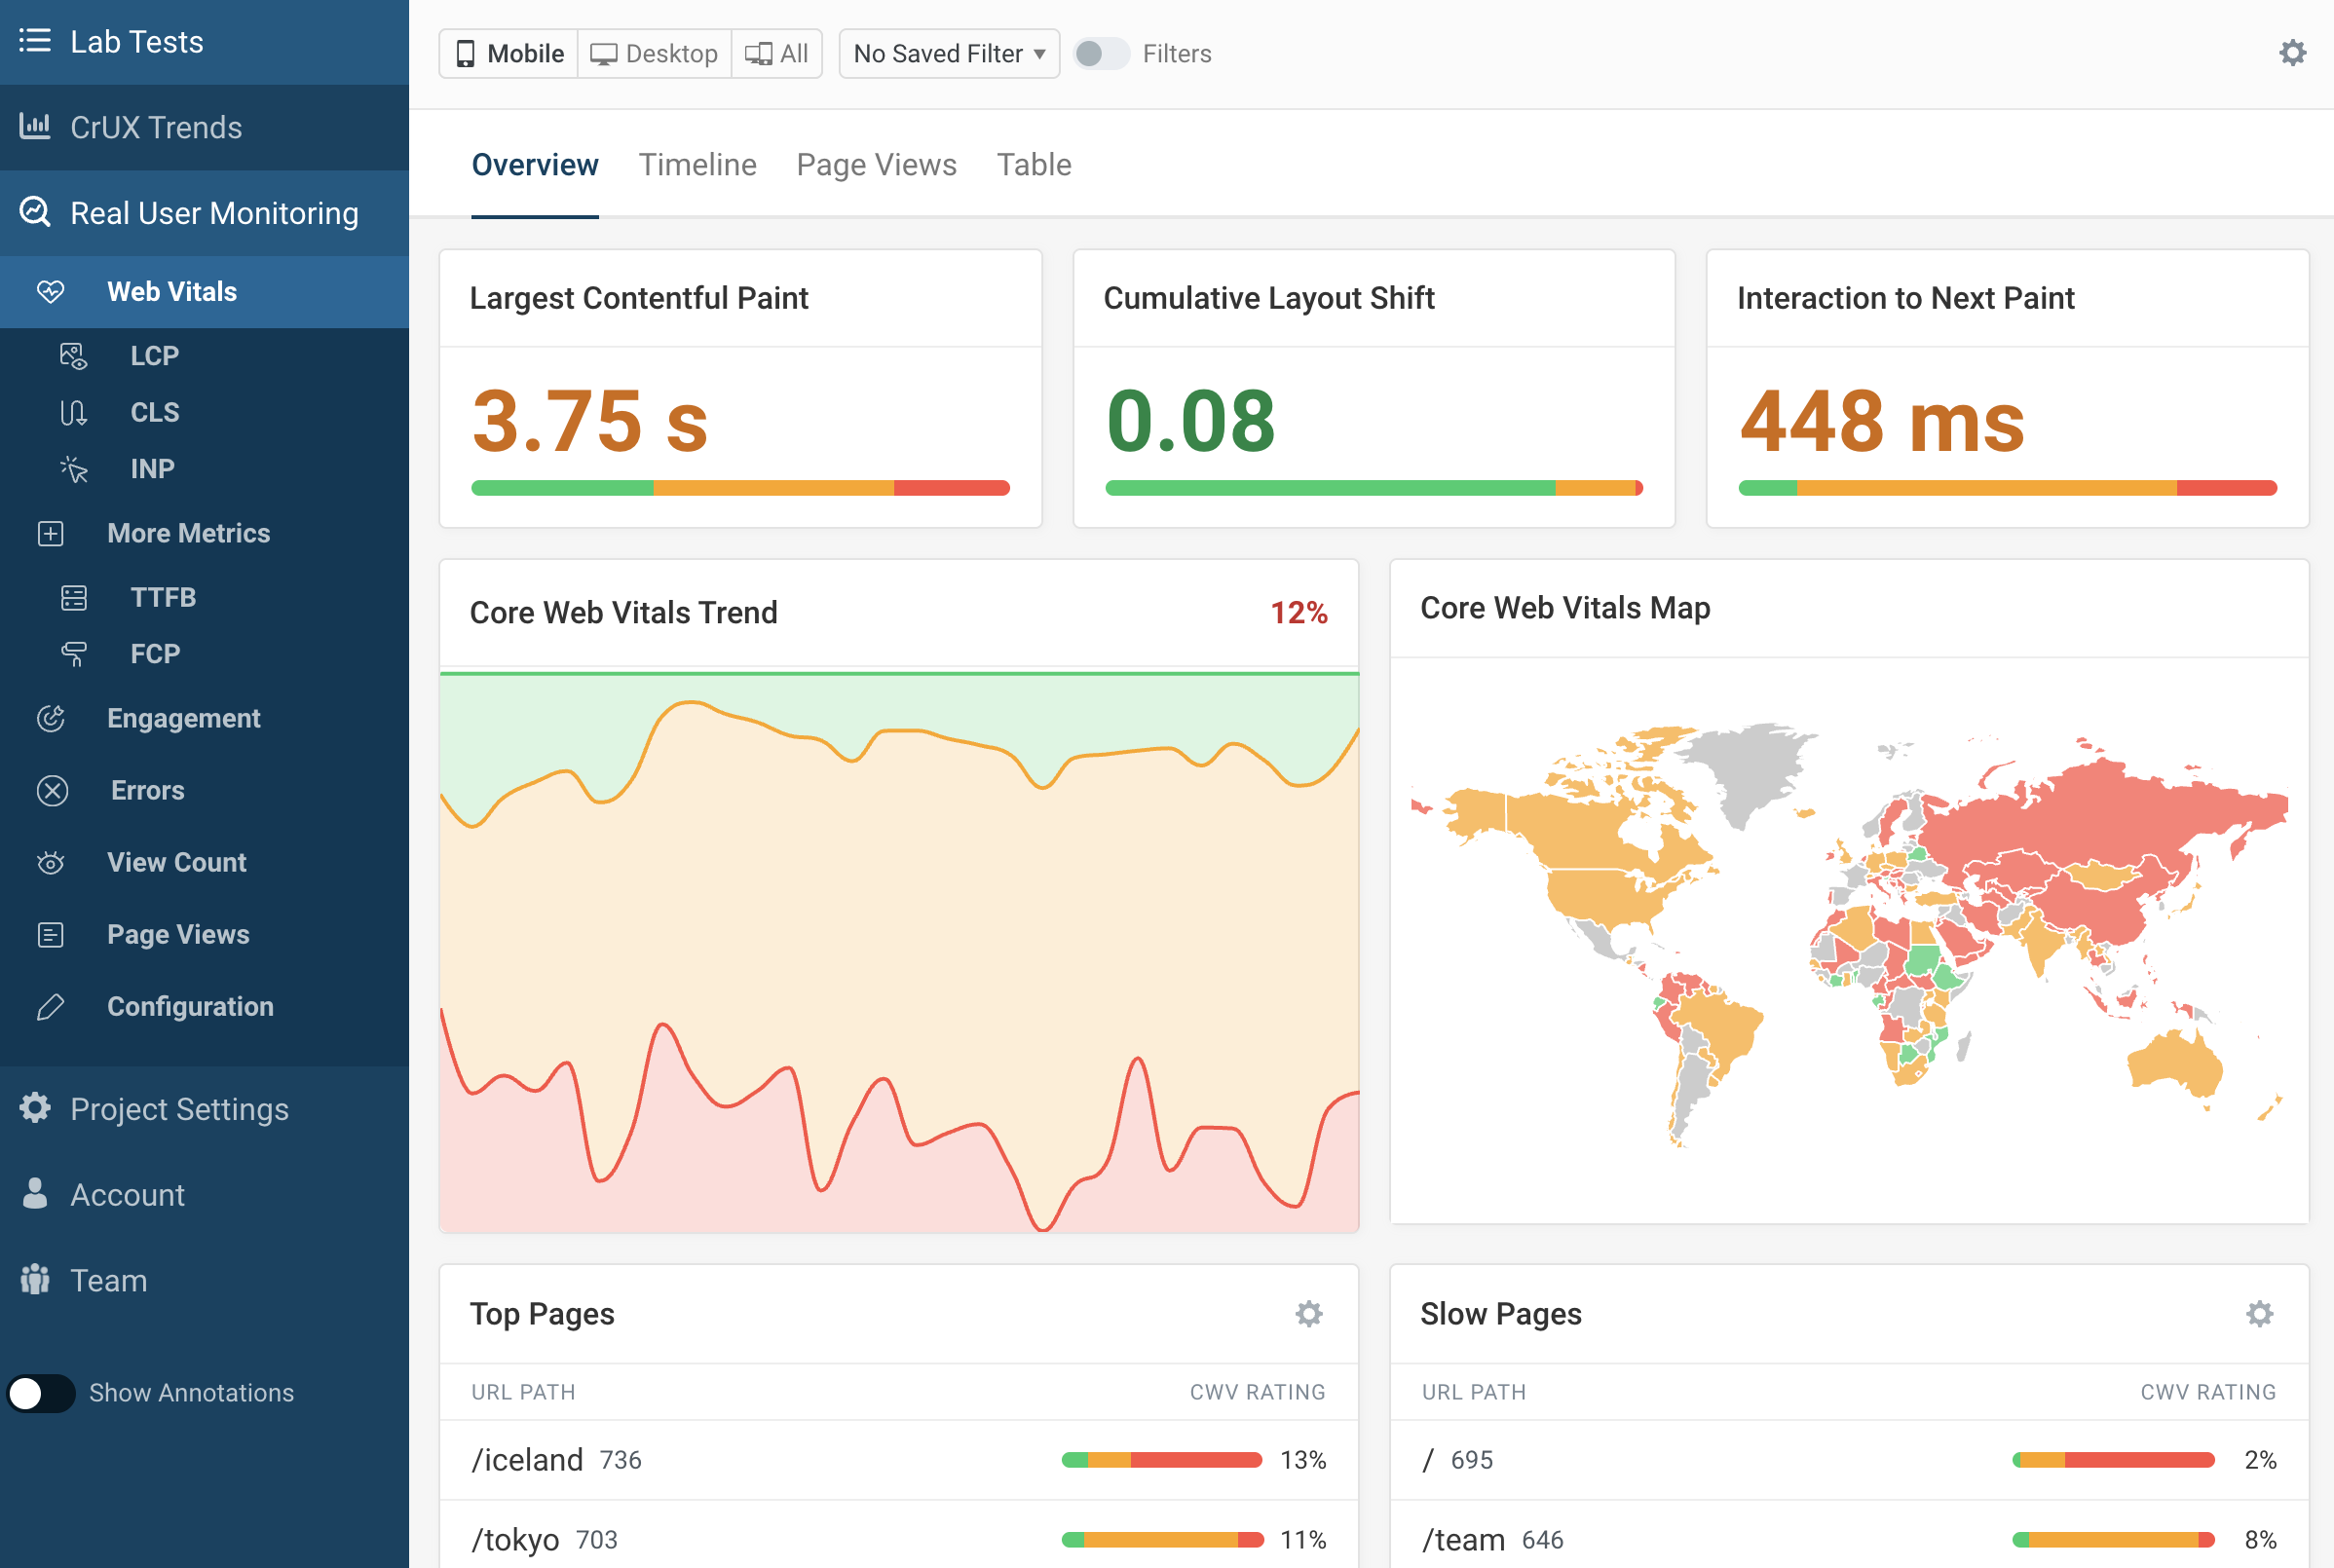
Real user Core Web Vitals monitoring
Beyond lab-based tests, DebugBear can also collect real user web performance data when you install an analytics script on your website.
While real-user monitoring (RUM) data is less detailed than lab results, it offers several key advantages:
- RUM data tells you how your actual users experience your website
- Google uses real user Core Web Vitals data as a ranking factor
- You get a better idea of how diverse experiences on your website are (as different users will use many different devices, have a lot of variance in network speeds, and see different content when opening a page)
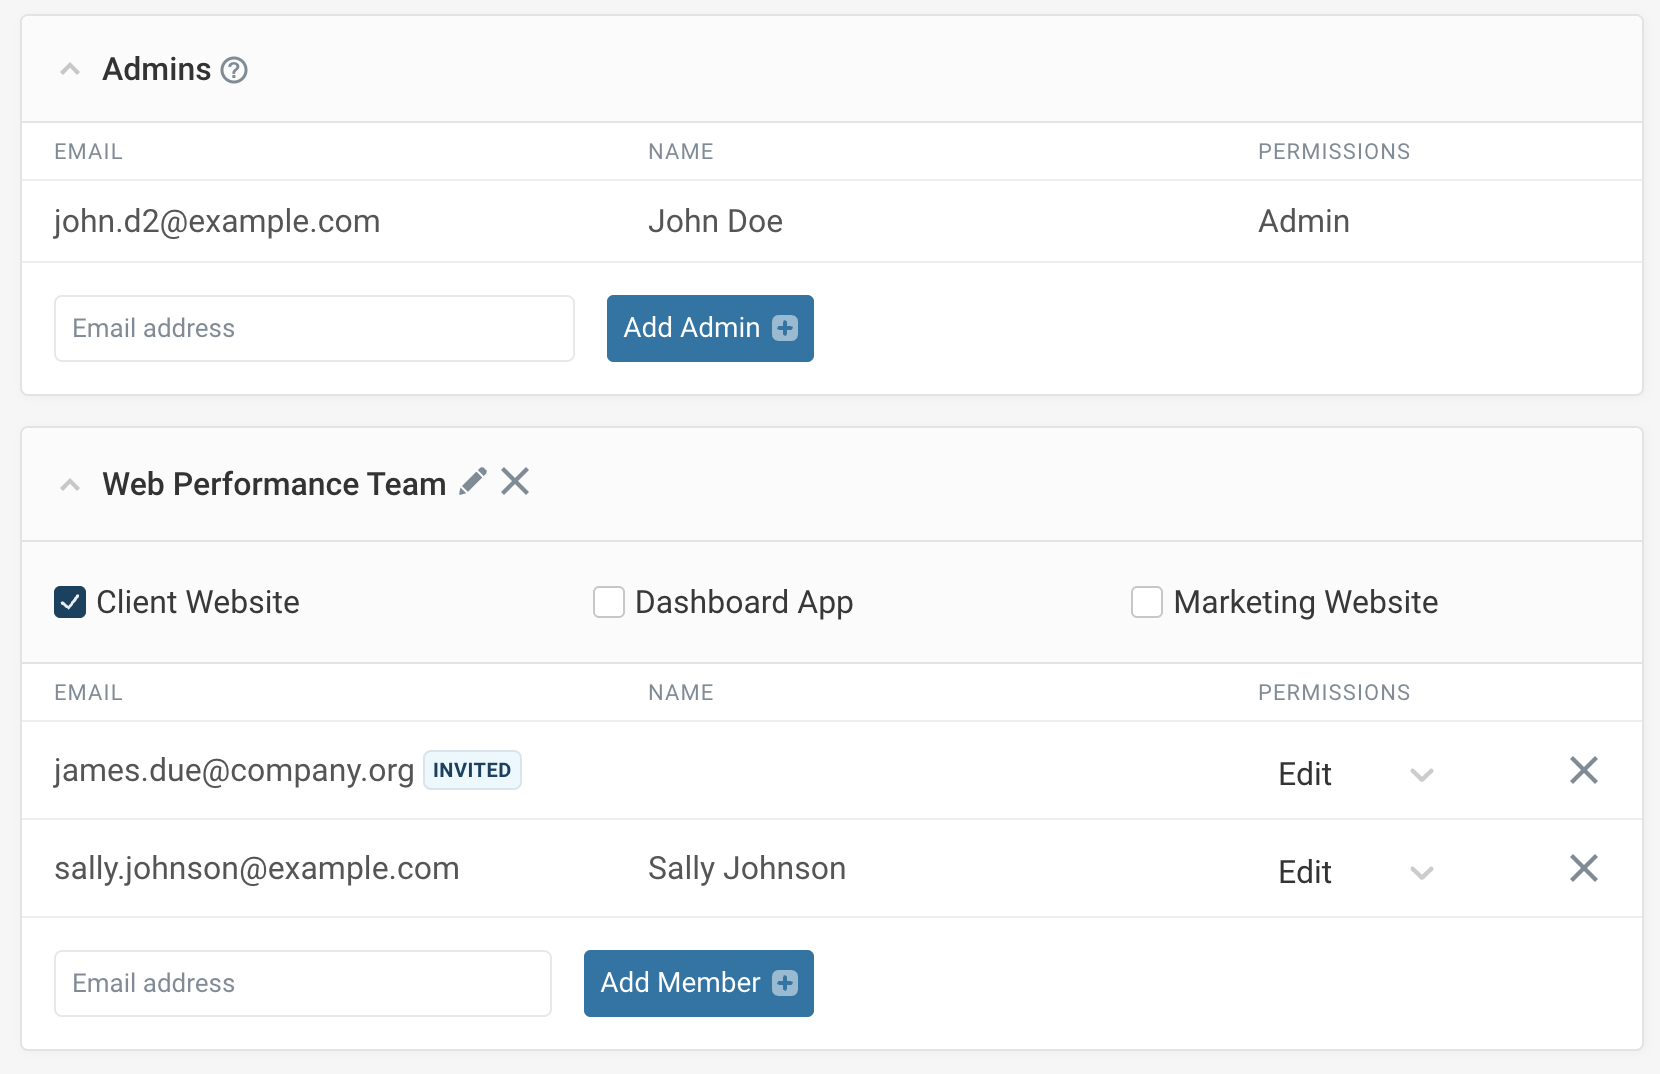
Invite team members
Invite the rest of your team so they can access monitoring data and get alerted to problems.
Add new members in the Teams tab, or grant full account access to Admins.
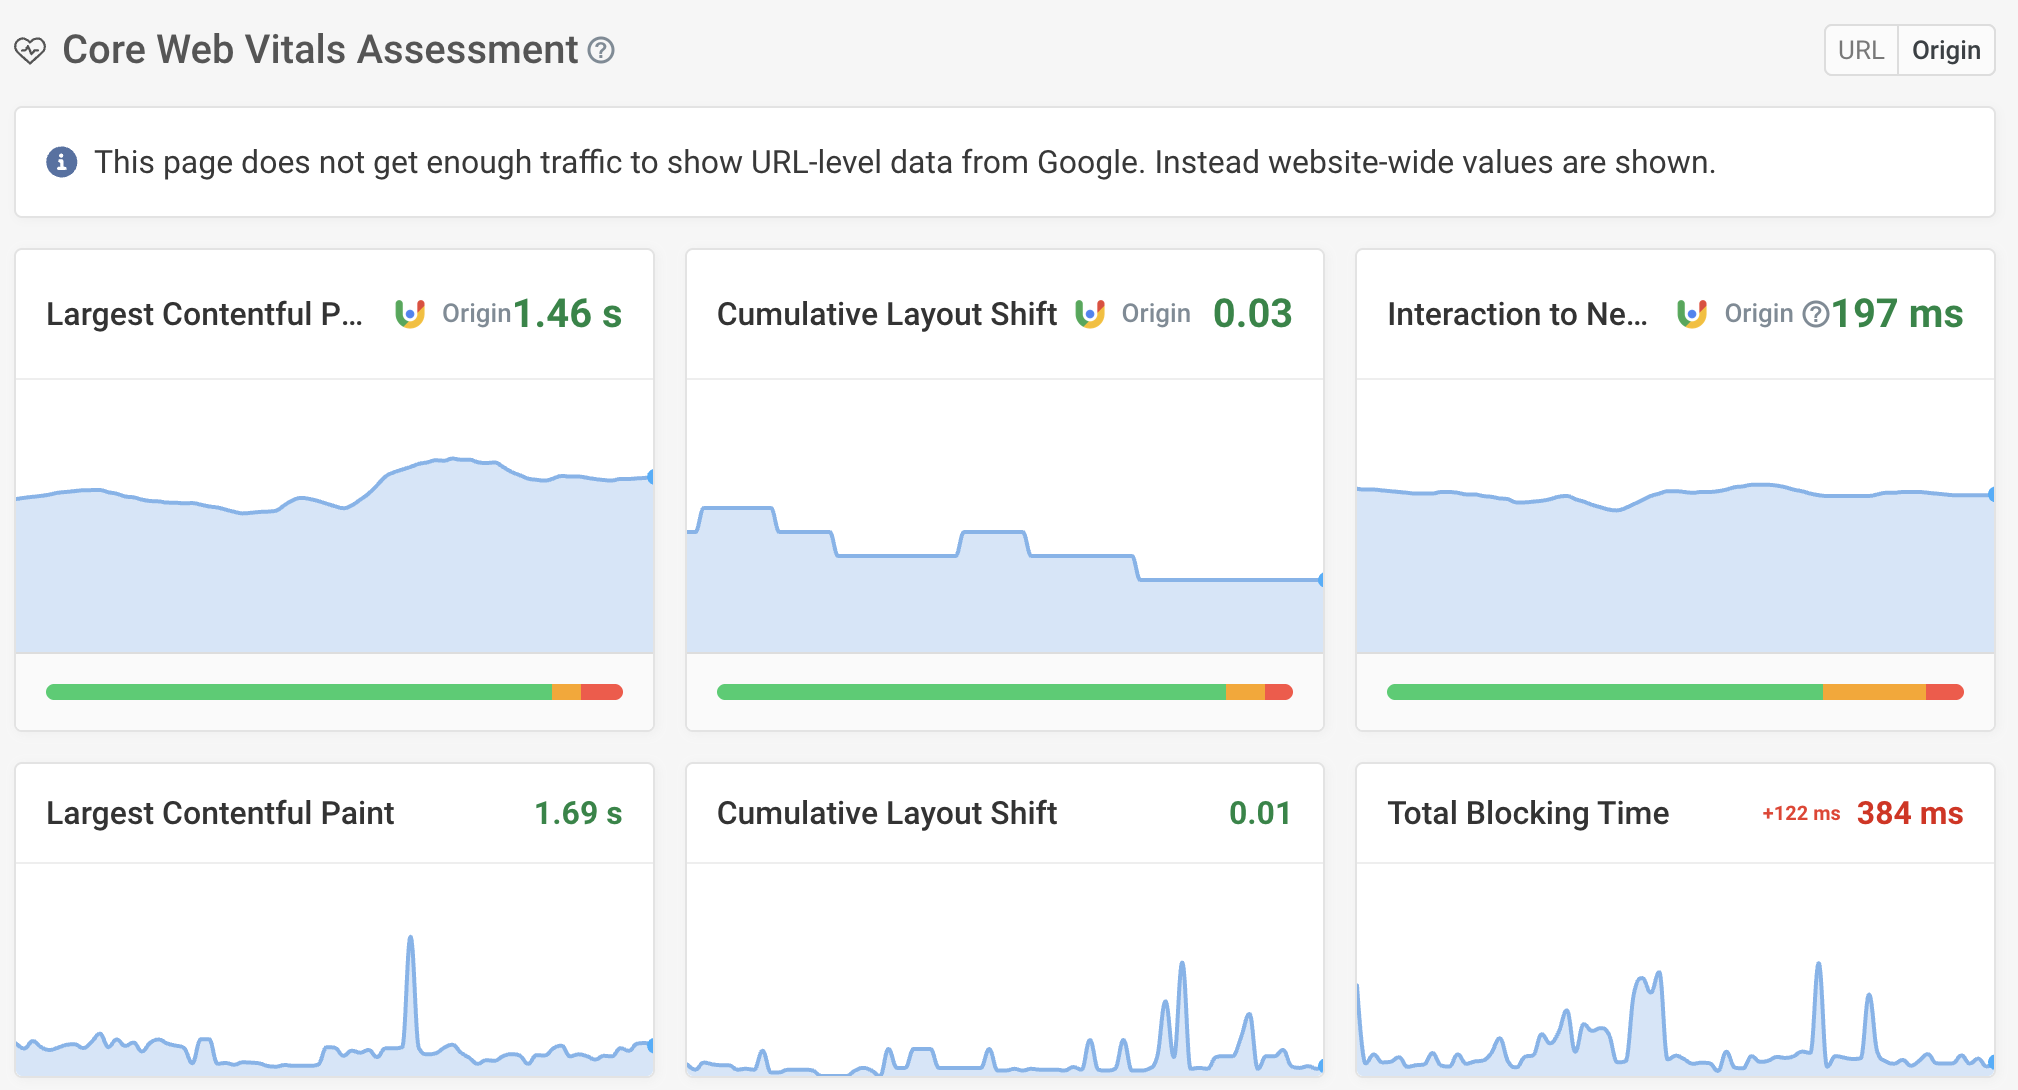
Interpreting site speed data: Start with the Web Vitals
If you don't know where to start, taking a look at the Web Vitals data from the Chrome User Experience Report is a good start. To get the SEO benefits, 75% of user experiences should be "Good" according to each metric.
For Largest Contentful Paint (LCP) issues, first check what UI element is causing the LCP. Keep in mind that this can vary for real users, for example, based on the size of their device.
Then check out the waterfall view in the Requests tab – find the request causing the LCP element here. Then ask what causes it to occur too late. Are there many render-blocking script tags? If the LCP element is an image, does downloading it take a long time? Are there many preloaded resources competing for bandwidth with the LCP image?
For Cumulative Layout Shift issues, check out the layout shifts table to see what content is shifting around. If the DebugBear lab data shows no layout shifts, but the CrUX data shows a lot, then that might mean that layout shifts happen after user interaction.
For Interaction to Next Paint, check to see how the interactive elements for your most viewed pages are scored. Are there background tasks that could be deferred that are causing input delay?
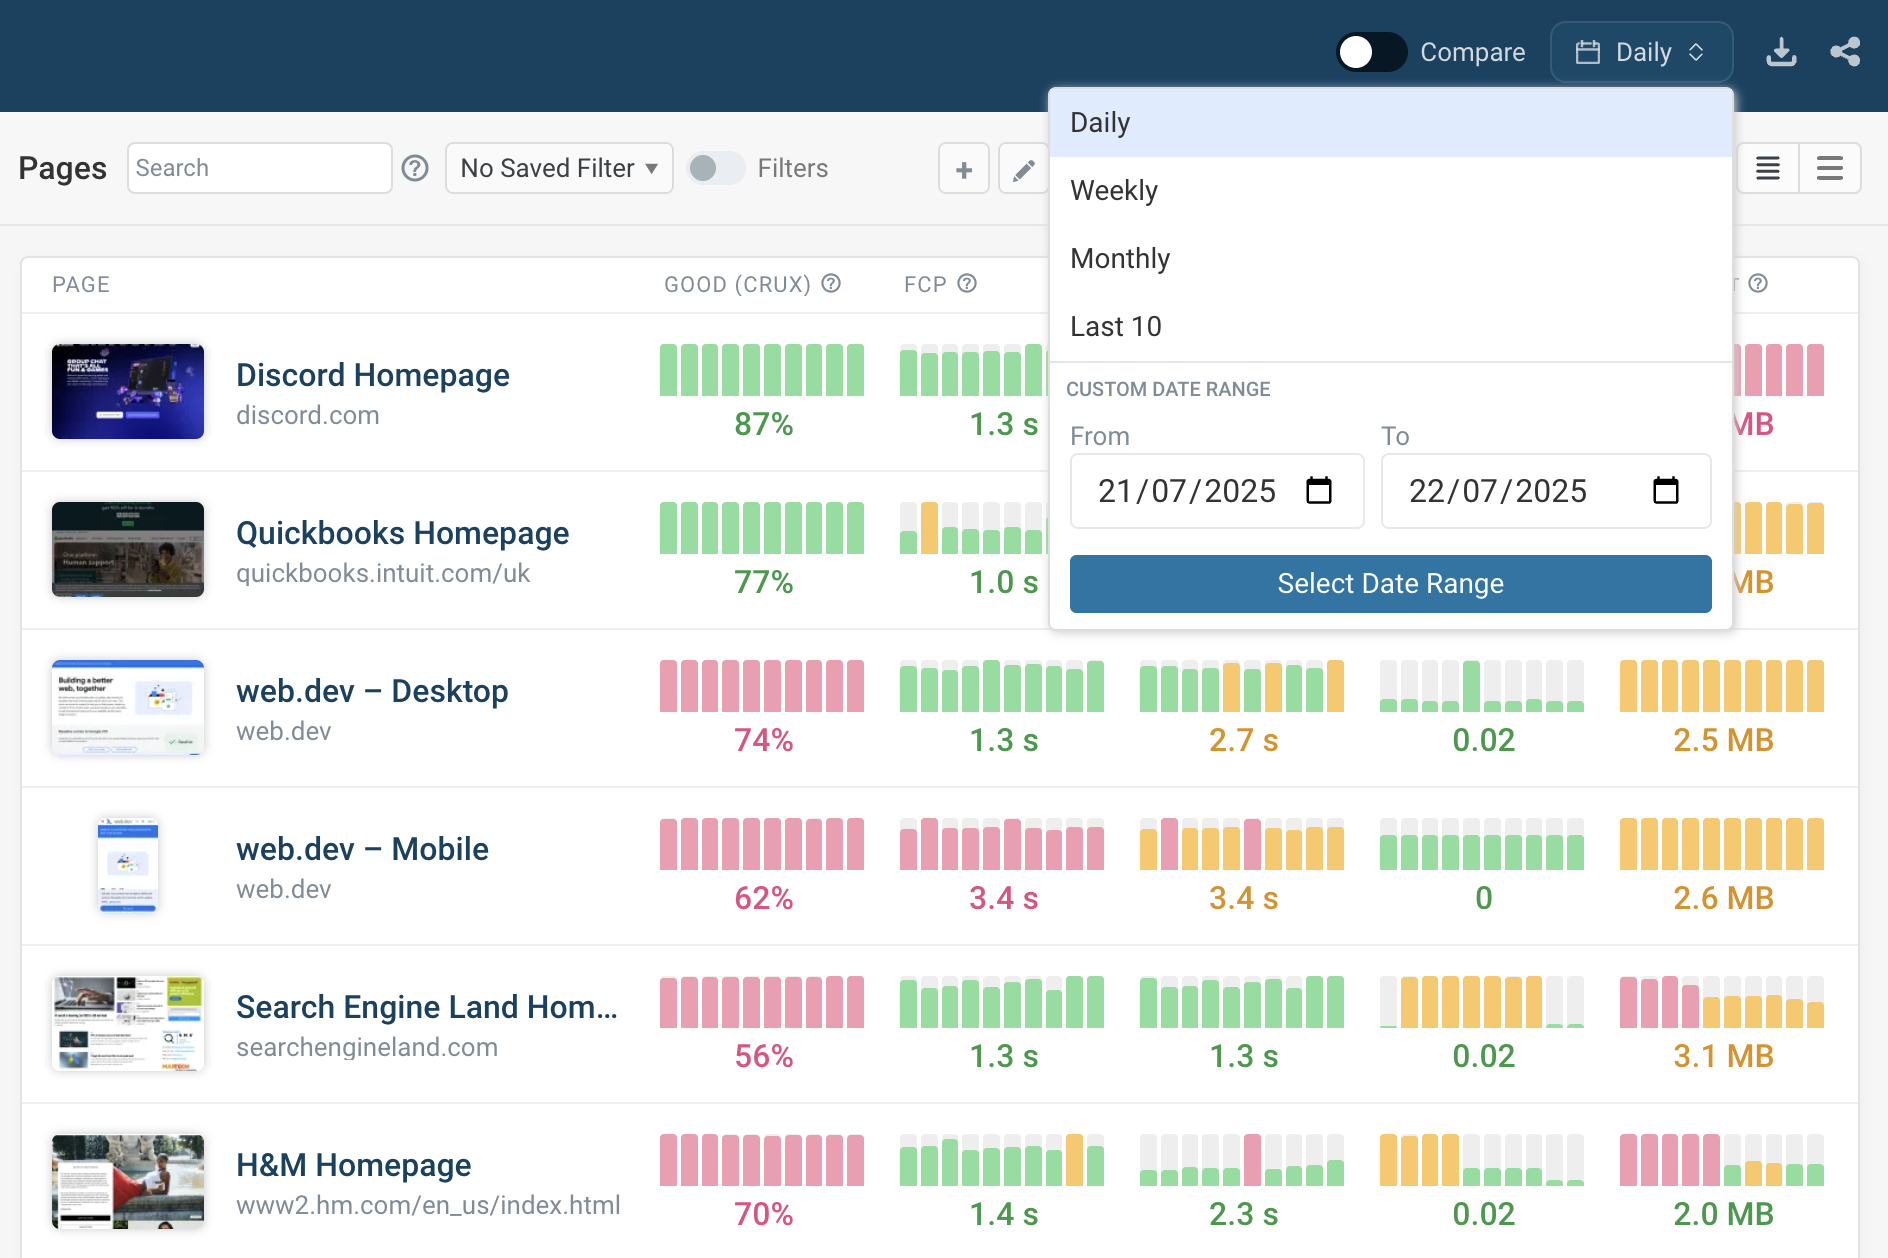
Performance trends
The project overview page lists all pages along with historical metric data.
Here you can:
- switch between the last 10 test results, daily, weekly, and monthly data
- view different metrics like Lighthouse scores and Web Vitals
- bulk edit and group pages by clicking on the pencil icon
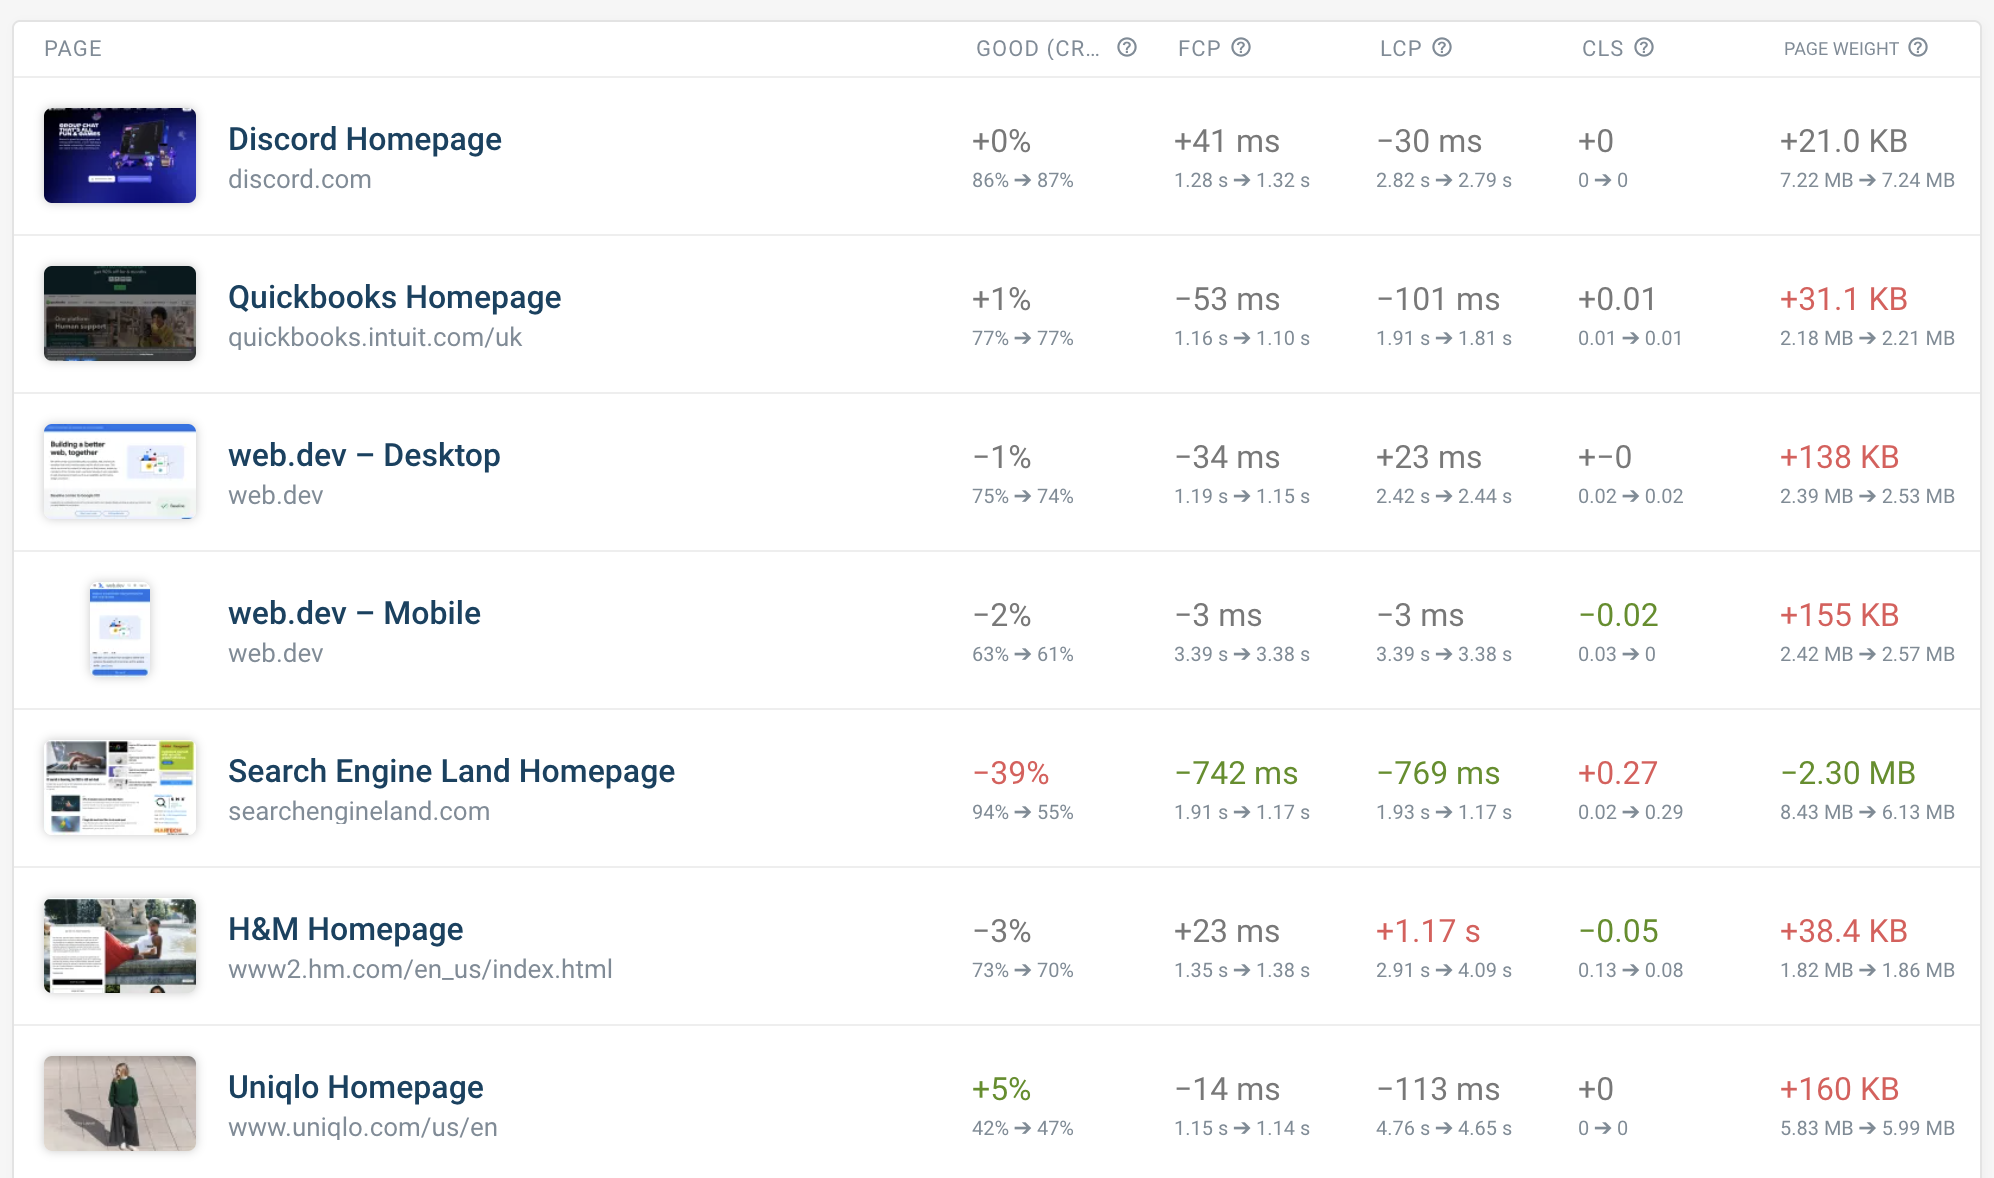
You can also compare score differences between different date ranges.
Common website monitoring problems
Here are common website monitoring challenges and their solutions. If you run into problems you're also welcome to contact DebugBear support.
Discrepancies between different data sources
Different performance tools collect data in different test environments and report data in different ways.
Lab data collected with Lighthouse-based tools usually shows slower speeds than field data from real users. This is because the default Lighthouse network settings are very slow. In DebugBear you can select alternative device configurations like Mobile Fast to simulate a more realistic user experience.
Cumulative Layout Shift (CLS) is often higher in field data, as content shifts around as users scroll down the page or otherwise interact with it.
Test results will also vary between different lab environments. For example, PageSpeed Insights throttles the network in a way that can generate less accurate results. There's also variation in where test servers are located and what their CPU speeds are.
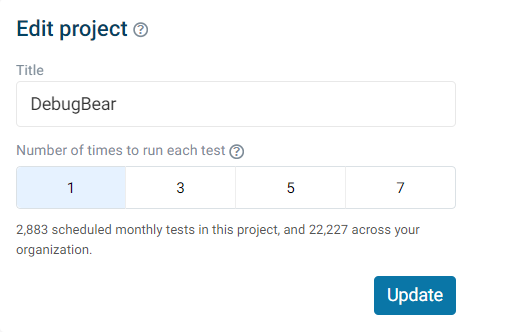
Variability and inconsistent test results
Each speed test will generate slightly different results, depending on server response times and available network bandwidth. To reduce variability you can repeat tests several times and then select the average test result.
A/B tests or other customizations can also cause inconsistent test results. You can configure your website so that it behaves consistently, for example, by detecting the DebugBear user agent or by setting a cookie when the page starts loading.
Page tests blocked by bot protection
Sometimes the DebugBear test servers receive 403 Forbidden responses or a 429 Too Many Requests code. In those cases, you can add the IP address of the test server to a list of allowed IP addresses. A list of static IP addresses for DebugBear servers is available in your Account settings.
Pages behind user login or Basic Auth
If only logged-in users can access a page, you can fill out a login form before running the test.
DebugBear also supports testing pages behind Basic Auth.
Noisy alerts
You can mute notifications containing specific terms, like "gzip" or "google-analytics". You can also limit notifications to only certain pages or disable certain types of alerts, for example, in the "Performance" category.
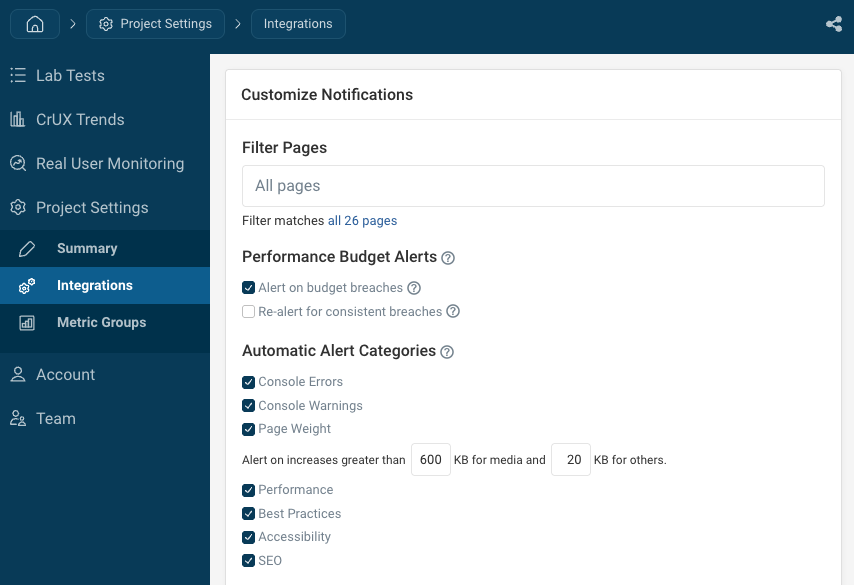
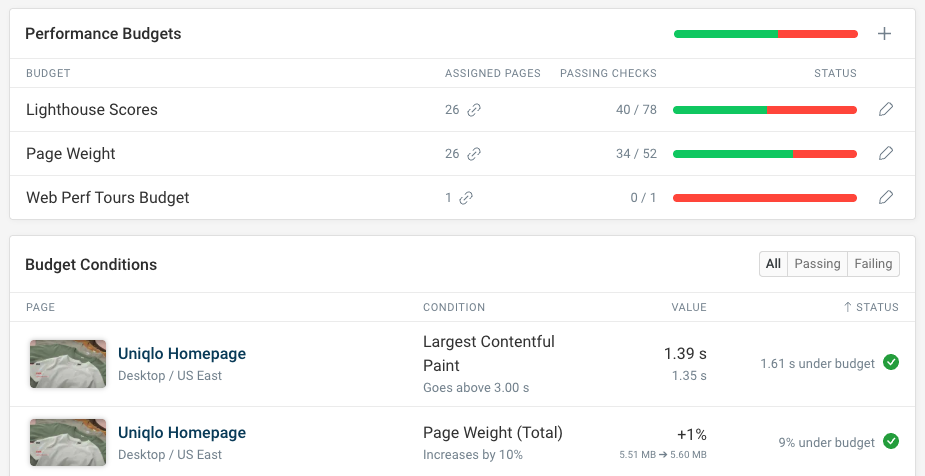
You can also set up performance budgets to define custom alert criteria.
Page crashes or NO_FCP
Especially if a slow mobile device is emulated, tests can sometimes fail for complex pages as the CPU becomes blocked or the page takes too long to render. Tests also time out after waiting 15 seconds for the First Contentful Paint.
If you run into this, you can either select a faster test device or contact support to increase the timeout.
Book a demo
We can help you set up monitoring and give advice on how to optimize your website. Just book a call here.