Metric Groups
Metric Groups allow you to customize your site speed dashboard to see the metrics you care about most.
Select custom metrics on the dashboard
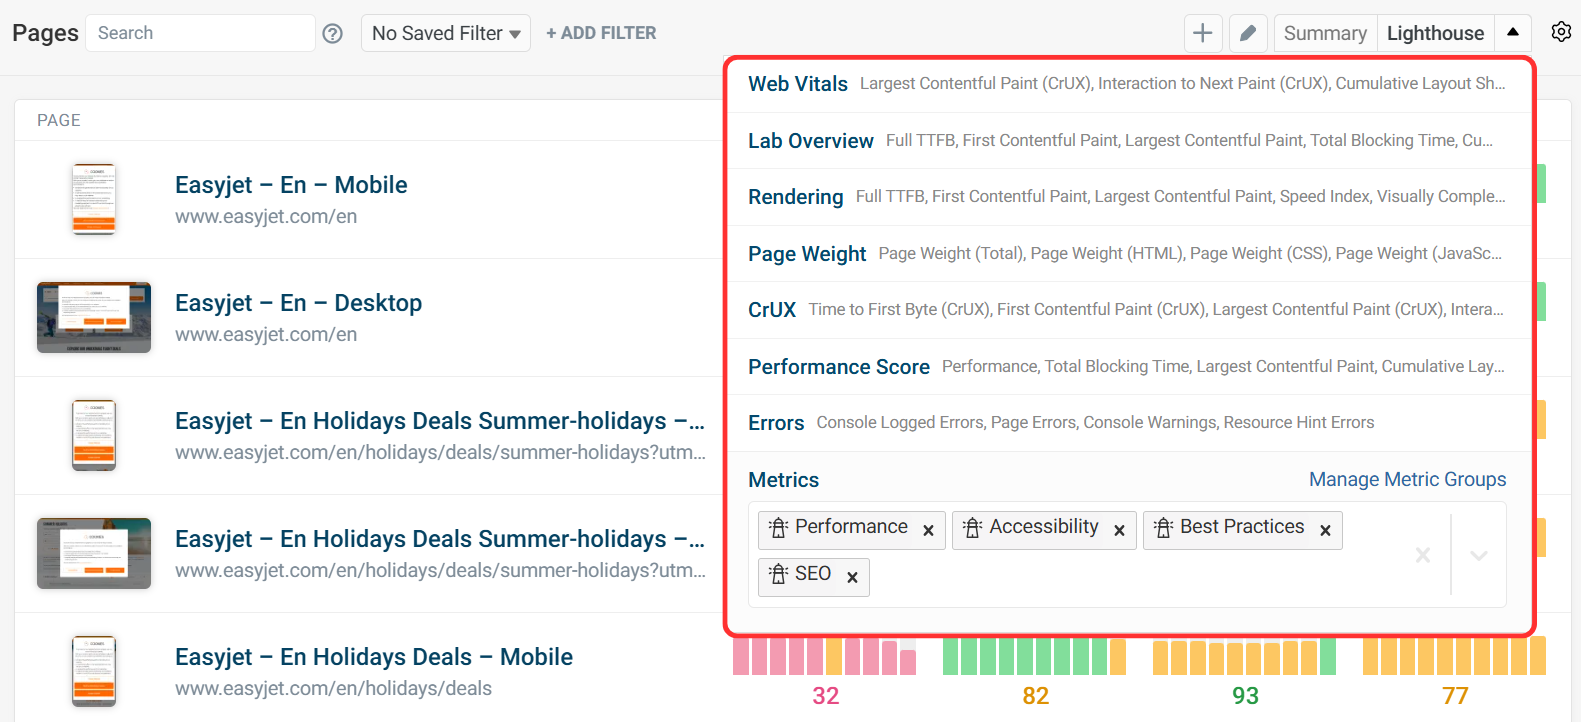
A dropdown menu on the project dashboards offers a selection of pre-defined metric groups as well as custom metric groups you've saved in your account.
Select a metric group to view trendlines for the selected set of metrics. The dropdown at the bottom of the menu shows what metrics are included in the current group and lets you select additional metrics.
In this screenshot the Lighthouse metric group is selected, which includes the four Lighthouse category scores.
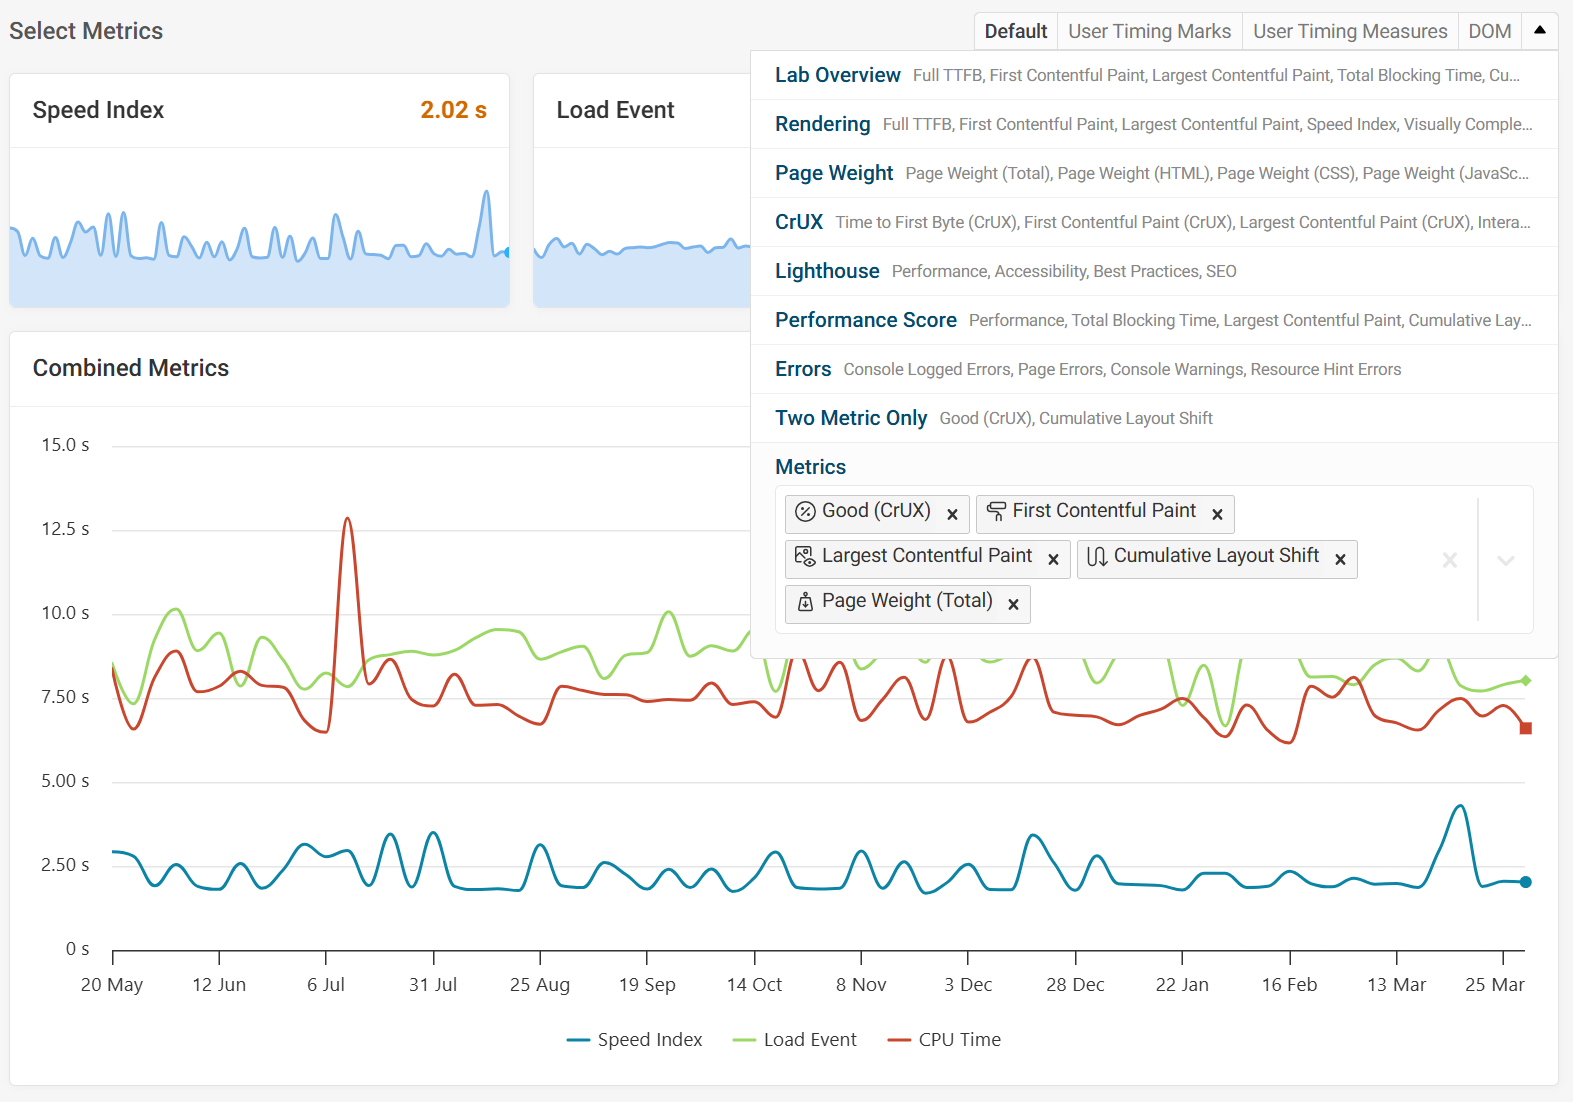
Select custom metrics in the page details view
You can also select metric groups in the Metrics tab of a single page.
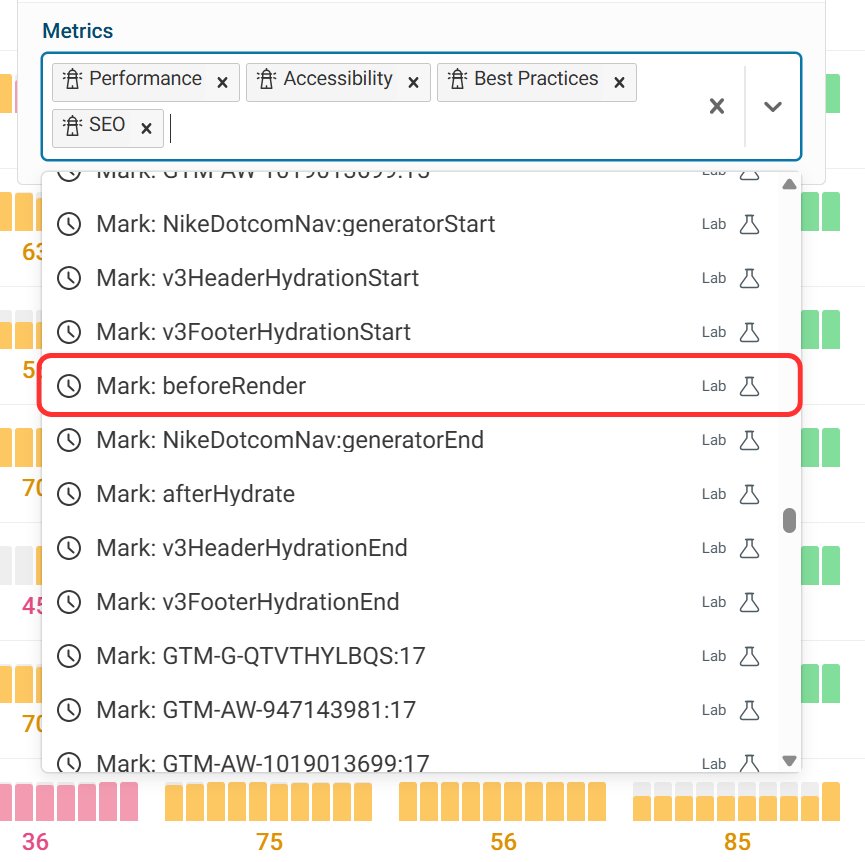
Custom User Timing Metrics
DebugBear supports custom metrics added with the User Timing API. For example, this screenshot shows a user timing mark that was created with performance.mark("beforeRender").
Save Metric Group
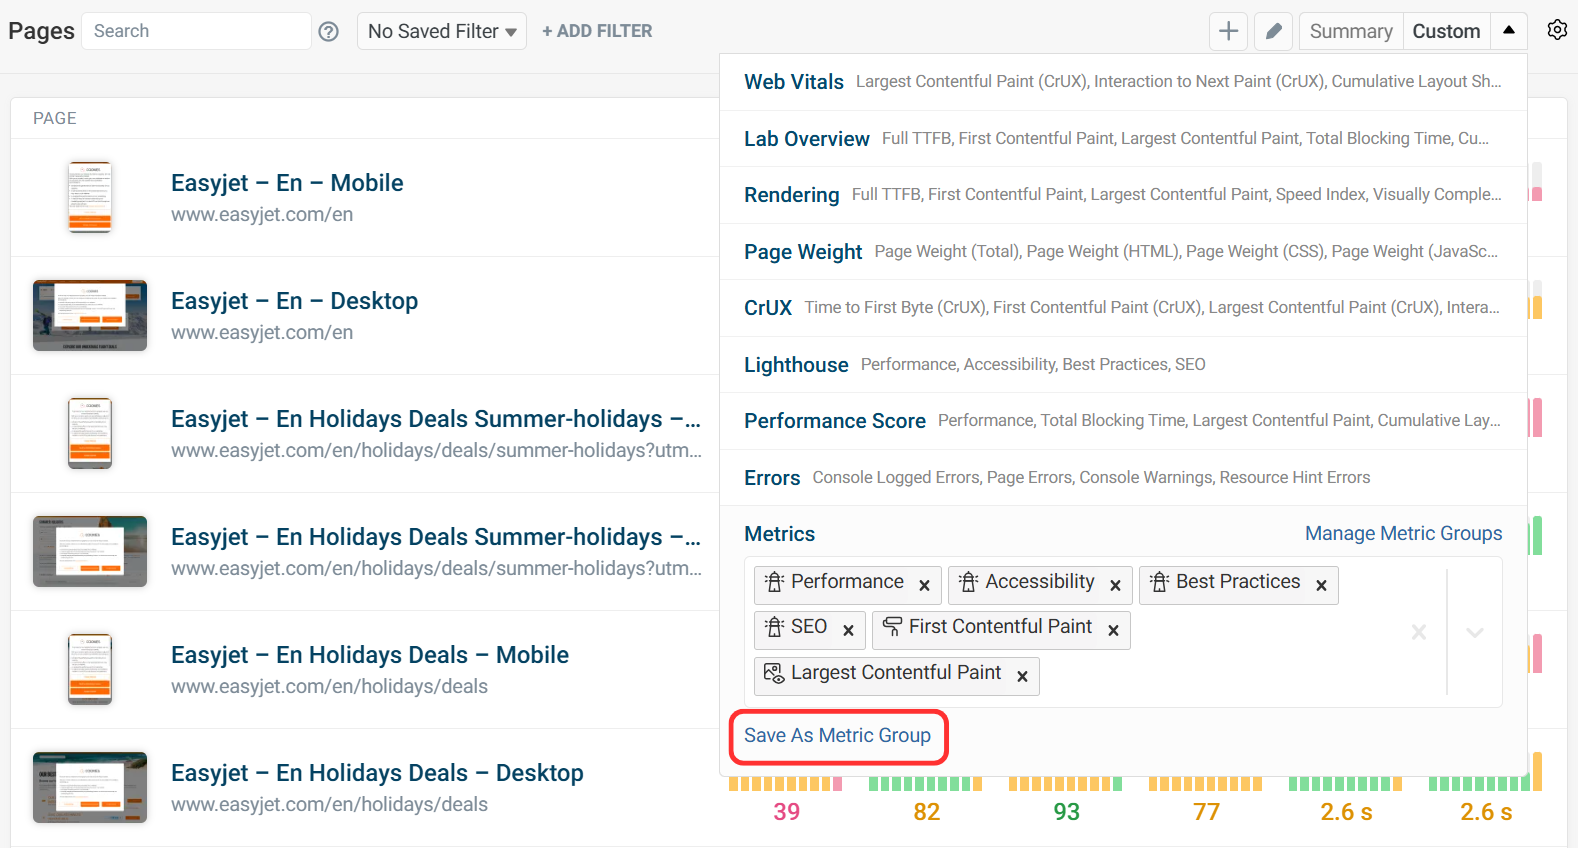
After adding or removing metrics in the dropdown you can click Save As Metric Group to re-use the selection later and share it with your team.
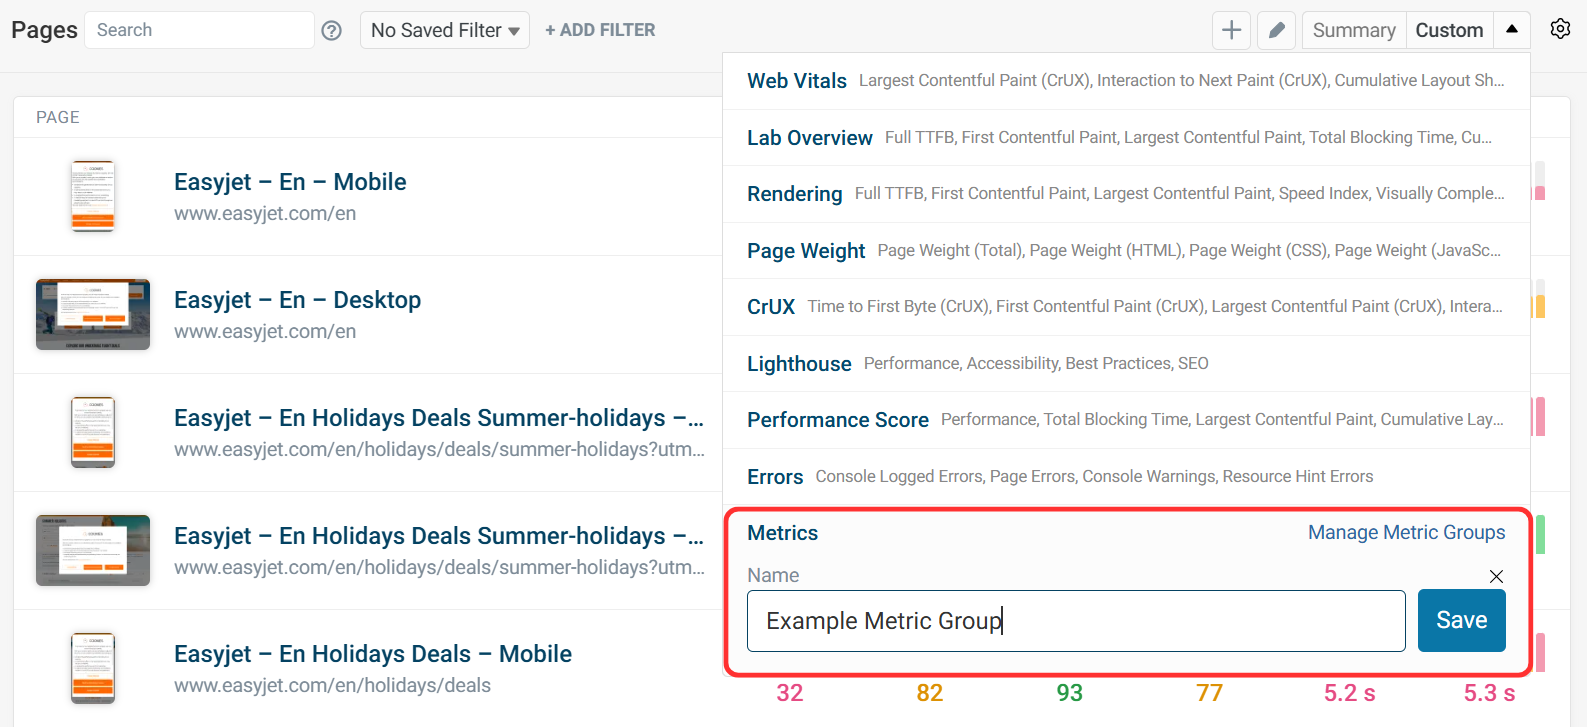
Enter a name and click Save.
Manage Metric Groups
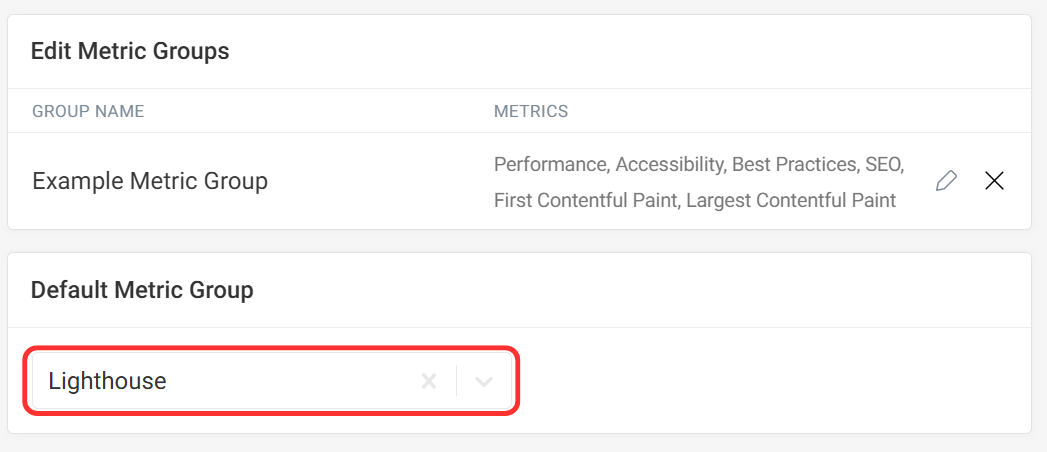
To manage metric groups first select Settings in the sidebar. Then scroll to the the Metric Groups section.
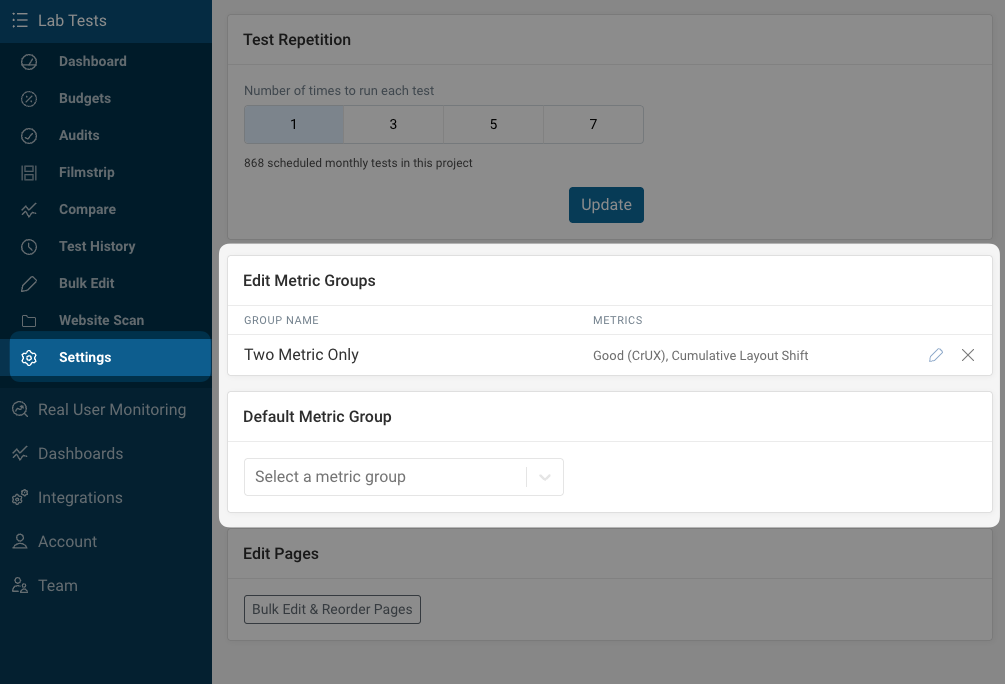
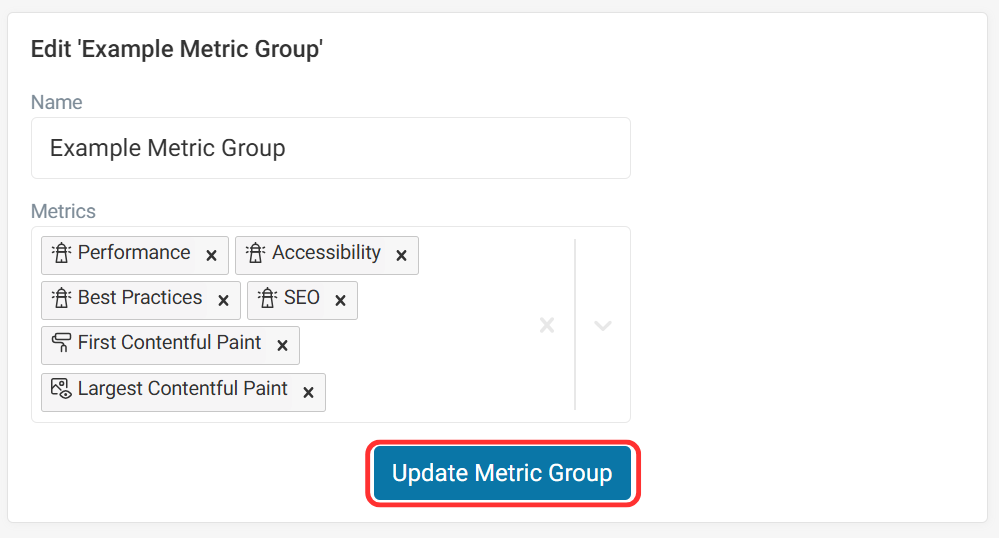
Add and remove metrics using the pencil icon, then click Update Metric Group.
Set Default Metric Group
Selecting a metric group from the dropdown will apply this metric group as the default display in the Lab Tests dashboard.