LCP Breakdown: Google's Performance Audit Explained
The new LCP breakdown insights audit in Lighthouse and PageSpeed Insights can help you identify the most impactful strategies to optimize your website's Largest Contentful Paint score.
What are the LCP breakdown components?
The LCP breakdown shows different components making up the Largest Contentful Paint (LCP) page speed metric. You can find them in the new insights section of PageSpeed Insights or in the Chrome DevTools Performance tab. The breakdown components are also called LCP subparts.
Each component describes a different part of the loading process for the largest content element on the page. The four LCP breakdown components are:
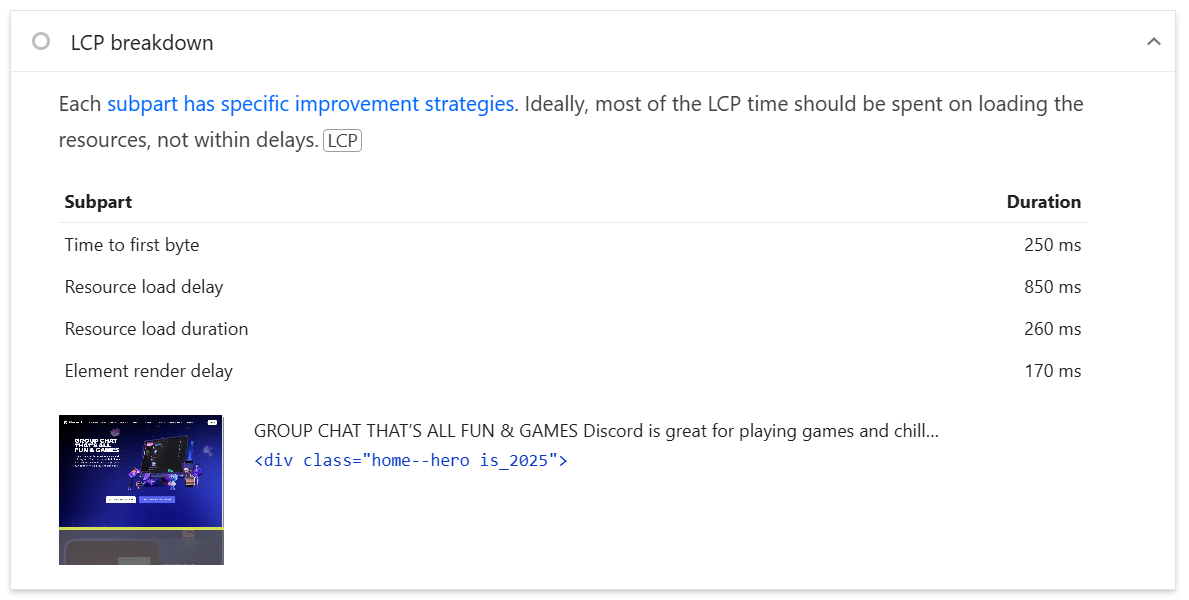
- Time to First Byte: time waiting for the HTML document server response
- Resource load delay: delay before the browser starts loading the main image
- Resource load duration: time spent fetching the main image
- Element render delay: time before the image or text content becomes visible
To optimize your LCP score you can look at the longest component of the LCP loading process and focus your efforts there. Lighthouse explains it like this:
Each subpart has specific improvement strategies. Ideally, most of the LCP time should be spent on loading the resources, not within delays.
How to optimize the LCP breakdown
The LCP breakdown exists to help you identify the biggest factor that's delaying the Largest Contentful Paint on your website.
Once you know the biggest contributing component, you can check out our detailed articles on each contributing factor listed above.
What does it mean if only two breakdown components are shown?
The resource load delay and load duration components only apply if the largest content element on your page is an image. The image is the "resource" being referenced here.
If the largest element on your page is a heading or other text component, then you'll only see the Time to First Byte and Render Delay components.
LCP breakdown in Chrome DevTools
The insights sidebar in the DevTools Performance tab also provides a way to view the LCP component breakdown.

In addition to the local test on your computer you'll also see field data, at least if your website gets enough traffic. This data is collected from real Chrome users as part of the Chrome User Experience Report (CrUX).
Measure LCP breakdown data in DebugBear
DebugBear lets you measure LCP subparts through scheduled synthetic tests, CrUX data, and real user monitoring.
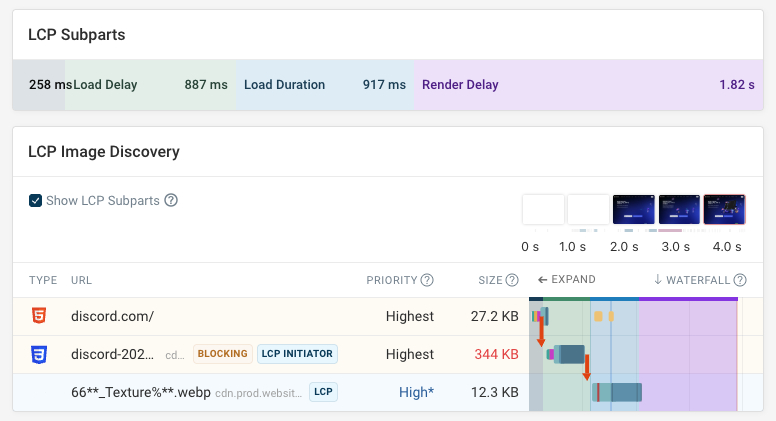
When inspecting your LCP score in a lab test you can see the different components that contribute overlaid on the request waterfall. That means you can also see how the LCP image request fits into the loading process.
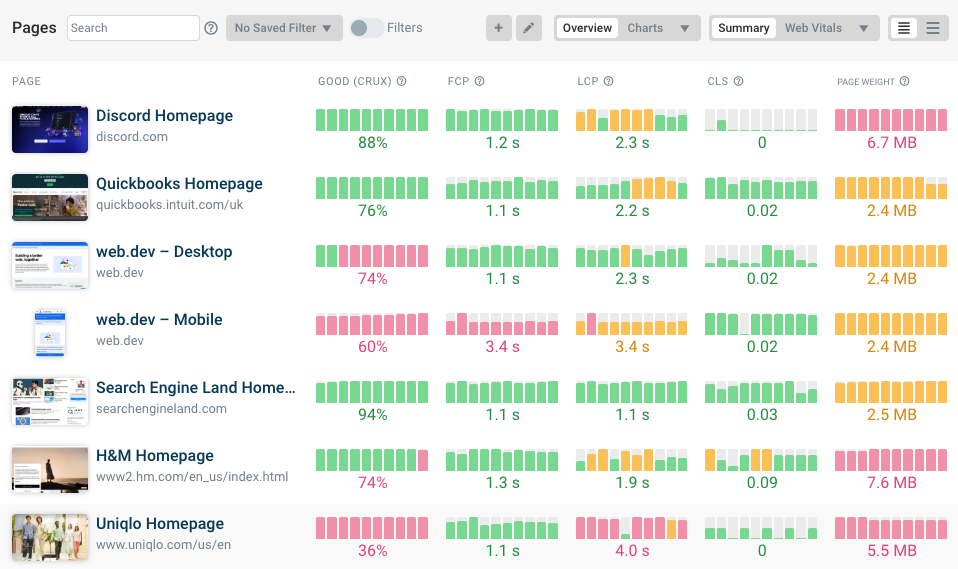
The Web Vitals tab lets you track this data for real Chrome users based on Google's CrUX data.
Note that for this data only page views where the LCP element is an image are considered.
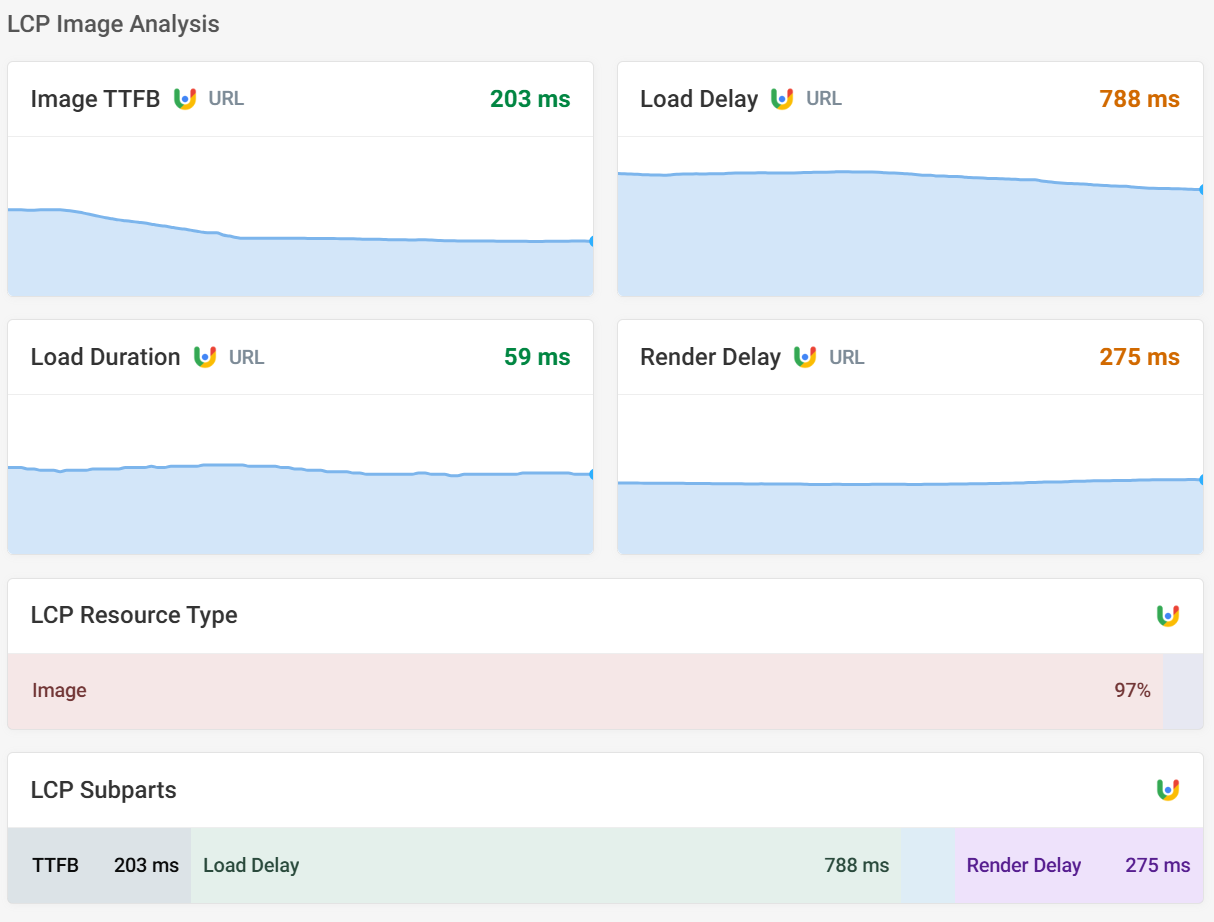
Finally, real user metrics let you see how different LCP breakdown components impact loading speed for different visitors. You also get a detailed dashboard for each of the four subpart metrics.

Monitor LCP and other Core Web Vitals on your website
DebugBear is a monitoring and testing tool for page load time and other website performance metrics. Its focus is on helping you optimize Google's three Core Web Vitals metrics that impact search result rankings.
You can test your website to get detailed performance insights as well as track competitor scores to see how you rank within your industry.


Monitor Page Speed & Core Web Vitals
DebugBear monitoring includes:
- In-depth Page Speed Reports
- Automated Recommendations
- Real User Analytics Data