
Web performance is important if you want to deliver a good user experience. But it's easy for websites to regress over time.
In this article, we'll explain how you can detect performance regressions, make the right people in your team aware of them, and get the data you need to identify what caused a regression.
Why is web performance monitoring important?
Performance issues often come up once a website is released, as features are gradually updated or third-party scripts are added. Monitoring your website is essential to maintaining good performance over time.
Slowdowns can reduce conversions, hurt SEO (search engine optimization) rankings, increase bounce rates, and negatively impact customer trust and revenue. The longer regressions go undetected, the more challenging it is to detect what changed and when.
Checking dashboards daily works, but isn't a sustainable or time-efficient solution. Automated monitoring and alerting solve this problem by continuously watching your metrics and notifying you the moment problems begin to arise.
When you get notified of a regression, you need the ability to compare test results over time and trace metric changes back to specific technical causes. For example:
- Was a heavier image added?
- Did a script start blocking the main thread?
The real value of performance monitoring comes from comparing test results after a change.
How to set up monitoring for your website
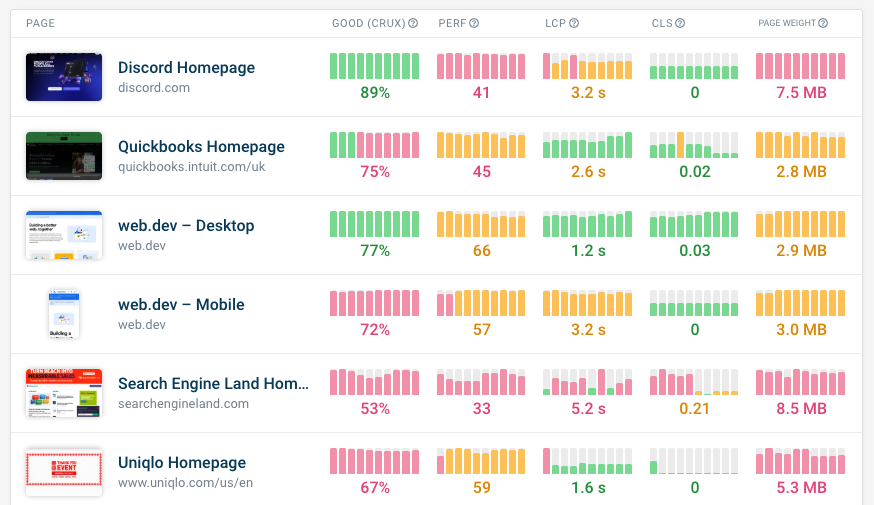
DebugBear lets you keep track of your web performance using scheduled synthetic tests, real user analytics, and Google CrUX data.
To run synthetic tests, all you need to do is add the URLs you want to monitor. To collect real user monitoring data you need to install a small JavaScript snippet on your website.
How to set up alerts
Once you've set up monitoring, you can configure budgets and notification channels to get alerted when performance changes.
What is a performance budget?
A performance budget allows you to set metric thresholds based on your needs. Once the threshold is breached, you and your team will receive an alert. This allows you to define which performance changes matter to your team and get notified immediately when thresholds are exceeded.
Budgets can also be enforced in CI/CD pipelines, catching issues before they reach production.
Why use performance budgets?
DebugBear automatically detects major changes on your website. But that doesn't necessarily match the metrics that matter to your team, or the frequency of alerts you need.
Performance budgets set clear boundaries for what constitutes a breach. If a metric crosses a threshold set up by your team, then investigation and a fix are needed. Without performance budgets, it becomes difficult to distinguish between normal metric fluctuations and meaningful regressions that require investigation.
Performance budgets add a layer of insurance to your monitoring:
- Custom thresholds tailored to your site: You can define thresholds that best suit your website rather than relying on the standard ones.
- Dashboard visibility: See which pages are meeting targets and which are failing.
- Proactive monitoring: Instead of receiving feedback from visitors that your website is slow, resolve the issue without damaging conversions and bounce rates.
Goals for a solid alerting setup
When setting up your first performance budgets, it's a good idea to think about what purpose they serve and how often your team is alerted.
Overall, the goal is to catch regressions in real time, before they impact users or business metrics. Before creating your first performance budget, consider the following questions:
- What does our previous data look like? Setting up thresholds starts by looking at recent data. You want budgets that reflect a true trend change.
- What channels should notifications be sent to? Alerts can be delivered by email or to an integration such as Slack or Teams. Deciding which team members receive these alerts, and where they're sent, is vital so changes can be resolved together as they happen.
- Will these alerts lead to action? If goals are unrealistic, then many alerts could be ignored. Setting appropriate budgets will avoid notification fatigue.
You also need to make sure your alerts stay up to date, since they can become outdated as pages improve. Taking stock every few months allows budgets to be adjusted and remain meaningful.
Understanding performance thresholds
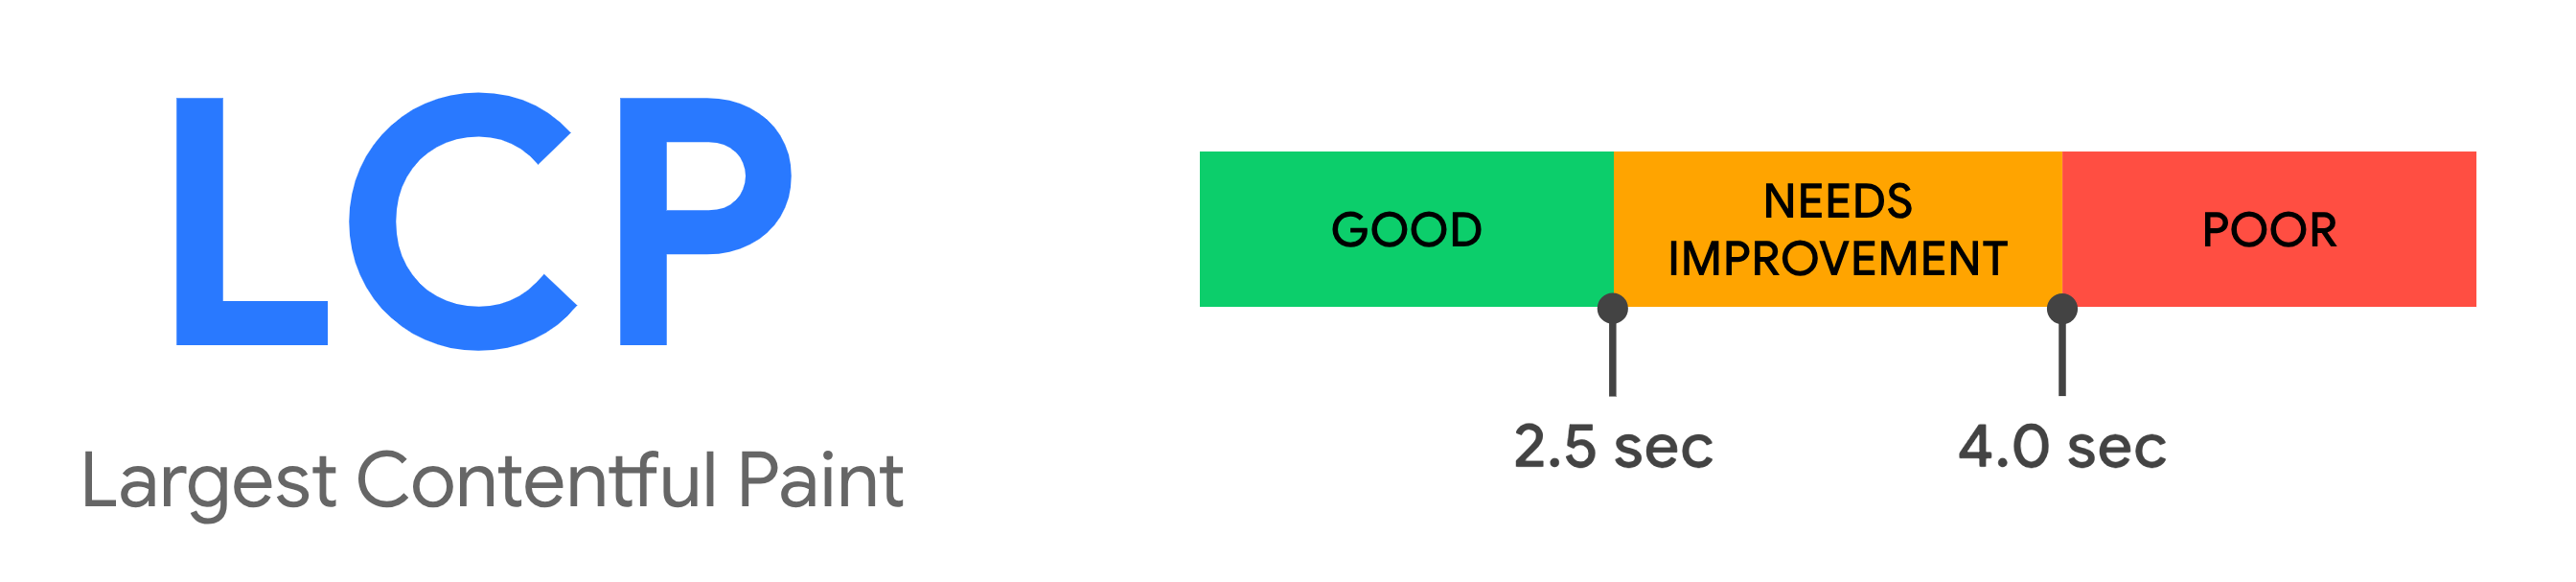
A great way to understand performance budgets is by looking at the Largest Contentful Paint (LCP) thresholds. There are three ranges: Good, Needs Improvement, and Poor.
- Good — 2.5 seconds and under
- Needs Improvement — 2.5 to 4 seconds
- Poor — Over 4 seconds
These thresholds provide a starting point, but your budgets should reflect your site's current situation. In this example from searchengineland.com in our demo project, the LCP score is currently 2.23 seconds, with a recent history of heavy regressions.
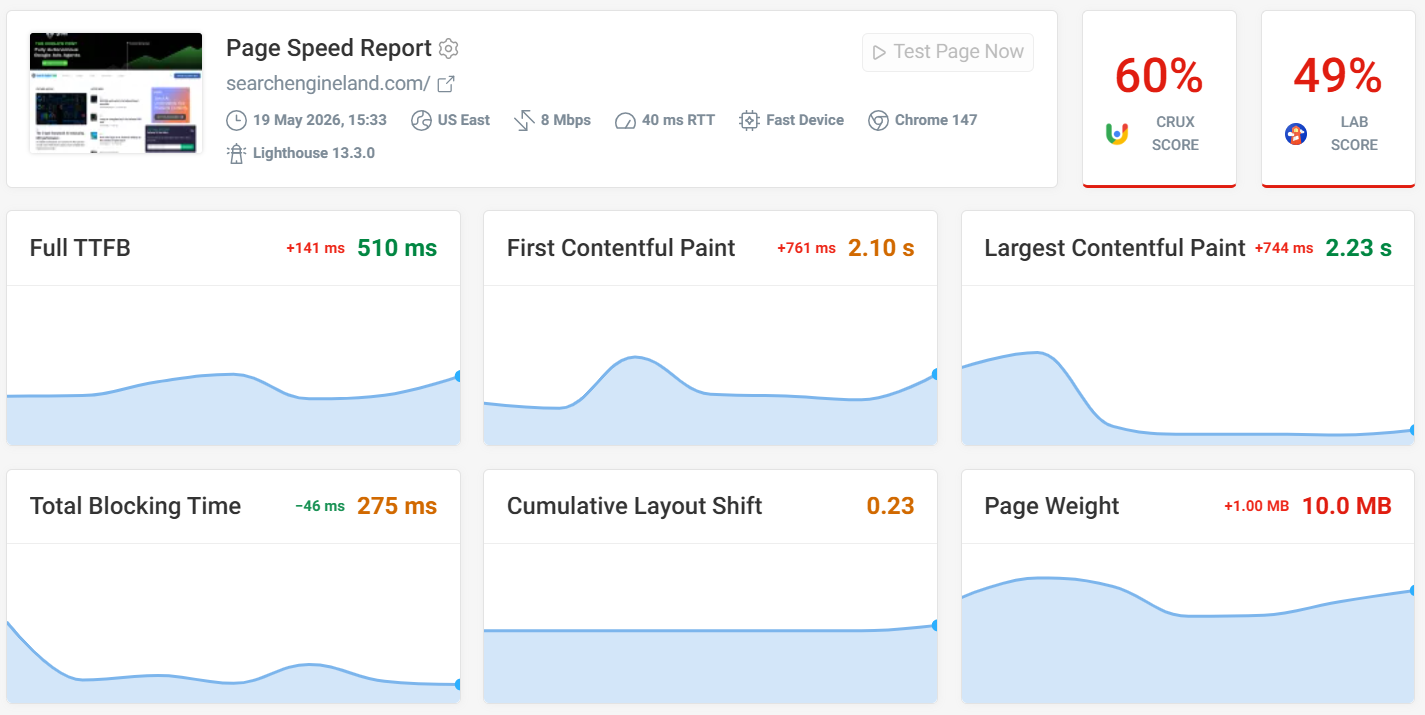
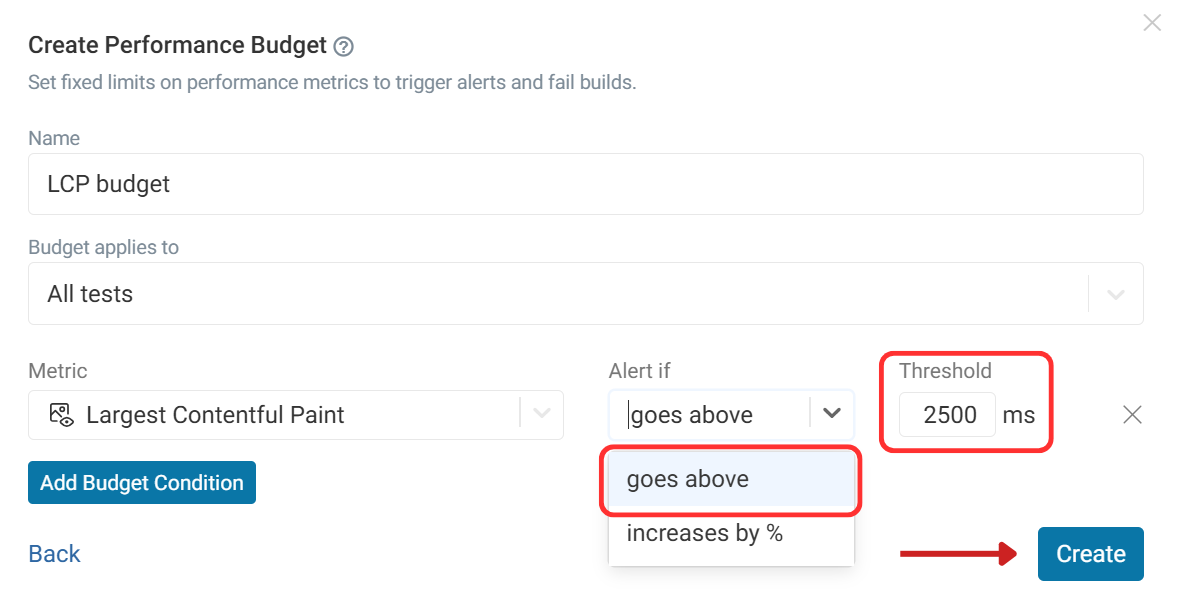
Setting a budget at 2500 ms ensures you're notified before visitors endure a slow experience.
Setting up your first performance budget
You can configure performance budgets in your page settings. Open a monitoring result, select Page Settings in the sidebar, click Show Advanced, then Add Performance Budget.
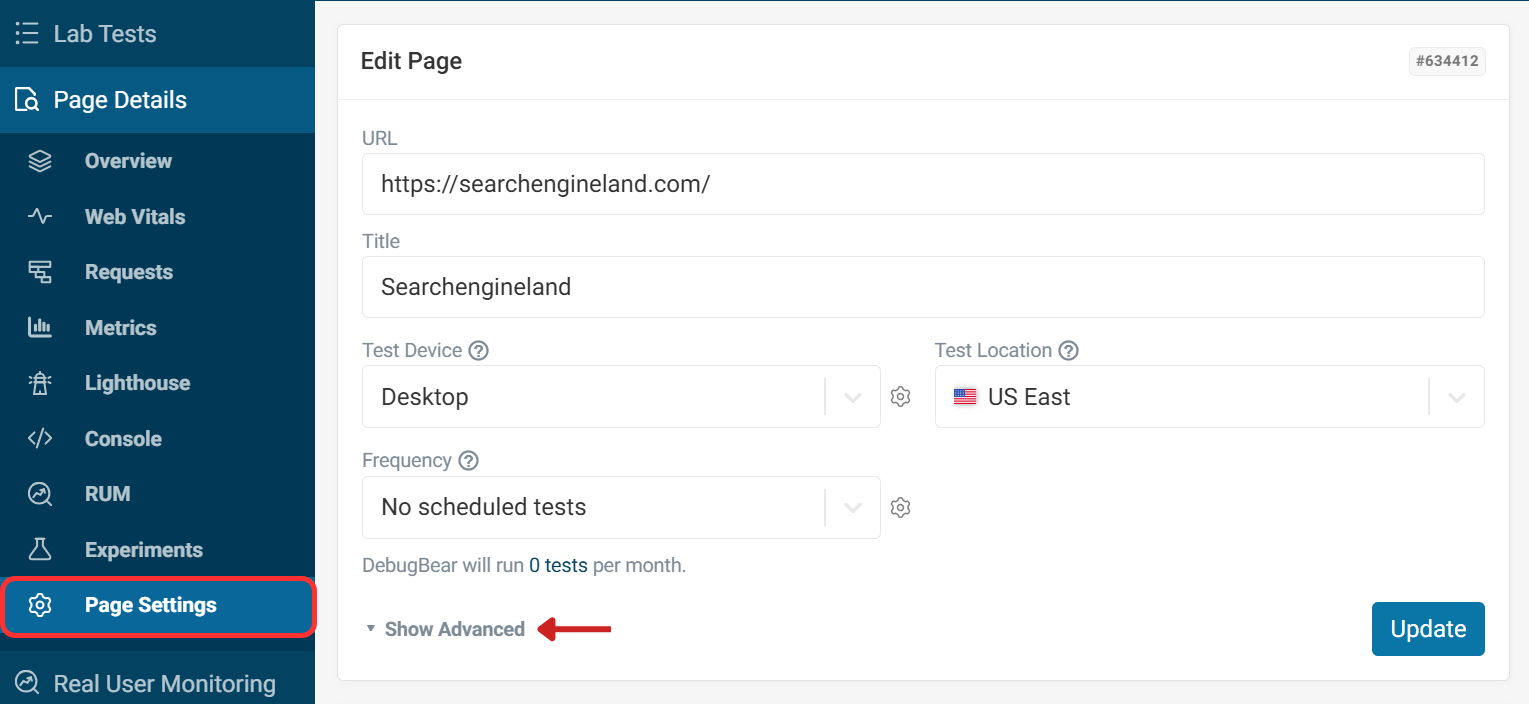
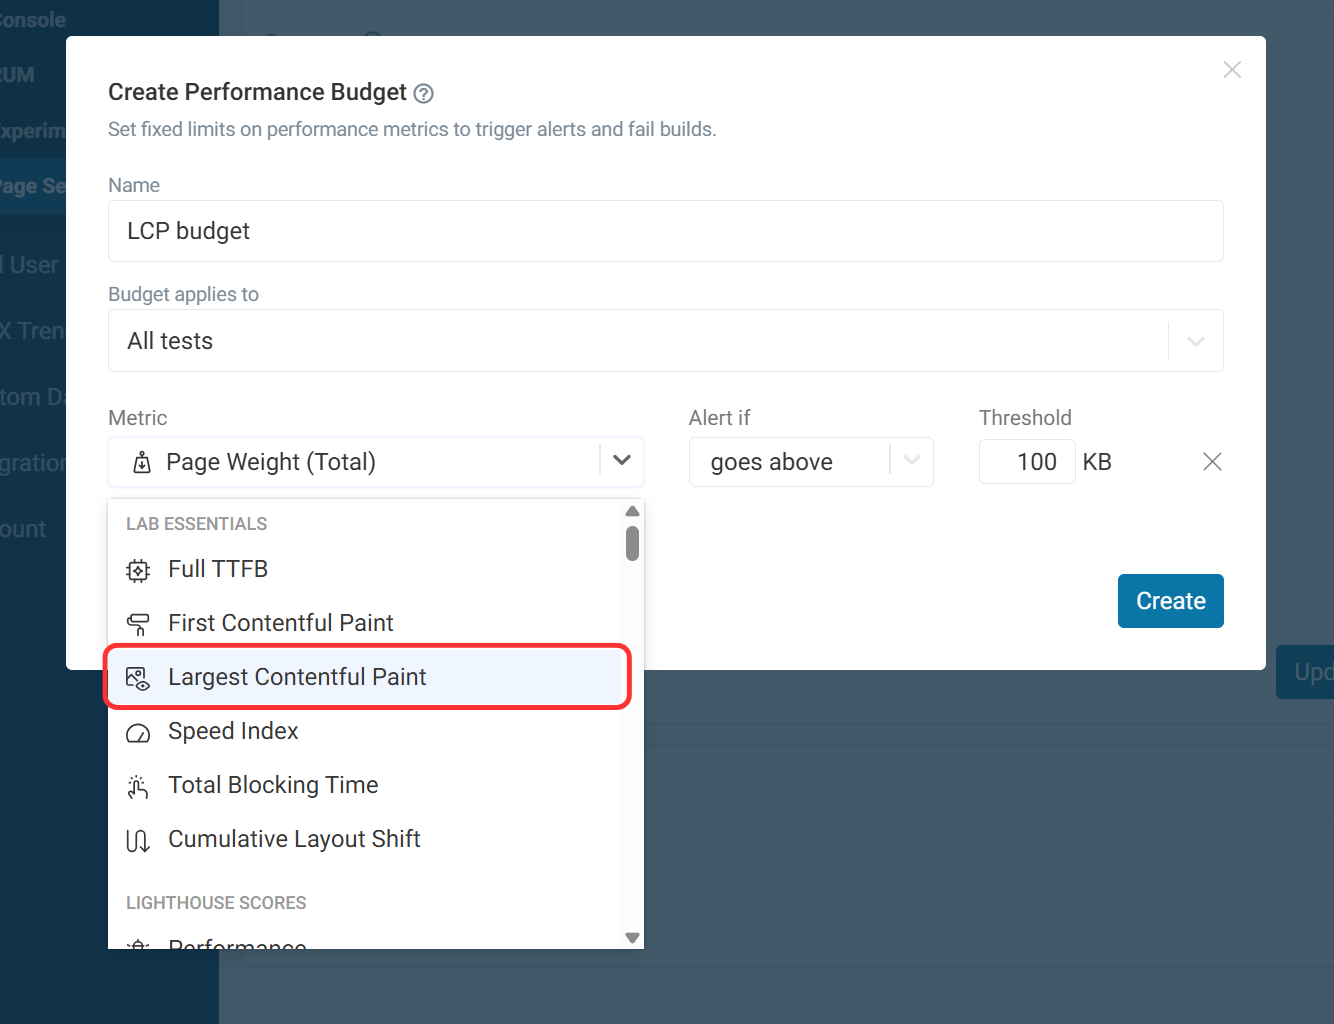
Click Create Performance Budget to define a new budget. Name your budget and select the metric you want to be alerted on. In this case, we want Largest Contentful Paint.
Next, we need to create the alert condition. Since we are dealing with the LCP good threshold, we can select 'goes above' and add 2500 ms as our threshold. Then click Create and save the page settings.
For detailed step-by-step instructions, see the performance budgets documentation.
Which metrics should you set alerts for?
If you're new to performance budgets, the fewer metrics you set alerts for, the better. This helps avoid alert fatigue: if a lot of alerts are consistently coming in from many different metrics, they may ultimately get ignored.
Critical metrics, such as the Core Web Vitals are a great place to start. You can then fine-tuner alert thresholds for your website. Let's take a look at some key metrics and the reasons for monitoring them.
Largest Contentful Paint
LCP measures when the main content becomes visible. Set a "goes above" alert at the good threshold (2500ms) or slightly below your current baseline to catch regressions early.
Cumulative Layout Shift
Cumulative Layout Shift (CLS) measures visual stability by tracking how much page content unexpectedly shifts during loading. Layout shifts frustrate users and often indicate missing image dimensions, font swaps, or injected ad content. A good CLS score is under 0.1, so set your budget there.
Interaction to Next Paint
Interaction to Next Paint (INP) measures responsiveness by tracking the time from user interaction to the next paint. High INP indicates that the main thread is blocked, often due to heavy JavaScript execution. A good INP score is under 200ms, but consider an "increases by" alert of 20% to catch significant regressions relative to your baseline.
Real-time INP can only be measured well with real user data. You can check CrUX INP scores, but those will take a few weeks to update since Google aggregates data over a 28-day rolling window.
You can use Total Blocking Time (TBT) as a very rough proxy for interaction delays on your page. Or you can script specific interactions in your synthetic checks and measure INP scores for them.
Time To First Byte
Time To First Byte (TTFB) measures server response time. Poor TTFB delays every other loading milestone. The good range is under 800ms, but an "increases by" alert of 10% can catch server-side regressions before they cascade into user-facing problems.
First Contentful Paint
First Contentful Paint (FCP) measures how quickly users see the first piece of visible content. FCP and LCP often share bottlenecks, so an FCP regression may signal an LCP issue as well. The good threshold is 1.8 seconds.
Lighthouse Performance Score
The Lighthouse Performance score provides an overall assessment on a scale of 0 to 100. A score below 90, or a significant percentage drop, can indicate broad regressions that individual metrics might not surface clearly.
Page Weight
Page weight (the total size of all resources) doesn't always correlate with poor performance, but monitoring it can explain LCP or FCP regressions. An "increases by" alert of 5% helps you catch when new assets are added that might impact loading.
Unlike page load milestone metrics, page weight is often more stable and does not depend on random variation in server response timings.
The budgets dashboard
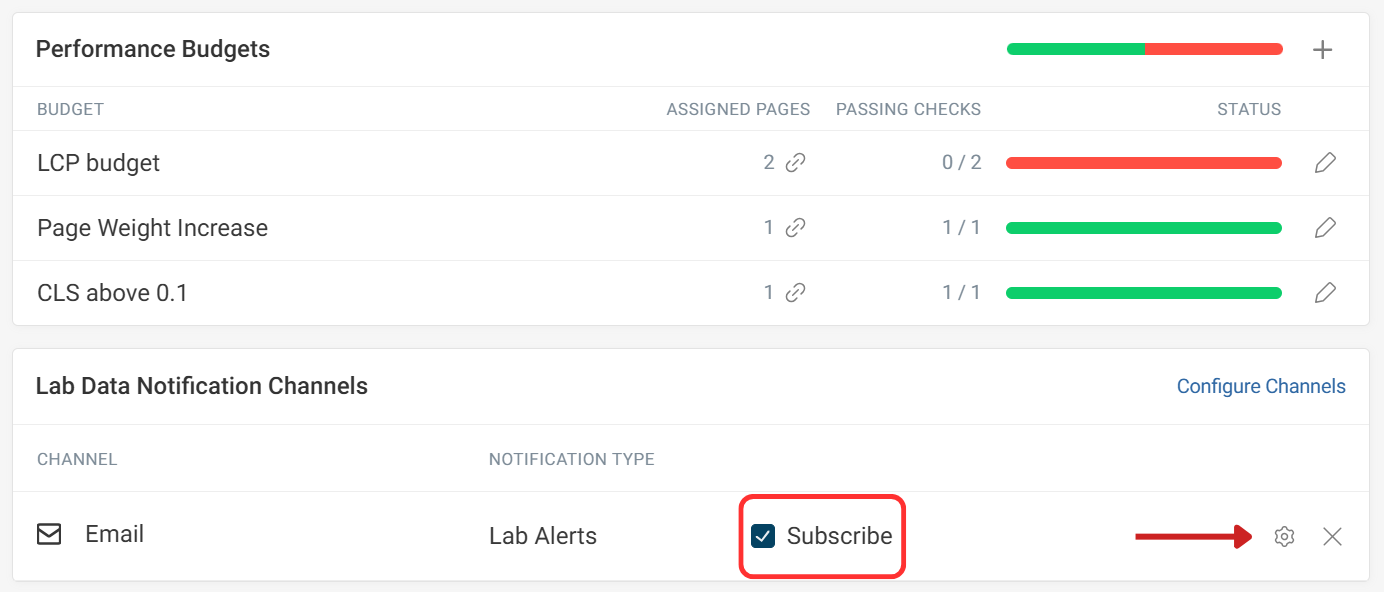
Once you've set up performance budgets, the budgets dashboard provides a centralized view of all pages and their budget status. Any team member can quickly see which pages have budgets applied and whether they're currently passing or failing. New budgets can be created by clicking the plus icon in the top right corner.
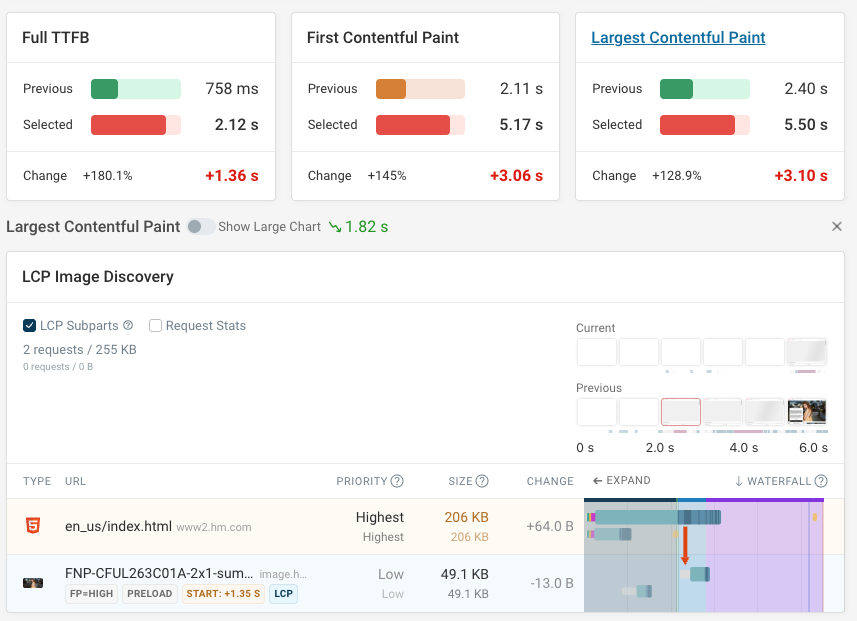
Viewing the budgets dashboard here, we can see that there has been a major LCP regression.
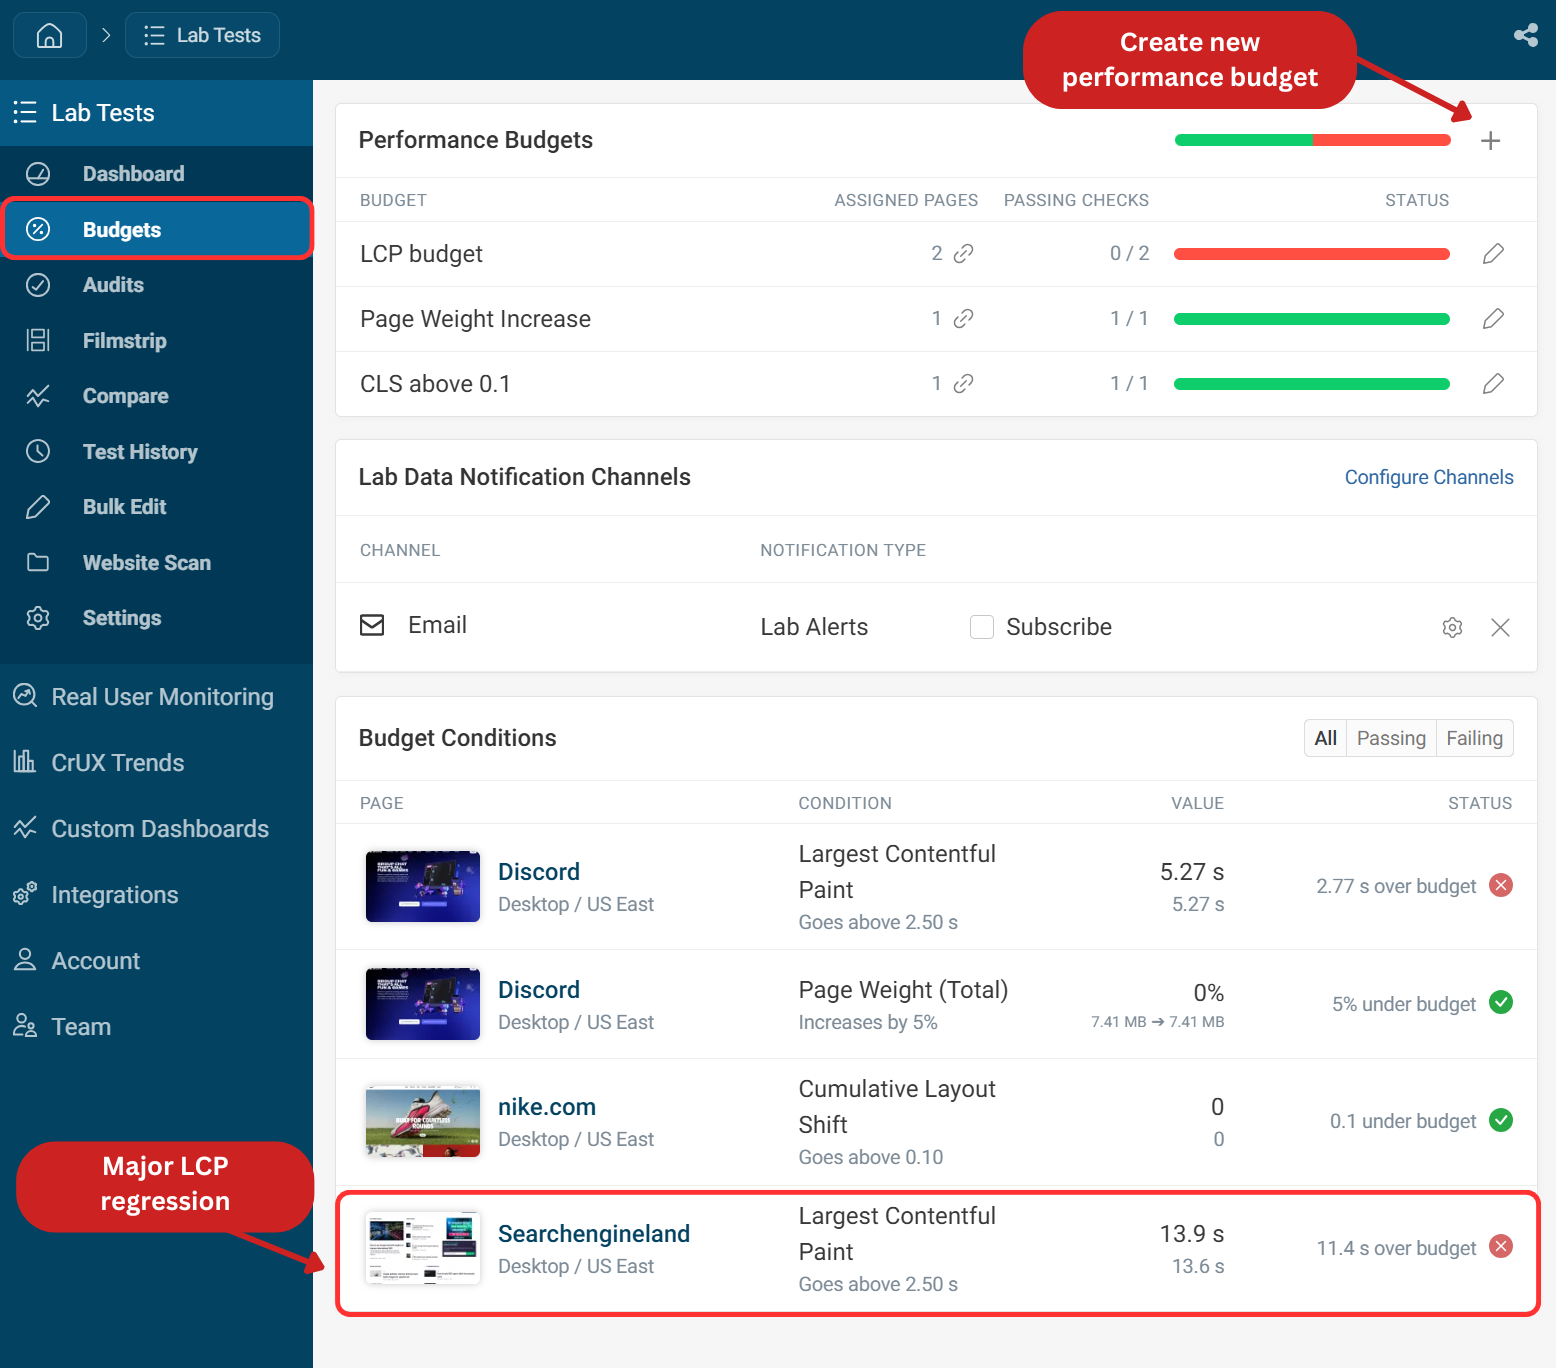
Clicking on the page will show the latest test result with the change. You can use the compare pages toggle to identify what caused the regression.
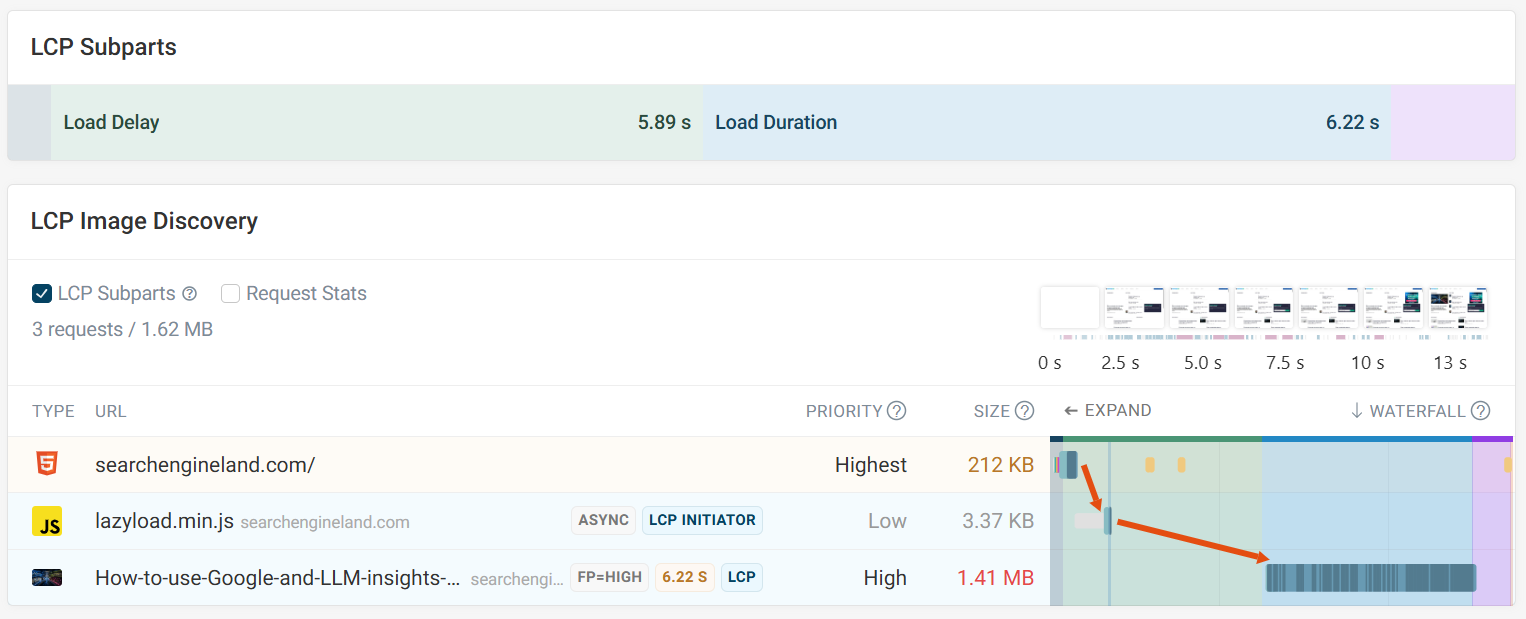
In this case, we can see the LCP image has changed, with the new image now being dependent on an additional LCP initiator request.
Setting up alerts for your team
Email alerts work, but they have limitations as they can easily be missed. When a performance regression happens, you want the alert to land where your team is already working. Pairing email notifications with team chat integrations means faster action to fix issues.
Integrating alerts with tools like Slack makes performance monitoring more collaborative and efficient. Alerts are delivered to a dedicated channel where the whole team can see them immediately. This keeps conversations in context, allowing team members to discuss regressions directly where the alert appeared, share findings, and coordinate fixes faster without the need to forward emails.
Configure alert notification channels
To set up email notifications, mark the subscribe checkbox. Click the gear icon to configure notification settings.
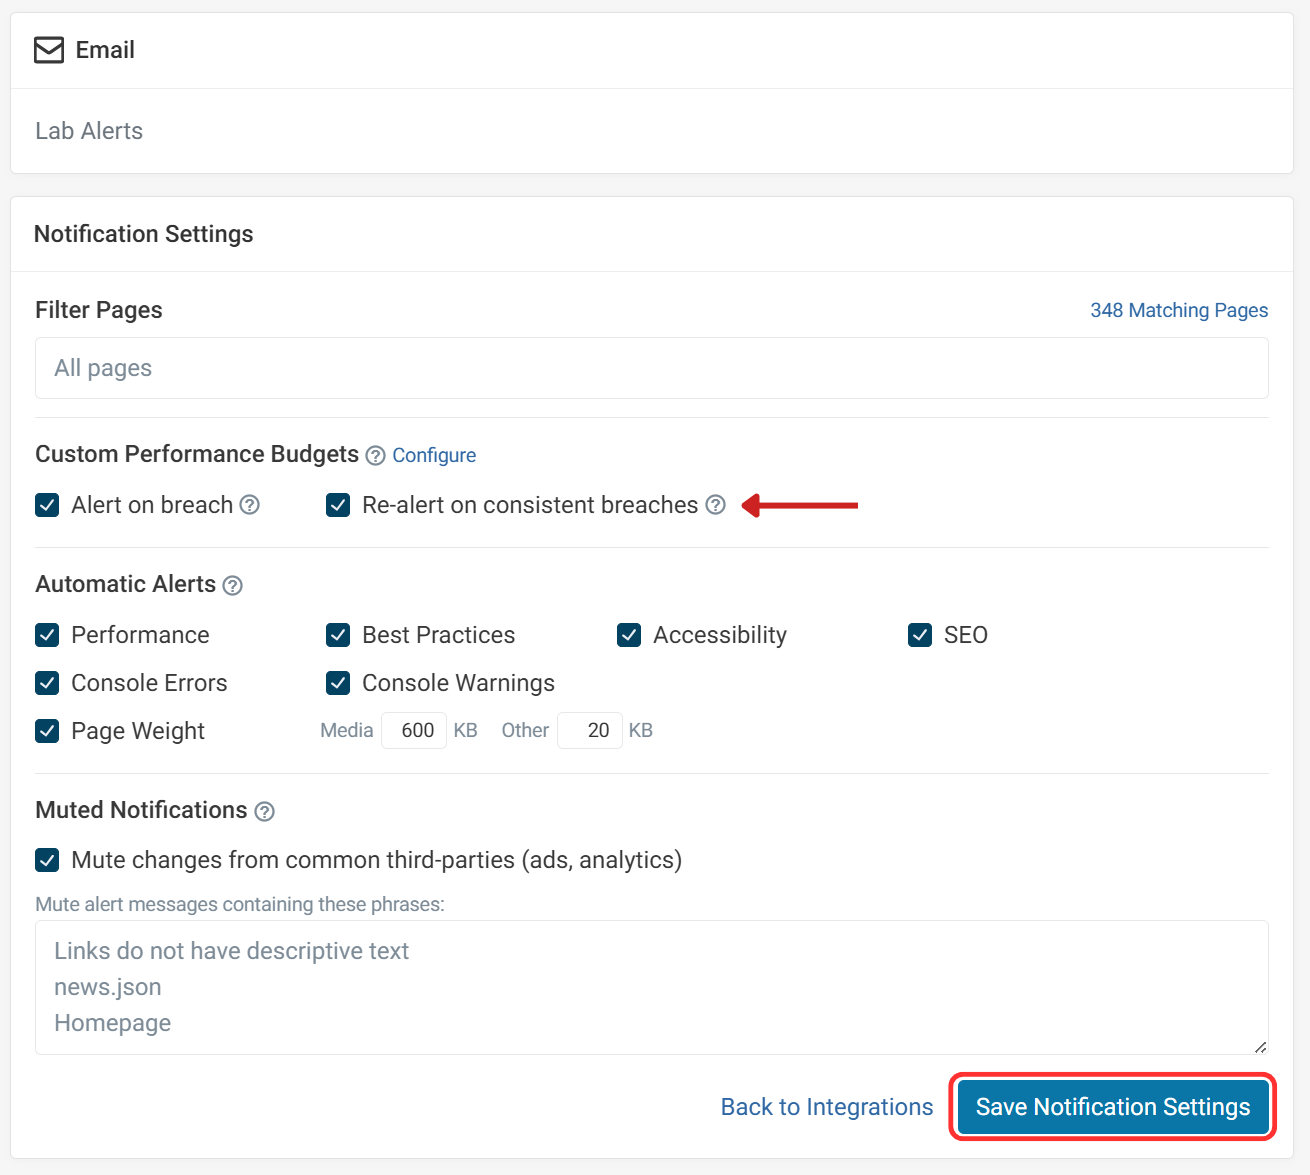
The Re-alert on consistent breaches option continues sending notifications while a budget remains breached. This setting ensures that further emails are sent if the breach continues.
You can also select which automatic alerts you want to receive, or mute notifications to reduce noise and keep alerts relevant.
Slack integration
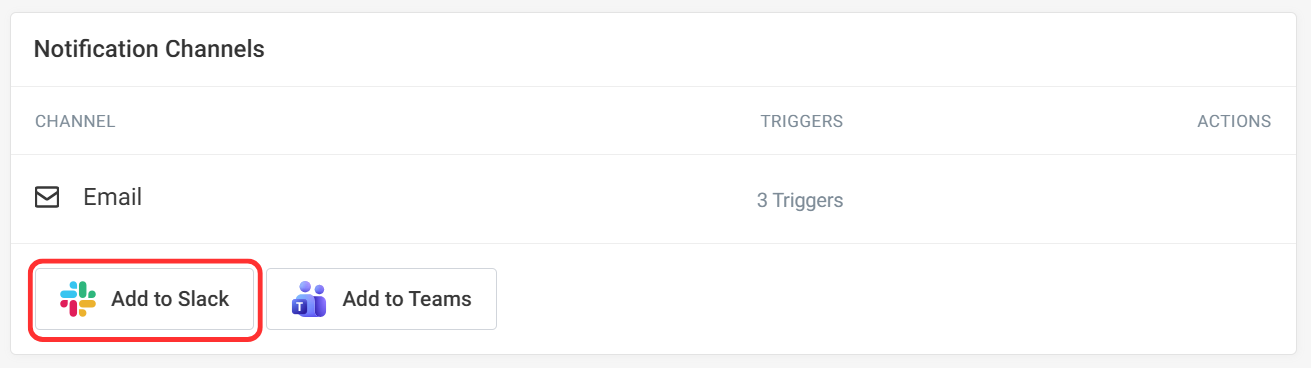
To integrate with Slack, click Configure Channels on the budget dashboard to reach the integrations page, then Add to Slack. After authorizing access, select your channel and choose which alert types to send.
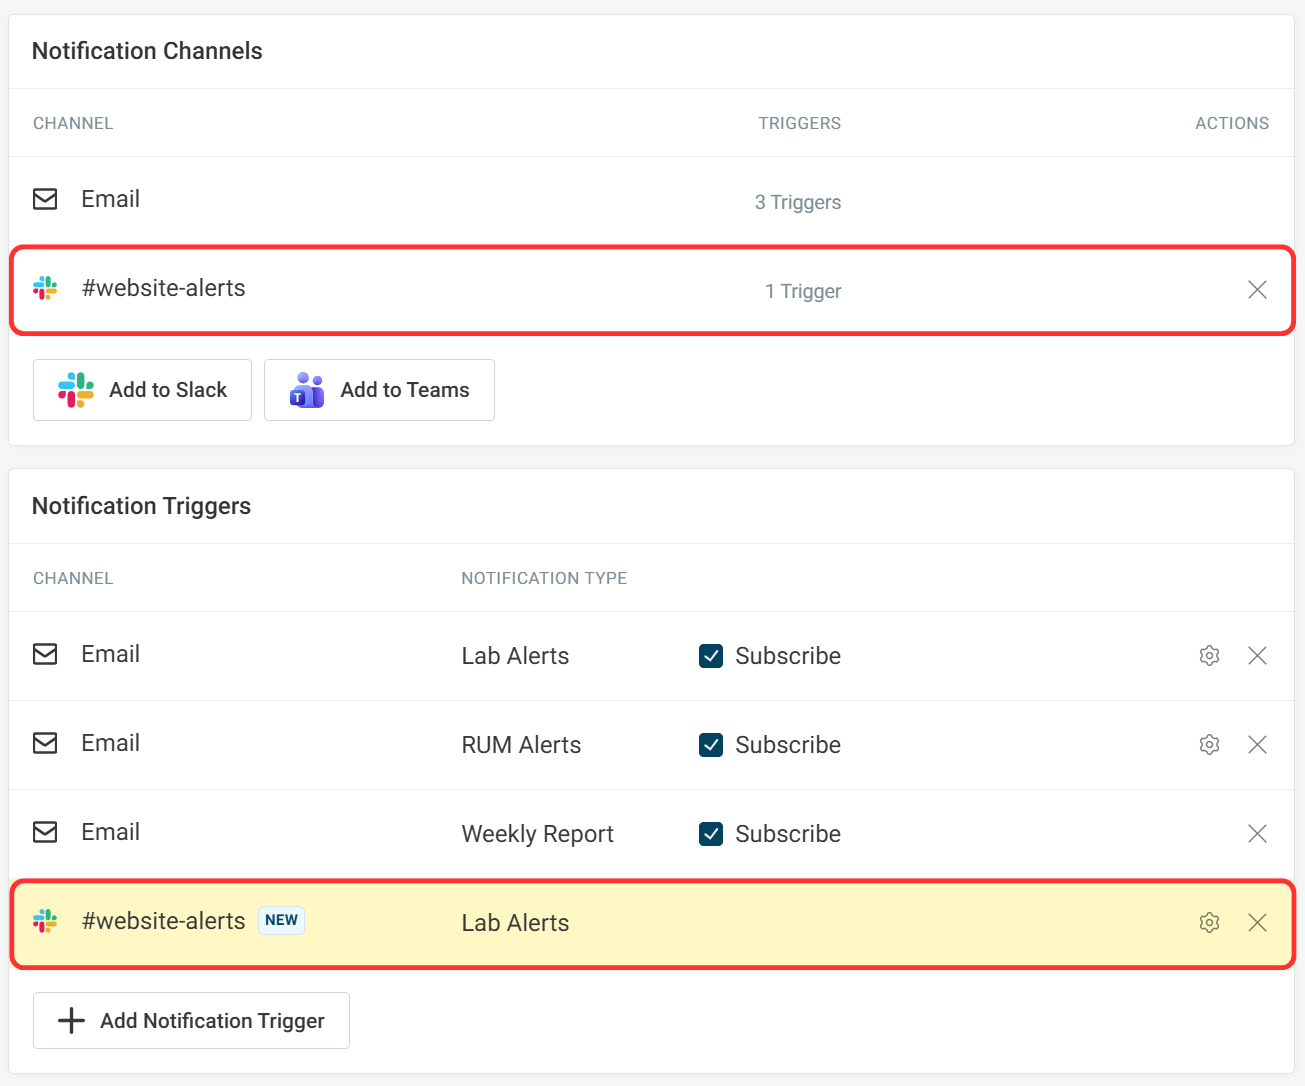
In this example, we created a new Slack channel called #website-alerts. Now all lab alerts will be automatically sent to this channel for your team to receive. For complete setup instructions, see the Slack integration guide.
What happens after an alert?
Once a budget is breached and an alert is received, you can quickly act to resolve the issue. Using the compare toggle on a test result is a great way to view test data side by side, making it easier to spot regressions and investigate their cause.
By comparing results over time, you can identify which changes introduced the issue, make a fix, and quickly confirm that performance is back to normal. This cycle of alerting, investigating, fixing, and verifying problems is what makes monitoring an important part of maintaining performance.
For example, when a synthetic alert is triggered, the comparison page lets you see what metrics changed. From there you can dive into specific technical changes: were new resources added to the page? Did the priority of a request change? Are there new long CPU tasks?
You can also visually compare test results and view a side-by-side video recording of the page load. That makes it easy to show team members the end-user impact of a regression.
Real User Monitoring alerts
You can also set up Real User Monitoring (RUM) alerts to surface issues affecting visitors.
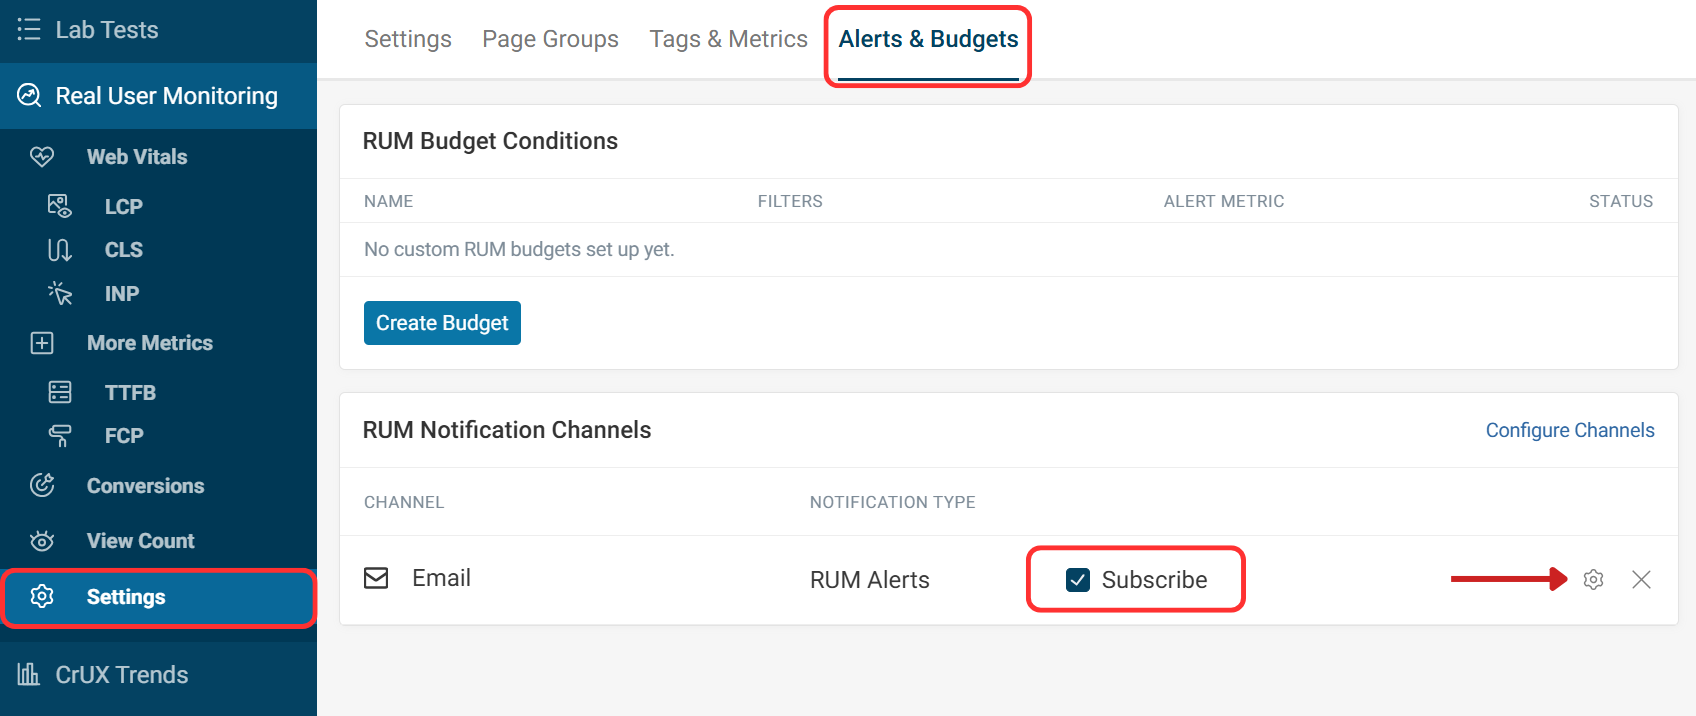
Within RUM settings, go to the Alerts & Budgets tab and subscribe to email alerts. Click the gear icon to configure alert frequency and metric thresholds.
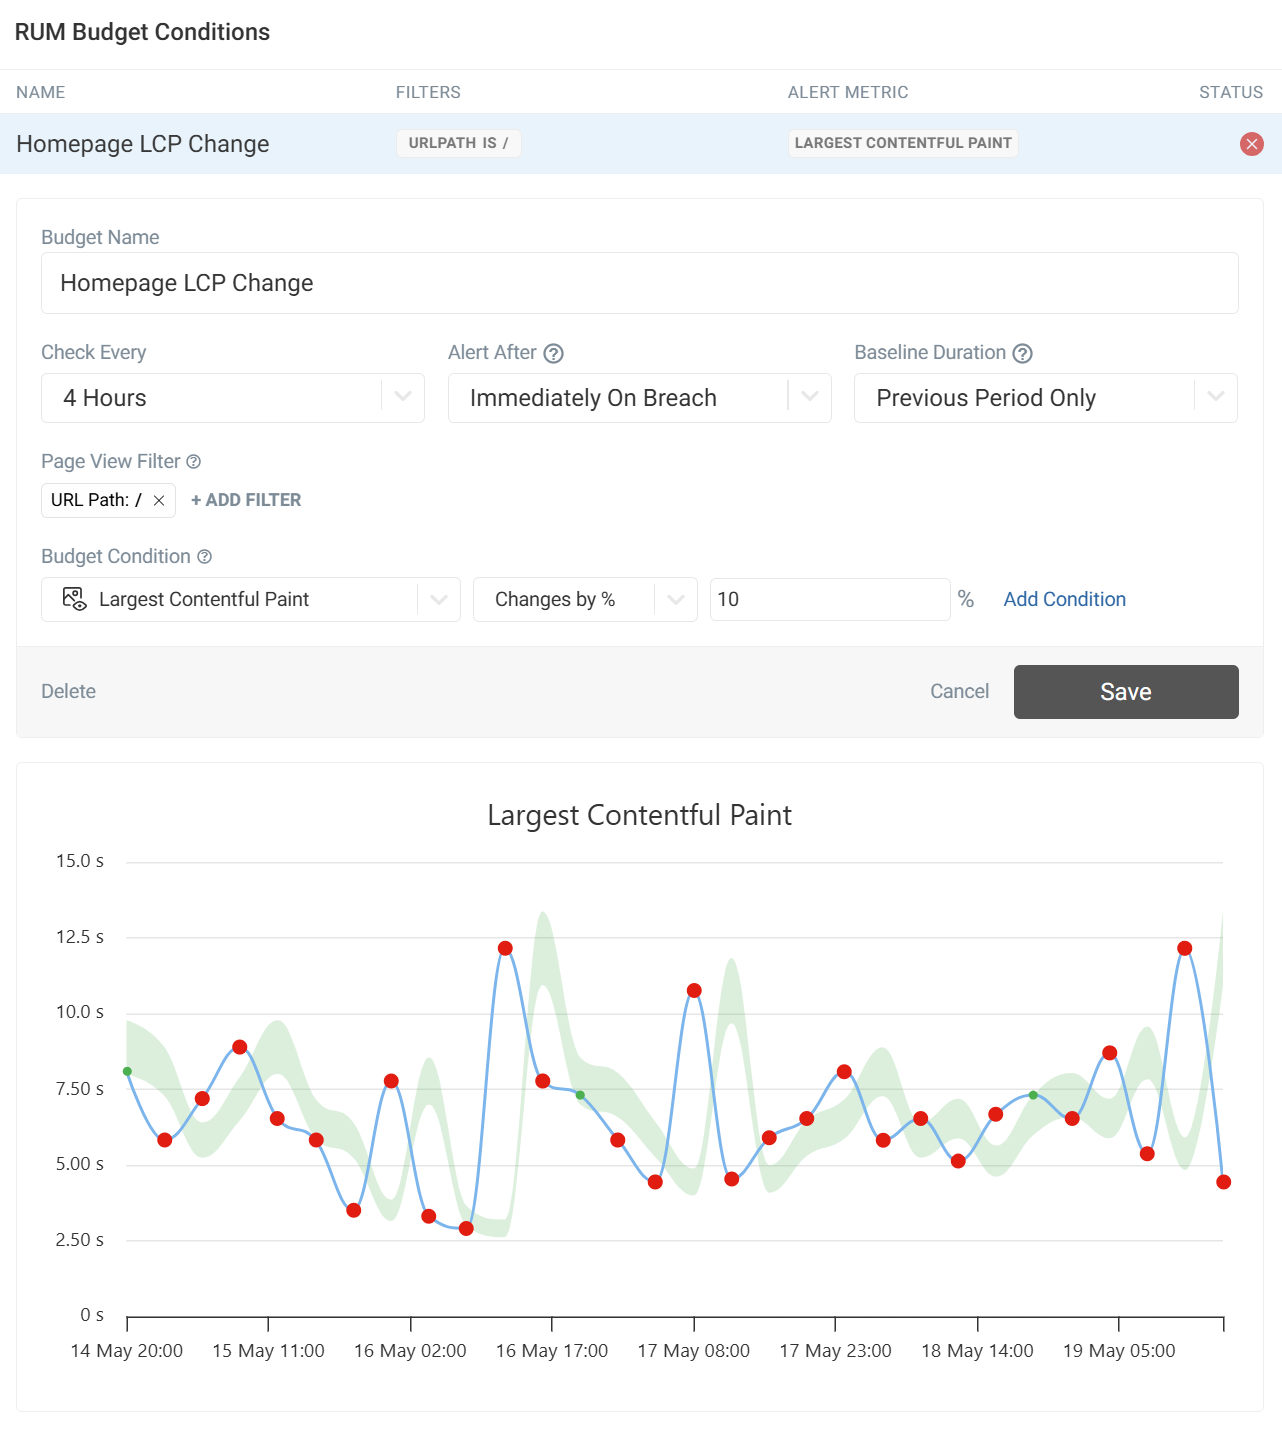
For custom budgets, click Create Budget and configure the following conditions:
- Check Every: How often to evaluate the budget (hourly to every 72 hours)
- Alert After: When to notify (immediately, once after breach, or twice after breach)
- Baseline Duration: The reference period for detecting changes
In this example, we have set up a custom budget to monitor the LCP score for the homepage. This is checked every 4 hours. If there is an increase of 10% compared to the last 4 hours, an alert will be sent.
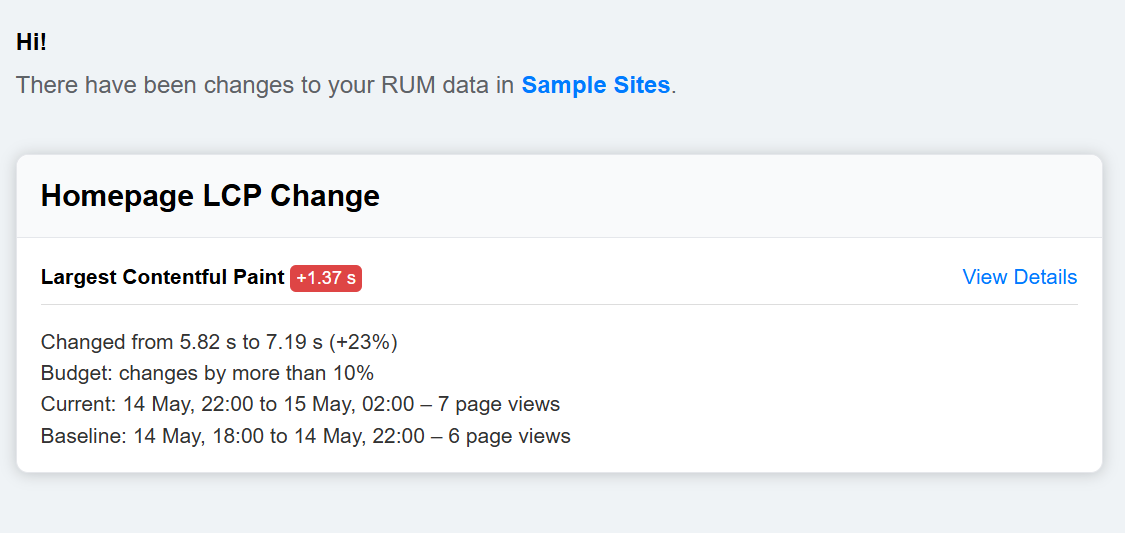
When a RUM alert is breached, an email will be sent notifying you of the change.
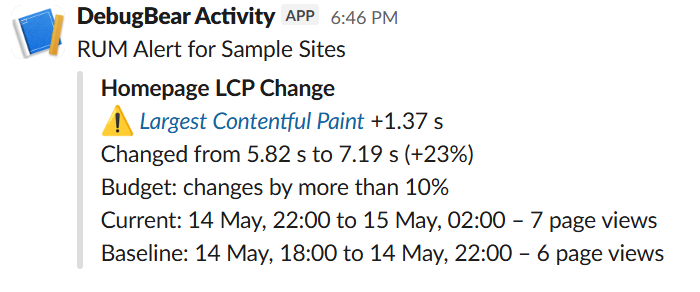
If you have Slack integration set up, these alerts can be configured to be sent to a dedicated Slack channel.
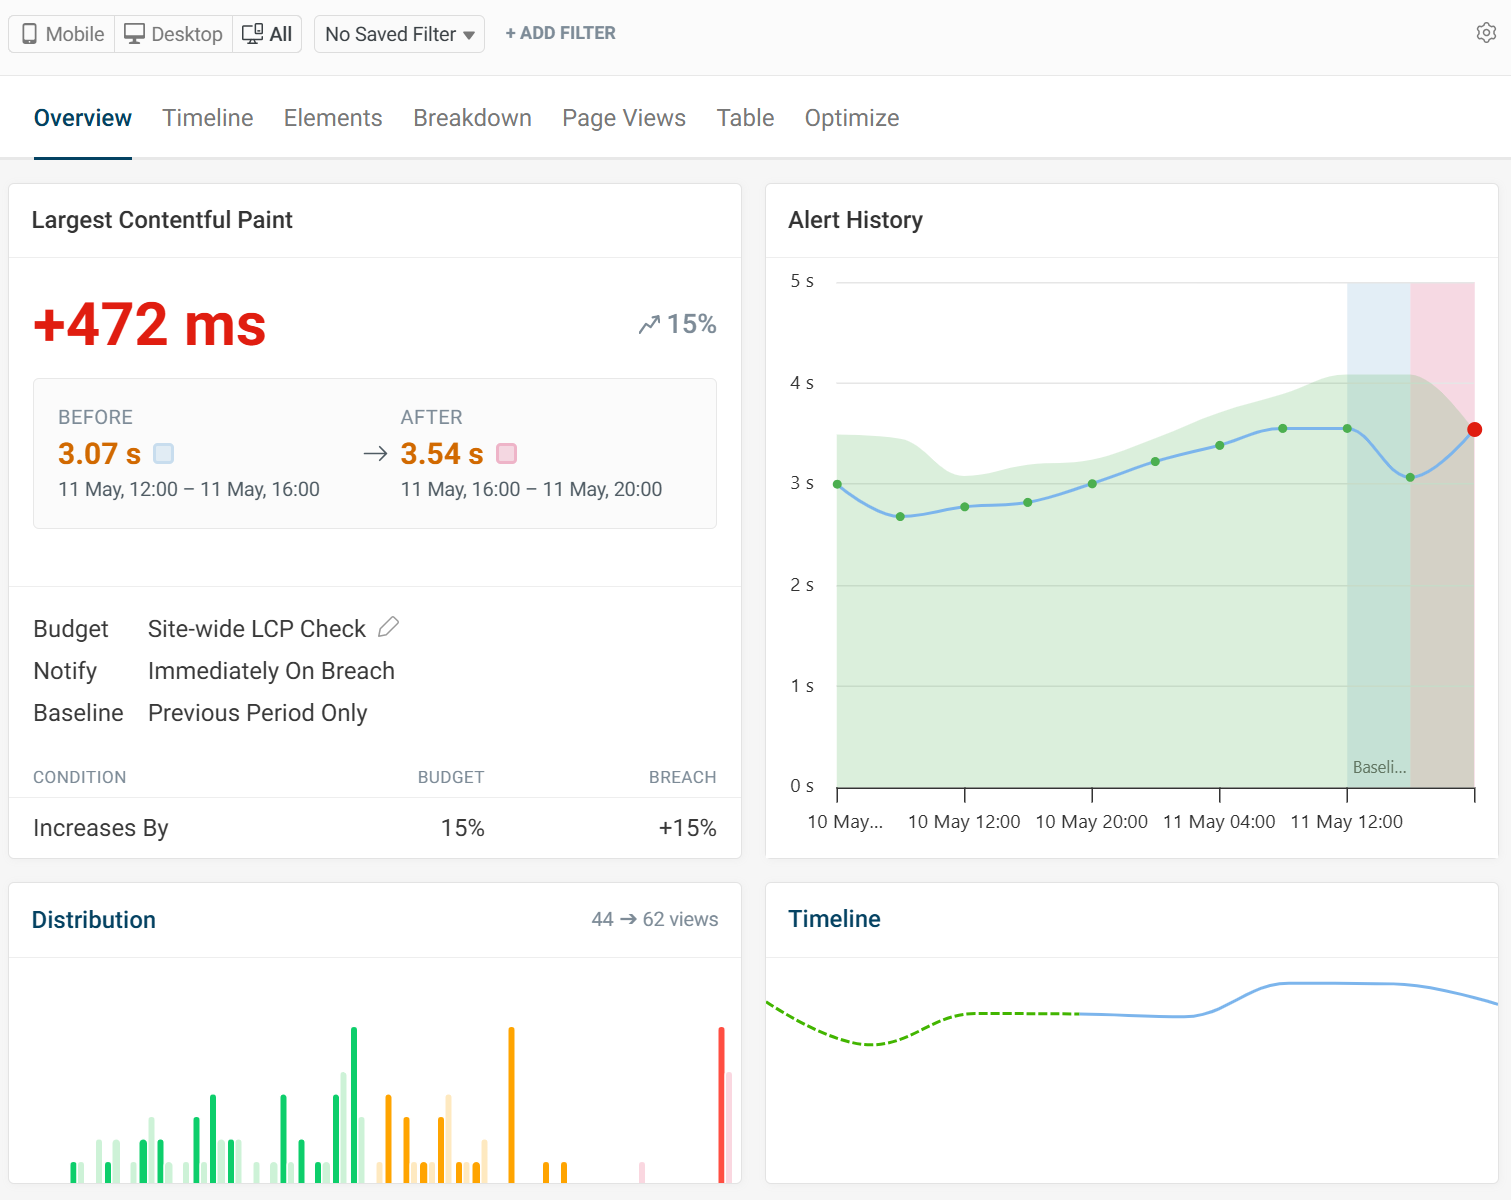
When clicking on the details for either an email or Slack alert, you'll be brought to the RUM alert landing page, where you can view more details on the change, as well as the alert history graph. In this case, we can see the LCP score has been regressing over the last 24 hours.
After a slight improvement in the previous 4-hour period, the regression exceeded 10% and the notification was sent. This timeline gives us context that the LCP score has been creeping up.
From this page, we can inspect further to see what has caused the change, looking at potential causes such as a TTFB increase or inspecting the LCP sub-parts data.
Monitoring best practices
If it is your first time setting up alerts, these principles will help you get the most from performance alerting:
- Start small. Don't overwhelm yourself and your team with budgets. Begin with Core Web Vitals on your high-traffic pages. Then continue with more metrics and pages.
- Set realistic thresholds. Base budgets on your current performance plus a reasonable buffer. Alerts should indicate genuine regressions.
- Combine lab and field data. Using alerts on both lab and RUM data helps catch regressions sooner, minimizing impact on user experience, SEO rankings, and conversions.
- Make alerts actionable. Once an alert has been sent, compare against previous data to see what changed.
- Integrate with your team. Inviting team members to view the budget dashboard, receive email alerts, and join a Slack channel means everyone is on the same page.
- Review and adjust. Audit your budgets over time to reflect your website's current performance and future targets.
Get started with performance monitoring
Performance budgets turn passive observation into proactive protection. Instead of discovering regressions days or weeks later through user complaints or ranking drops, you'll know immediately when metrics drift outside acceptable ranges.
Ready to set up monitoring for your site? Start a free DebugBear trial and configure your first performance budgets in minutes.
Monitor Page Speed & Core Web Vitals
DebugBear monitoring includes:
- In-depth Page Speed Reports
- Automated Recommendations
- Real User Analytics Data