Project Performance Overview
The DebugBear project overview lists the pages that you've monitored, and visualizes site speed metrics and other performance data.
Views
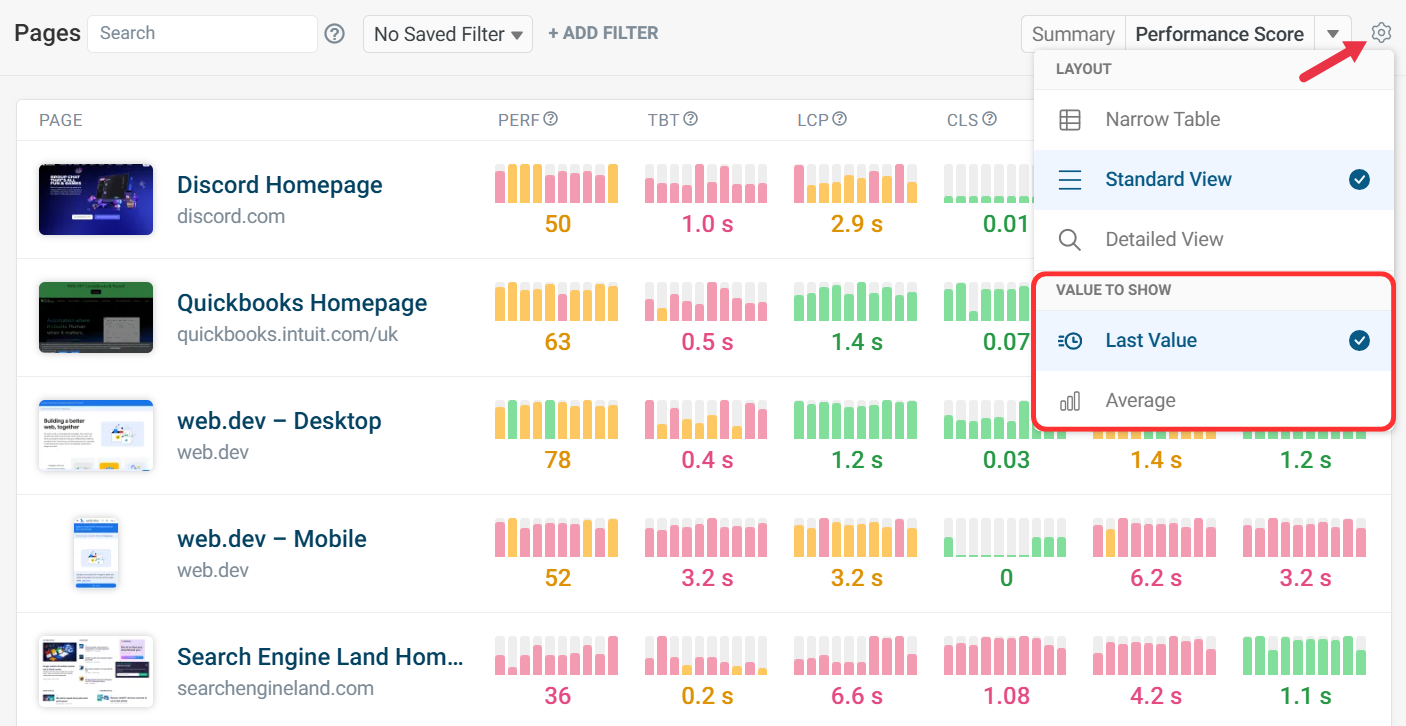
There are three different display modes for the overview. These can be selected with the cog icon in the top right corner of the dashboard.
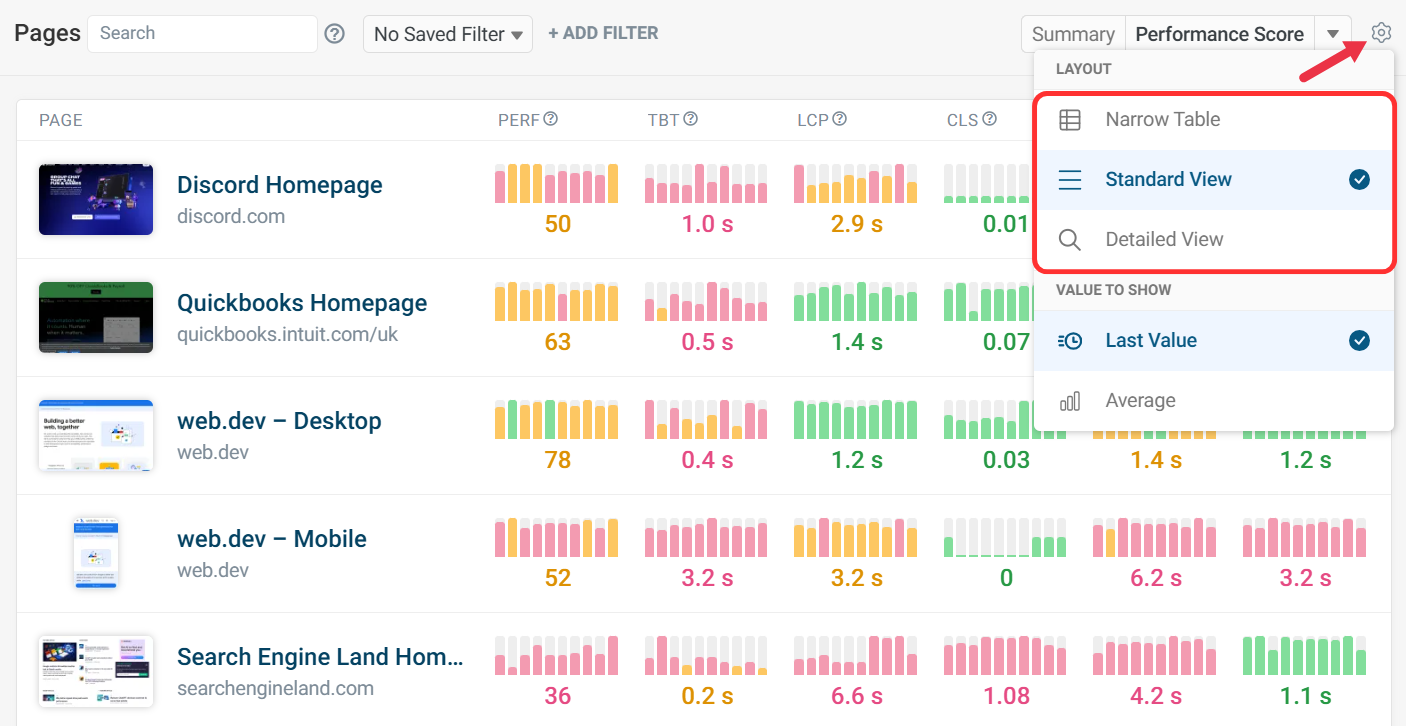
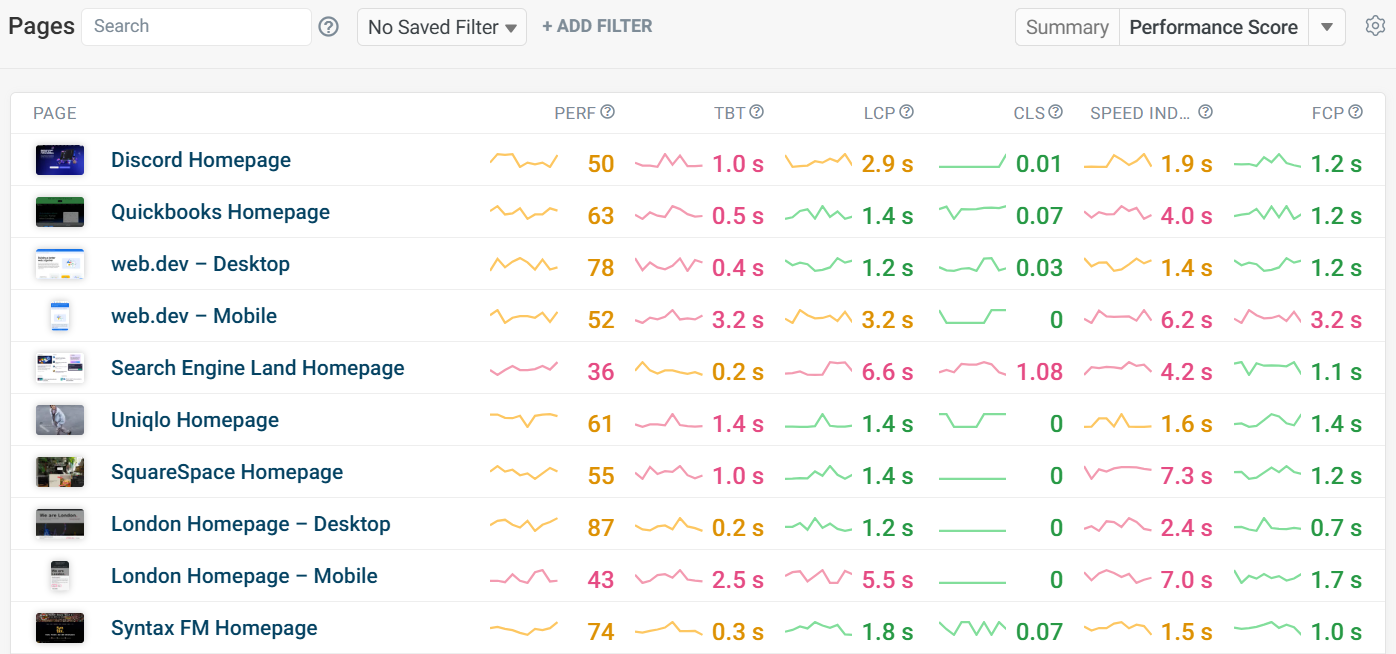
Standard view
By default, the overview shows a trendline with data for the last 10 days. See Date Range Selection below to change the amount of time covered.
The bars show the median value for each period, for example each day. The number below the bar chart shows the most recent test result.
This value can be changed to show the average for the selected period by using the cog icon.
Narrow view
The narrow view shows more pages, with trendline graphs to help spot regressions or improvements.
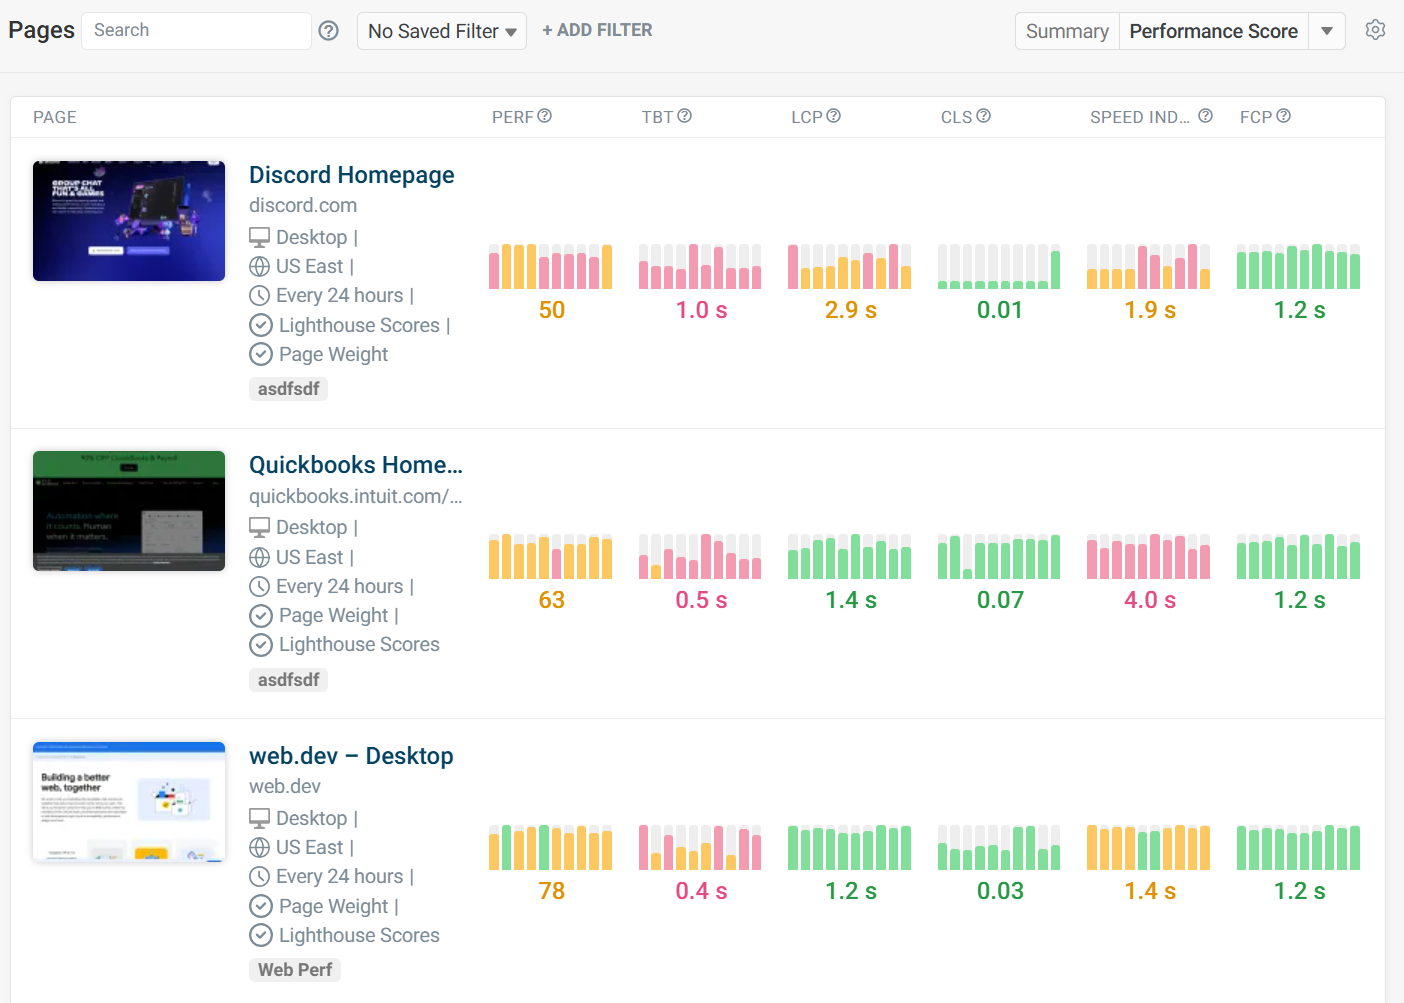
Detailed view
The detailed view shows more information, including location, test configuration, and tags.
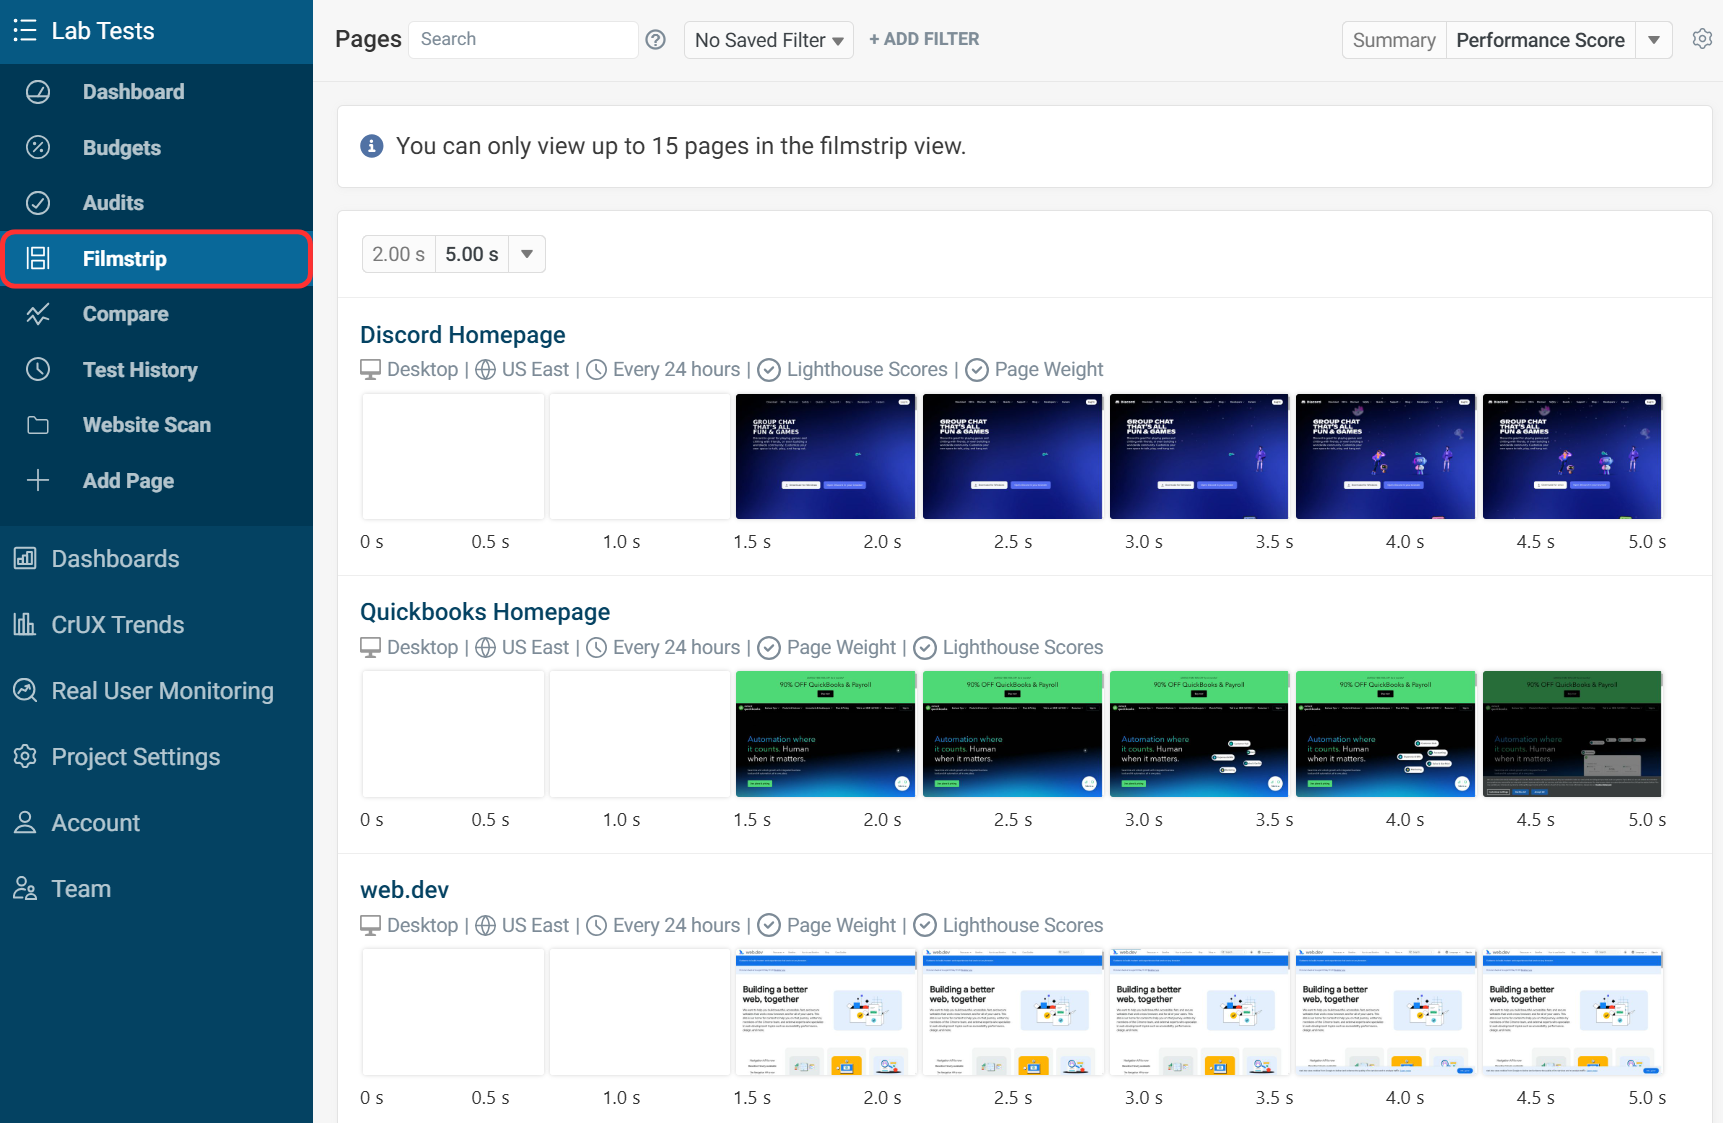
Filmstrip
The filmstrip tab lets you compare the rendering behavior of different pages.
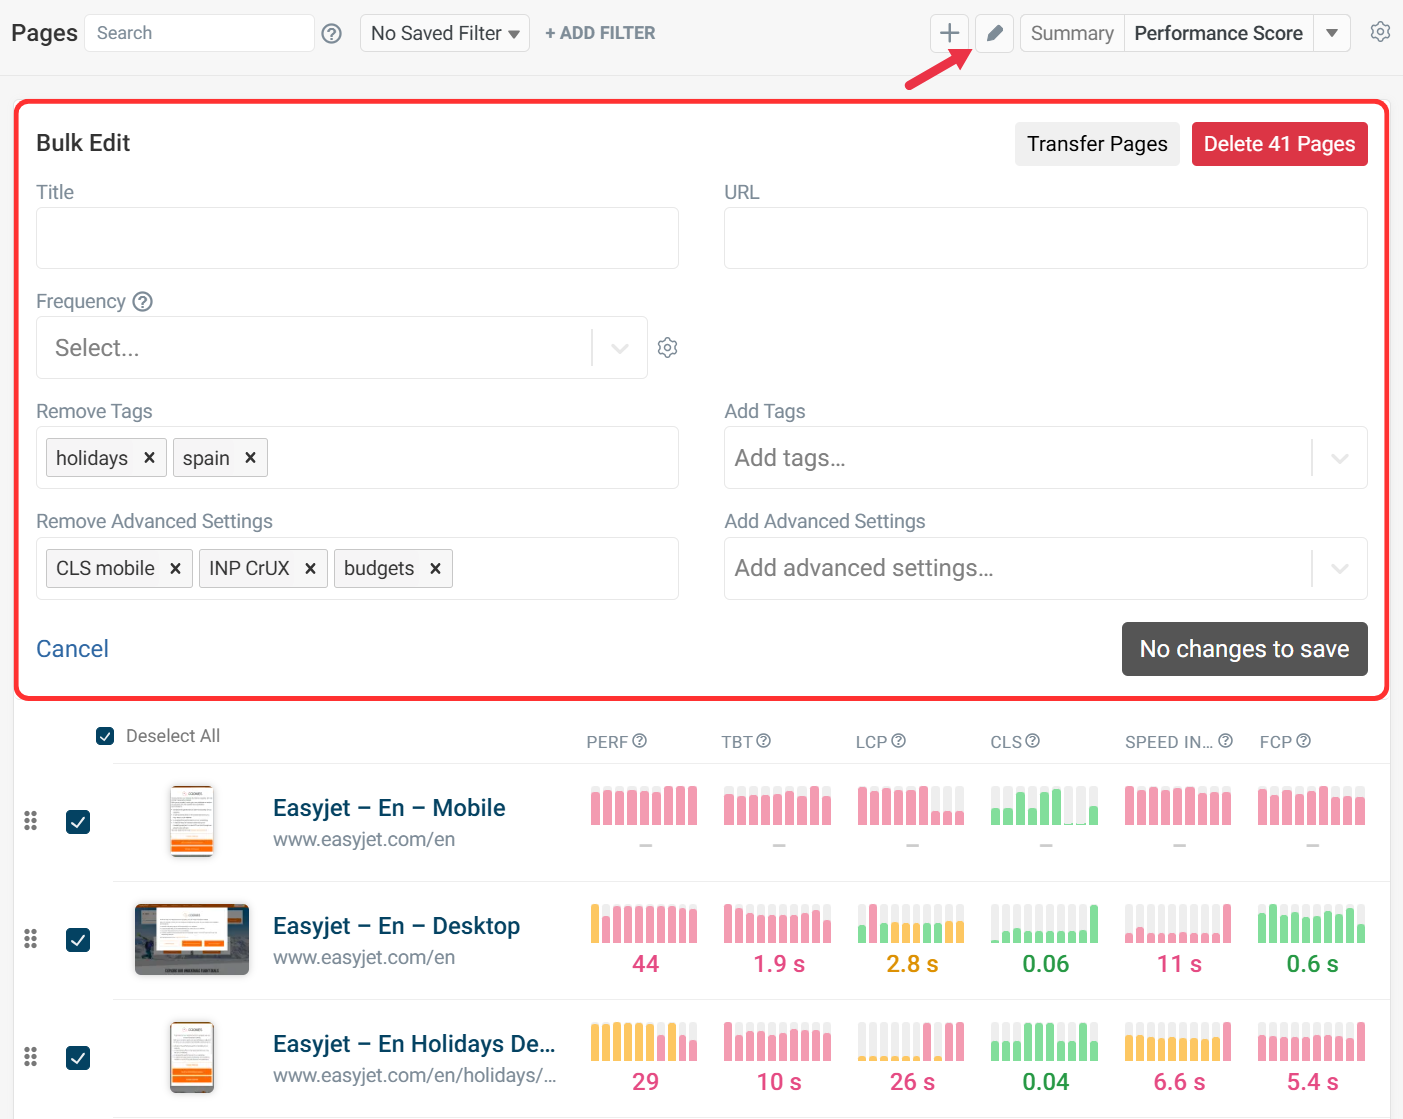
Bulk Edit
The bulk edit view lets you edit multiple pages at once. For example, you can add and remove tags, or change how often tests are run.
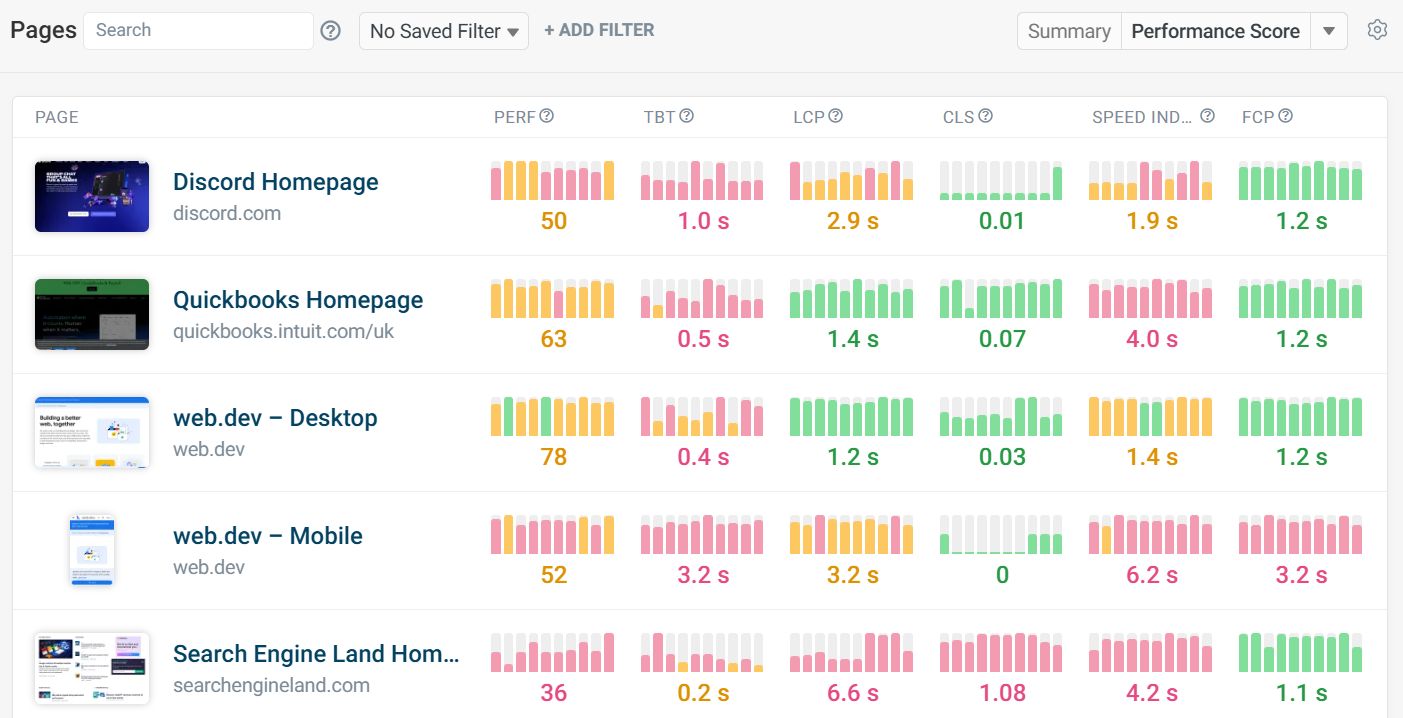
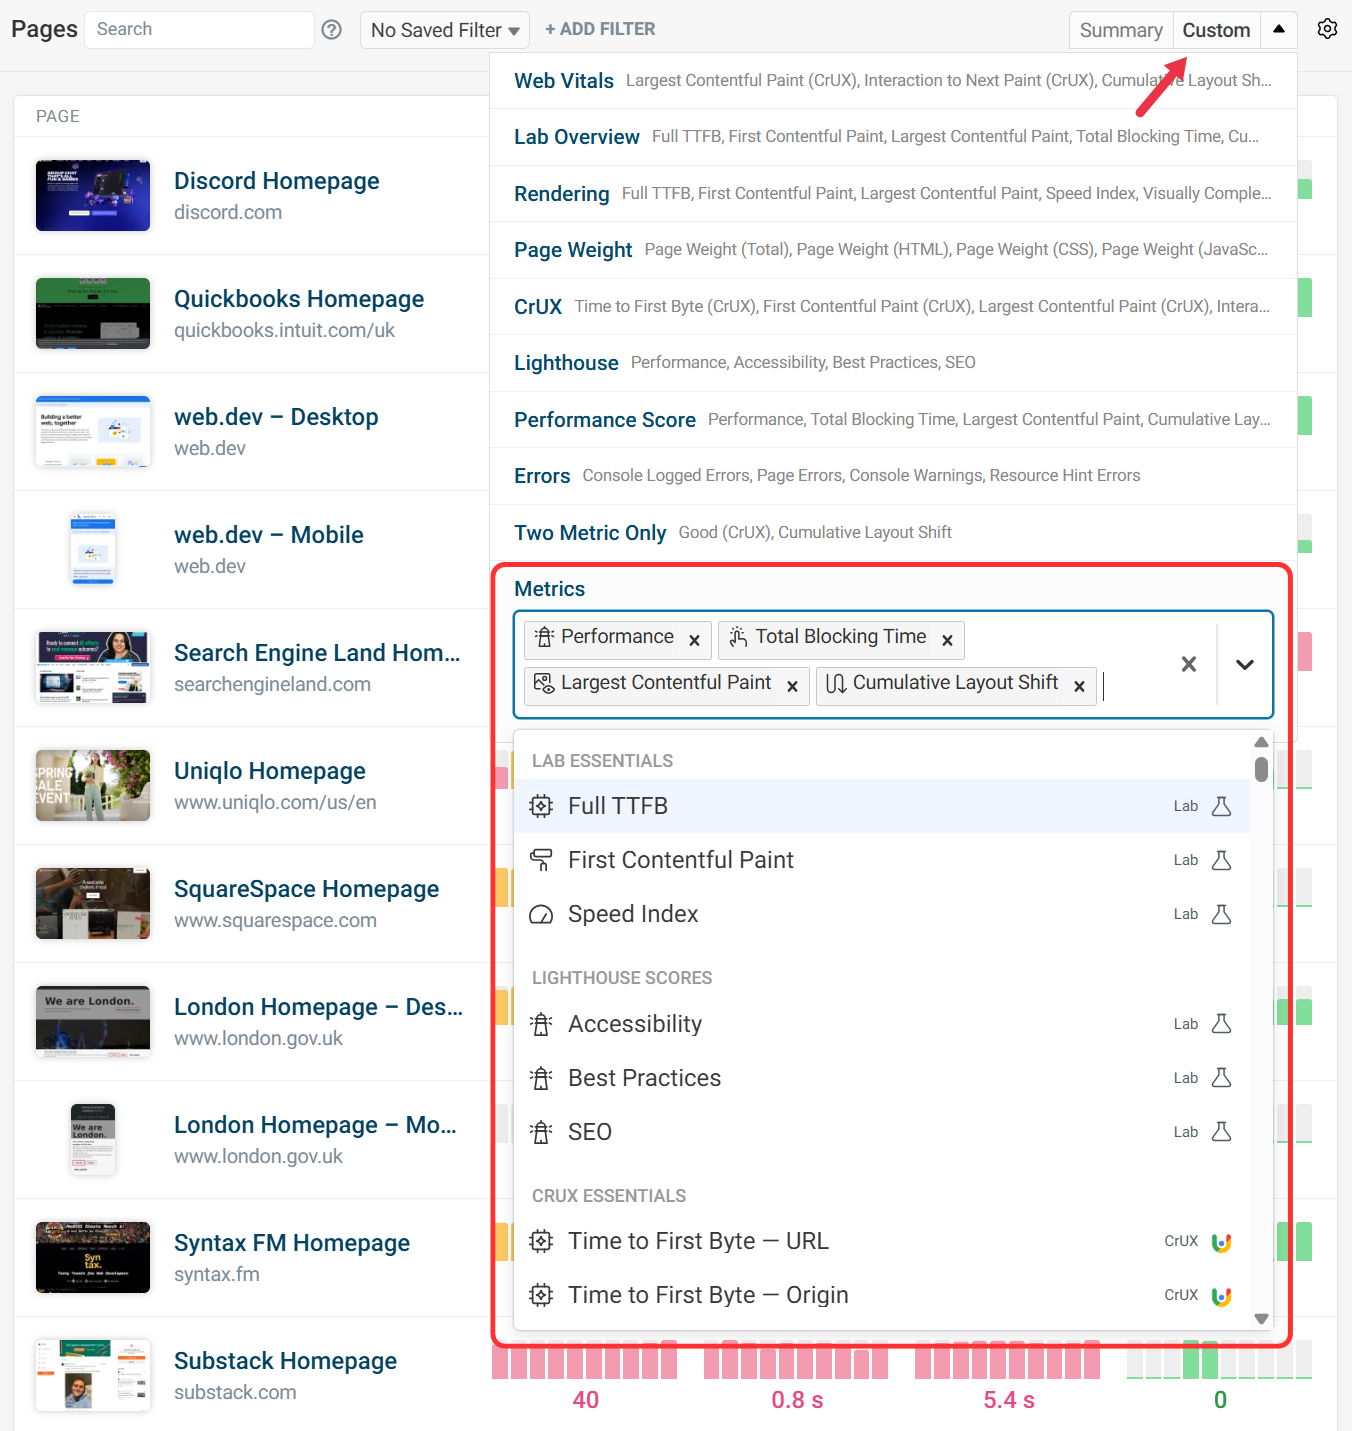
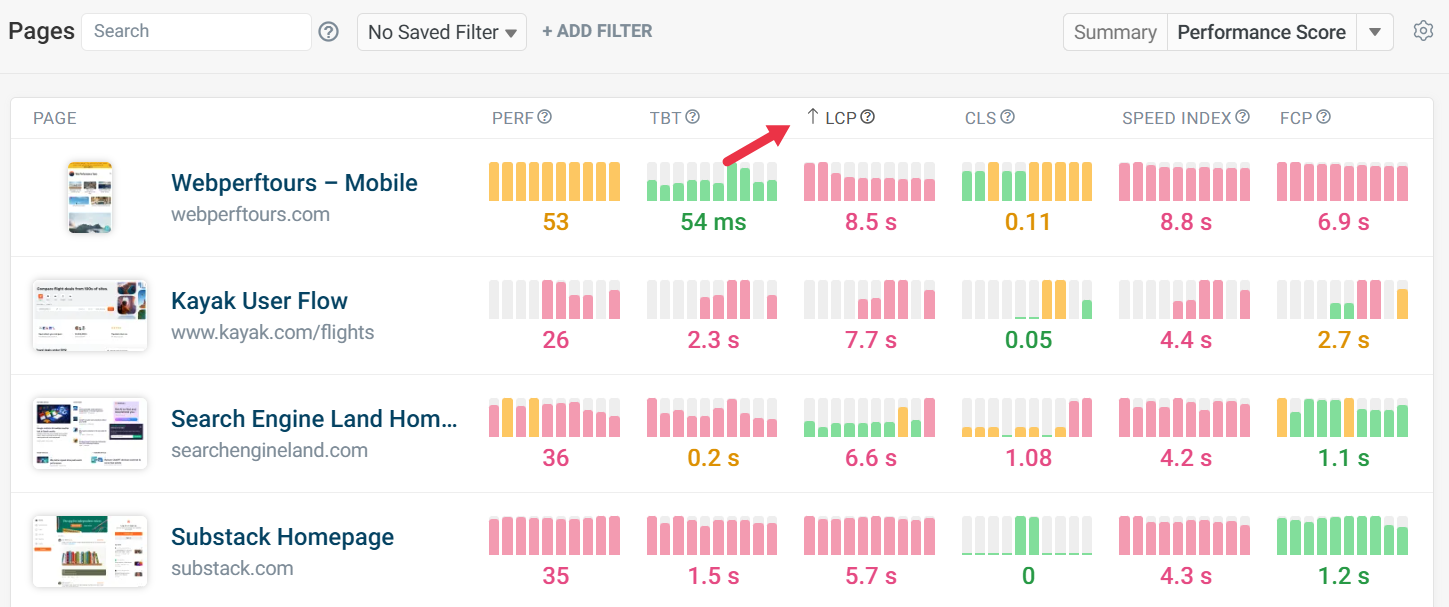
Selecting Performance Metrics
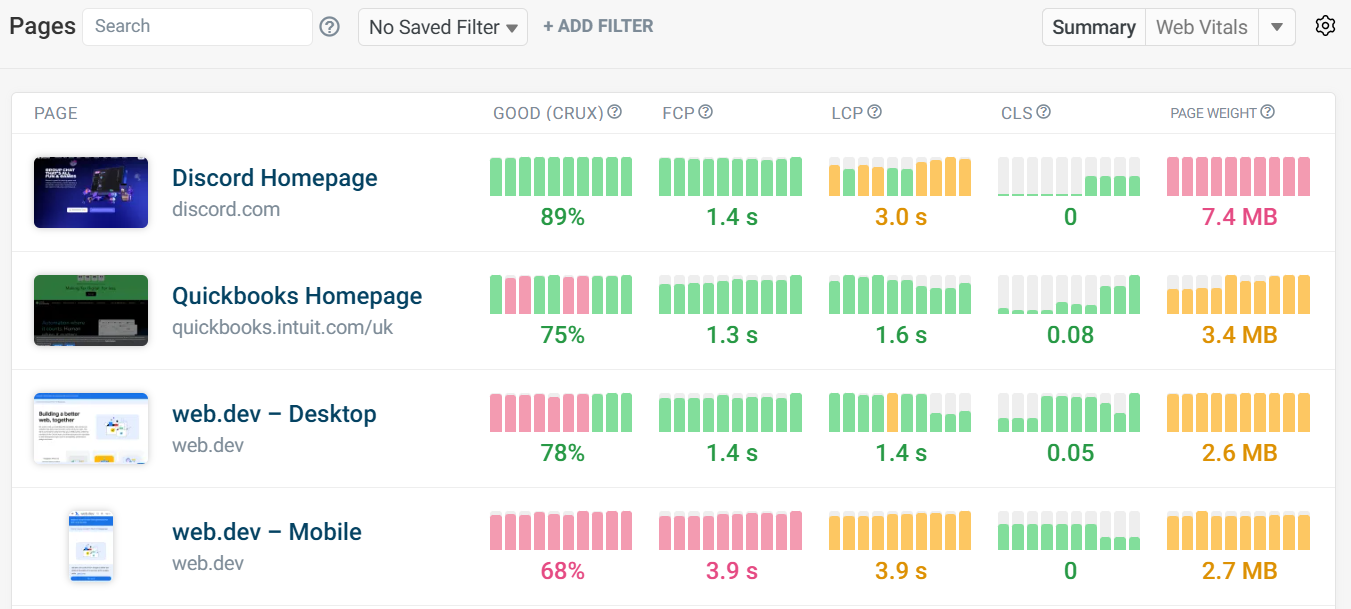
The default view is Summary, which shows the following metrics:
- Good CrUX - The Good CrUX value is the 75th percentile of the lowest-scoring Core Web Vital.
- First Contentful Paint - Time it takes for the first piece of visible content to render.
- Largest Contentful Paint - Time it takes for the largest element to render.
- Cumulative Layout Shift - How visually stable elements are during the page load.
- Page Weight - Total size of all resources (HTML, CSS, JS, etc.) loaded for a page.
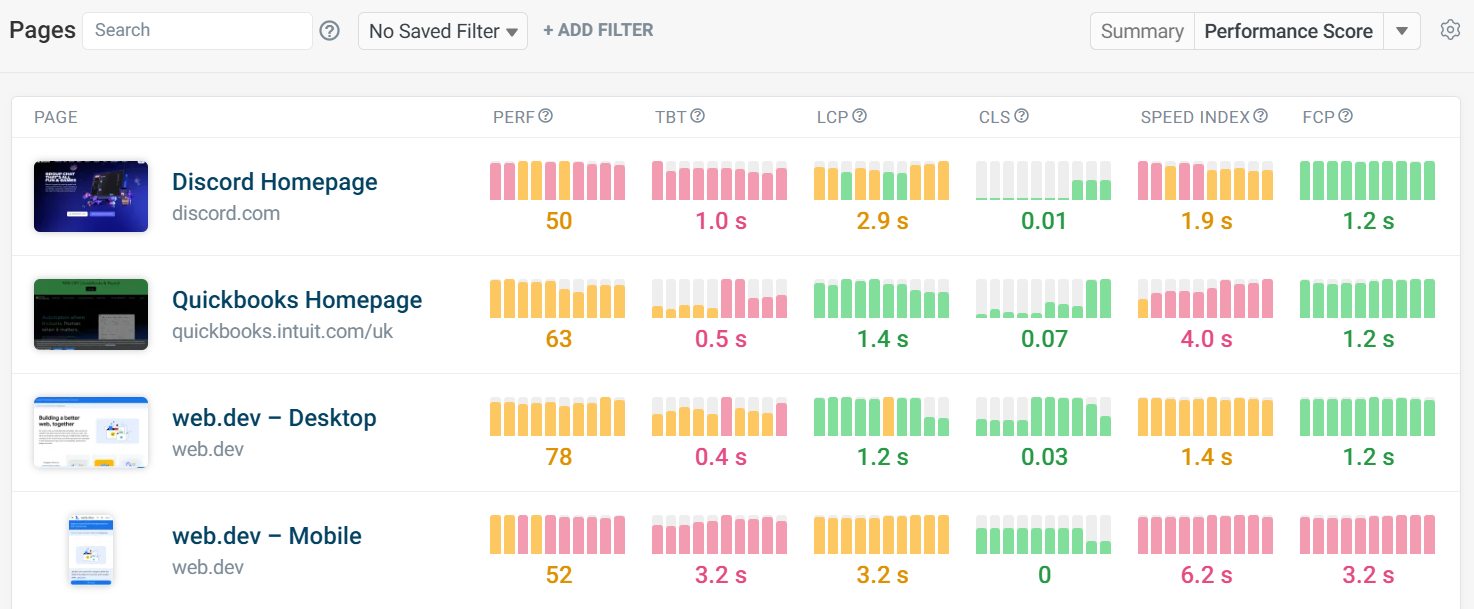
The Performance Score view includes Total Blocking Time (TBT) and Google Lighthouse's performance score.
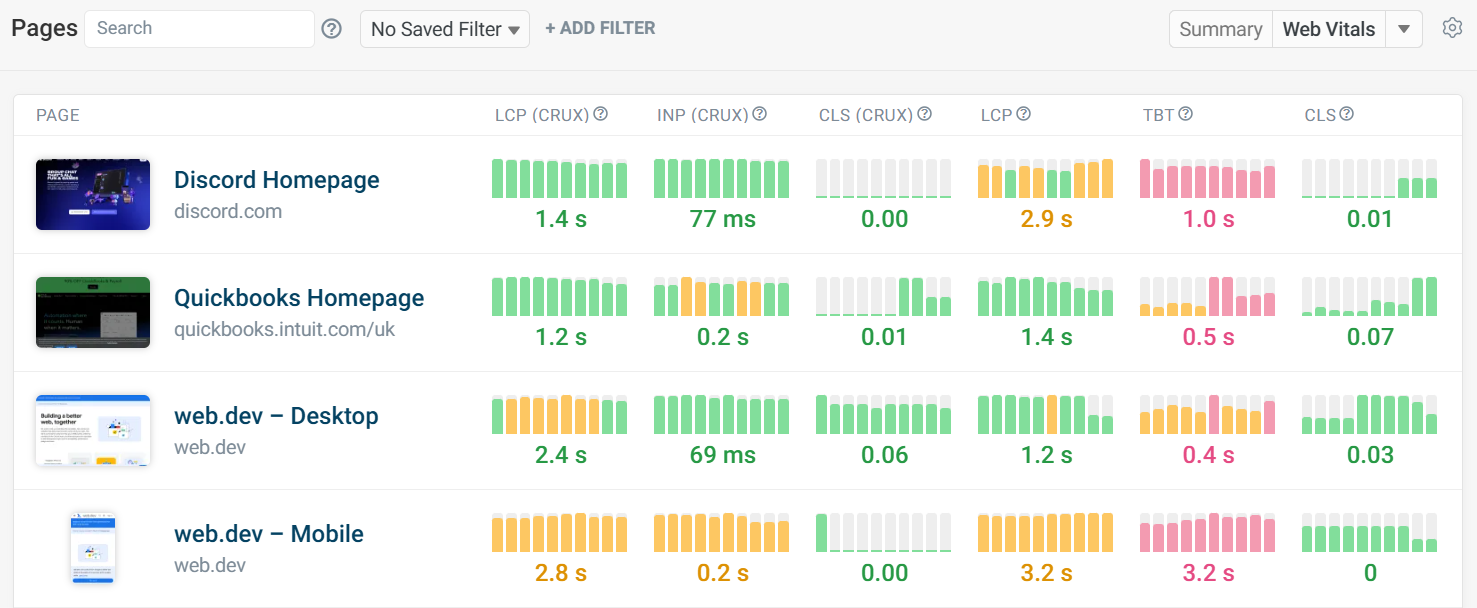
The Web Vitals view shows both data from Google's Chrome User Experience Report (CrUX) and lab data collected by DebugBear.
Note that CrUX values reported by Google are always aggregated over a 28-day rolling window.
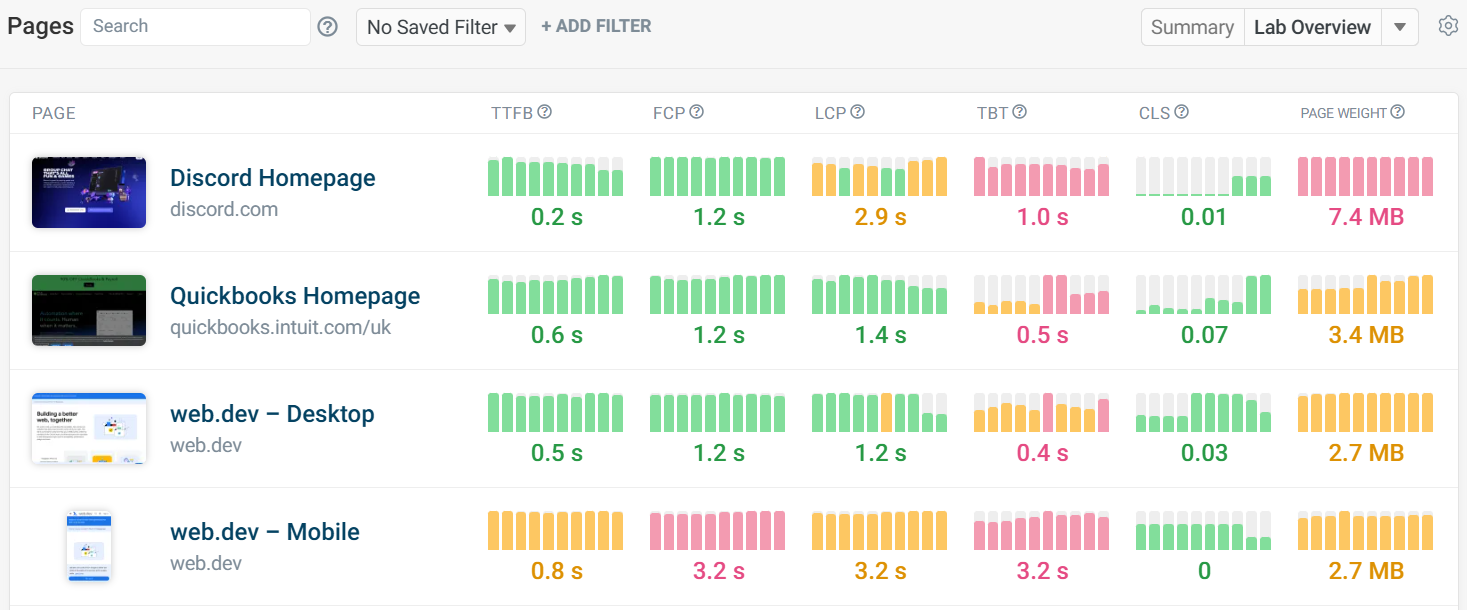
The Lab Overview shows the 6 main metrics from the lab test.
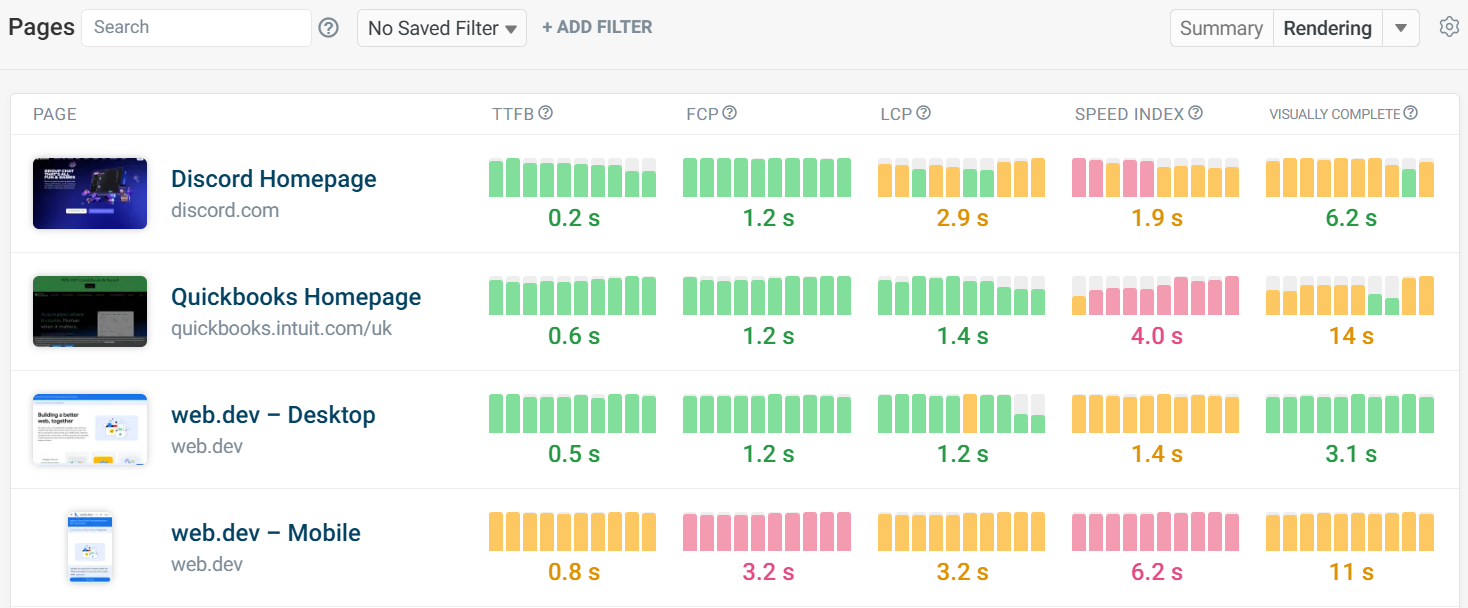
The Rendering view shows all metrics related to page load speed, including Speed Index and Visually Complete.
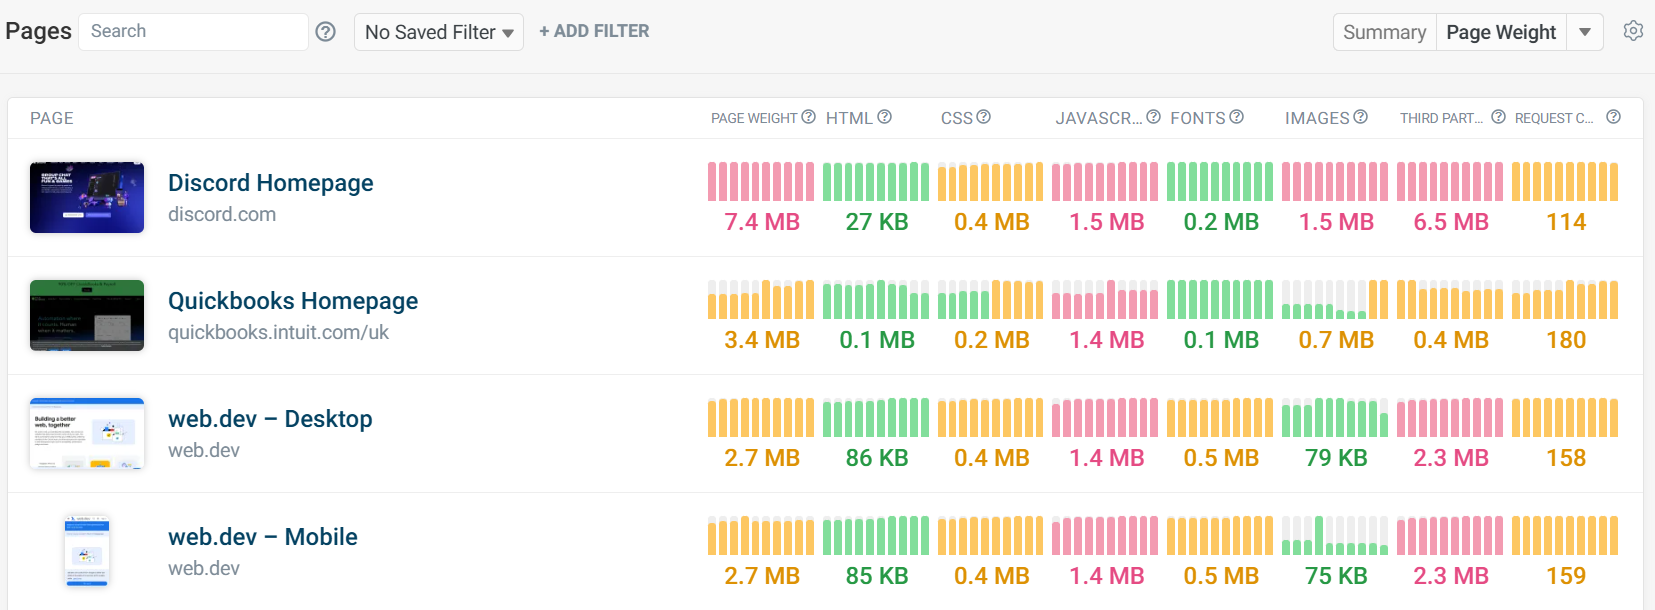
The Page Weight view provides a breakdown of the heaviest categories of a page, including JavaScript, fonts, and images.
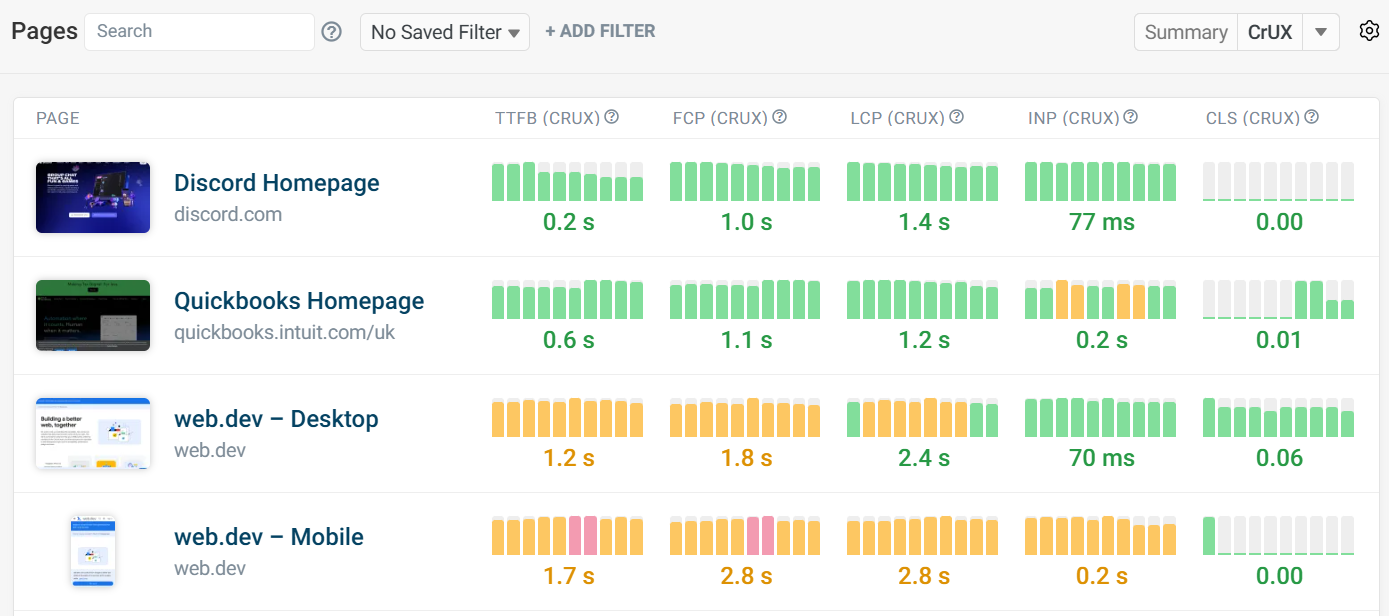
The CrUX view shows the most recent CrUX data for the page.
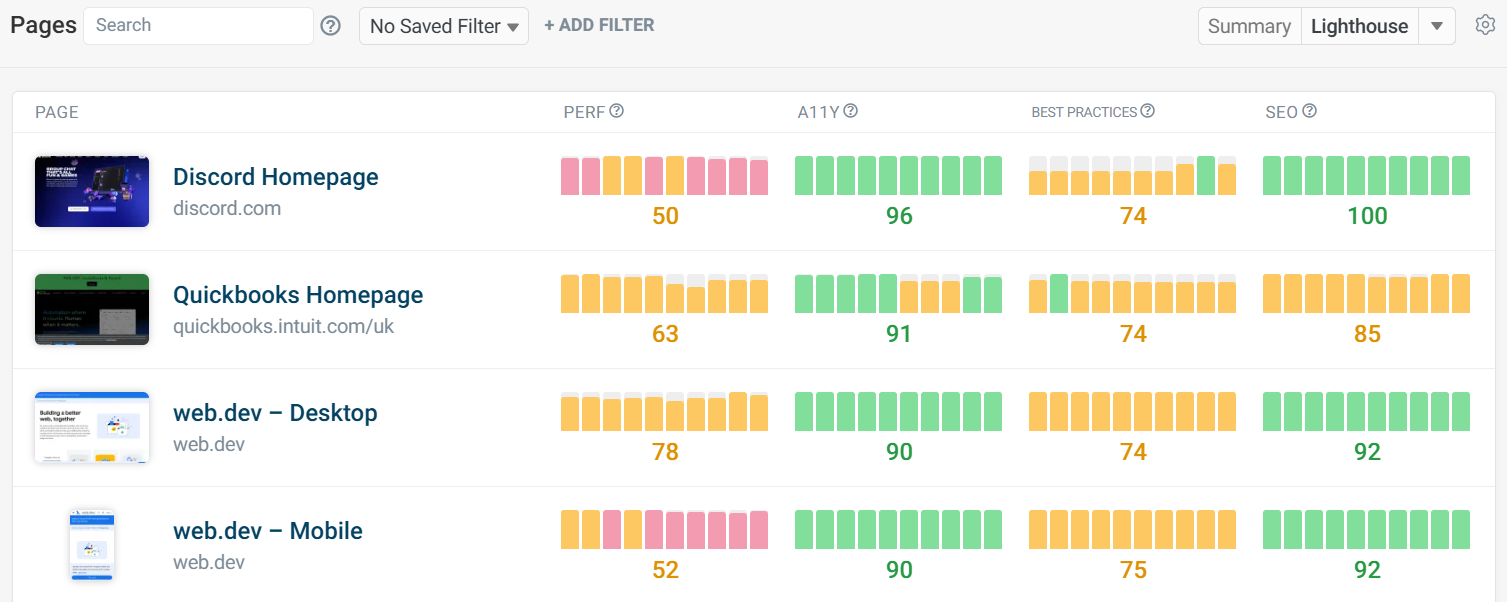
The Lighthouse view shows Lighthouse scores for Performance, Accessibility, Best Practices, and SEO.
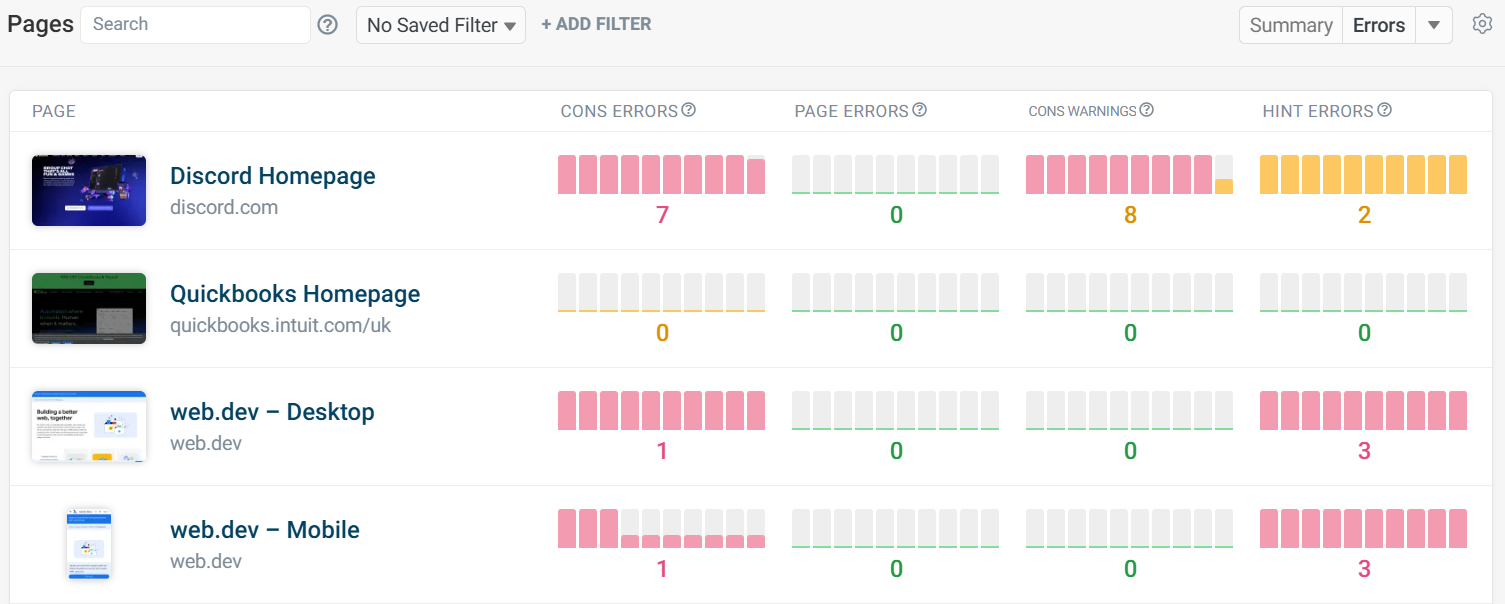
The Errors view shows metrics like the number of console errors and invalid resource hints.
Metrics can be added or removed at the bottom of the metrics view. The dropdown contains additional metrics, including User Timings. These can be saved for future use by creating a new metric group.
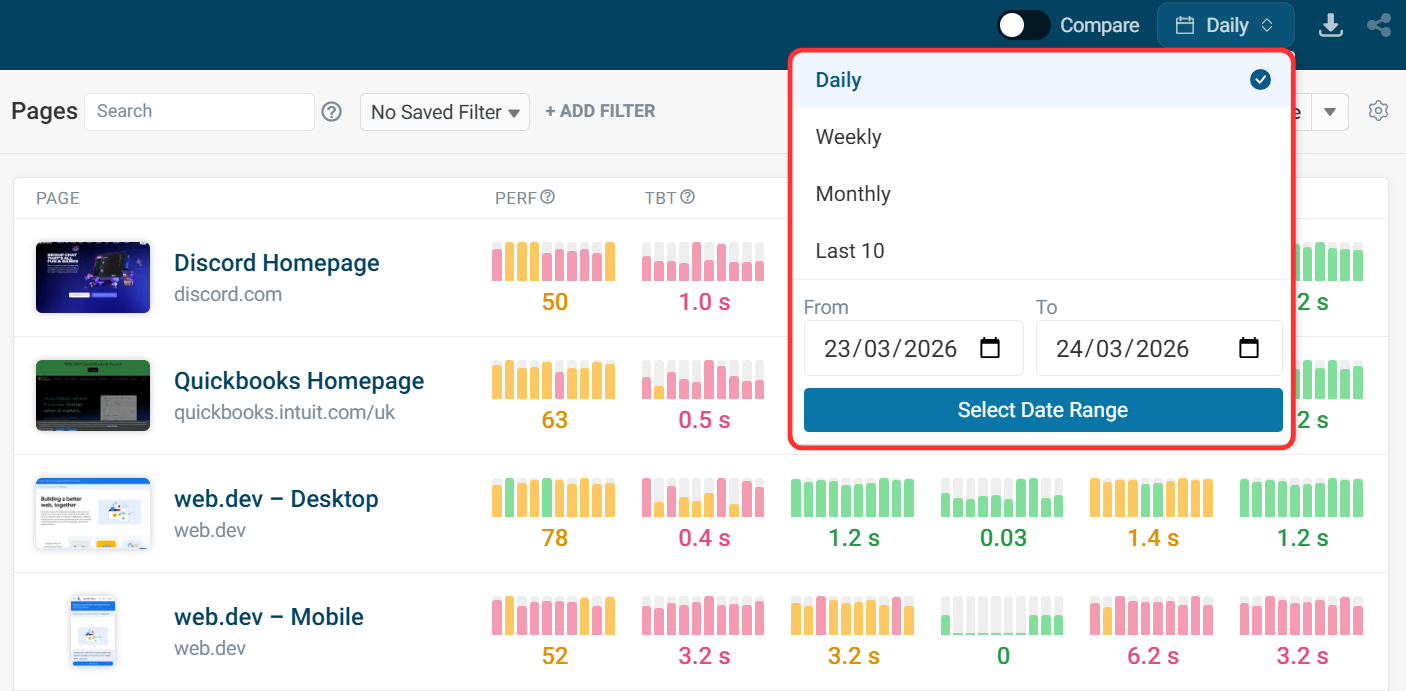
Date Range Selection
For the overview trendlines, you can select from the following options:
- Daily: show median daily data for the last 10 days
- Weekly: show median weekly data for the last 10 weeks
- Monthly: show median monthly data for the last 10 months
- Last 10: show data for the last 10 test results
- Custom date range: show data for a custom range
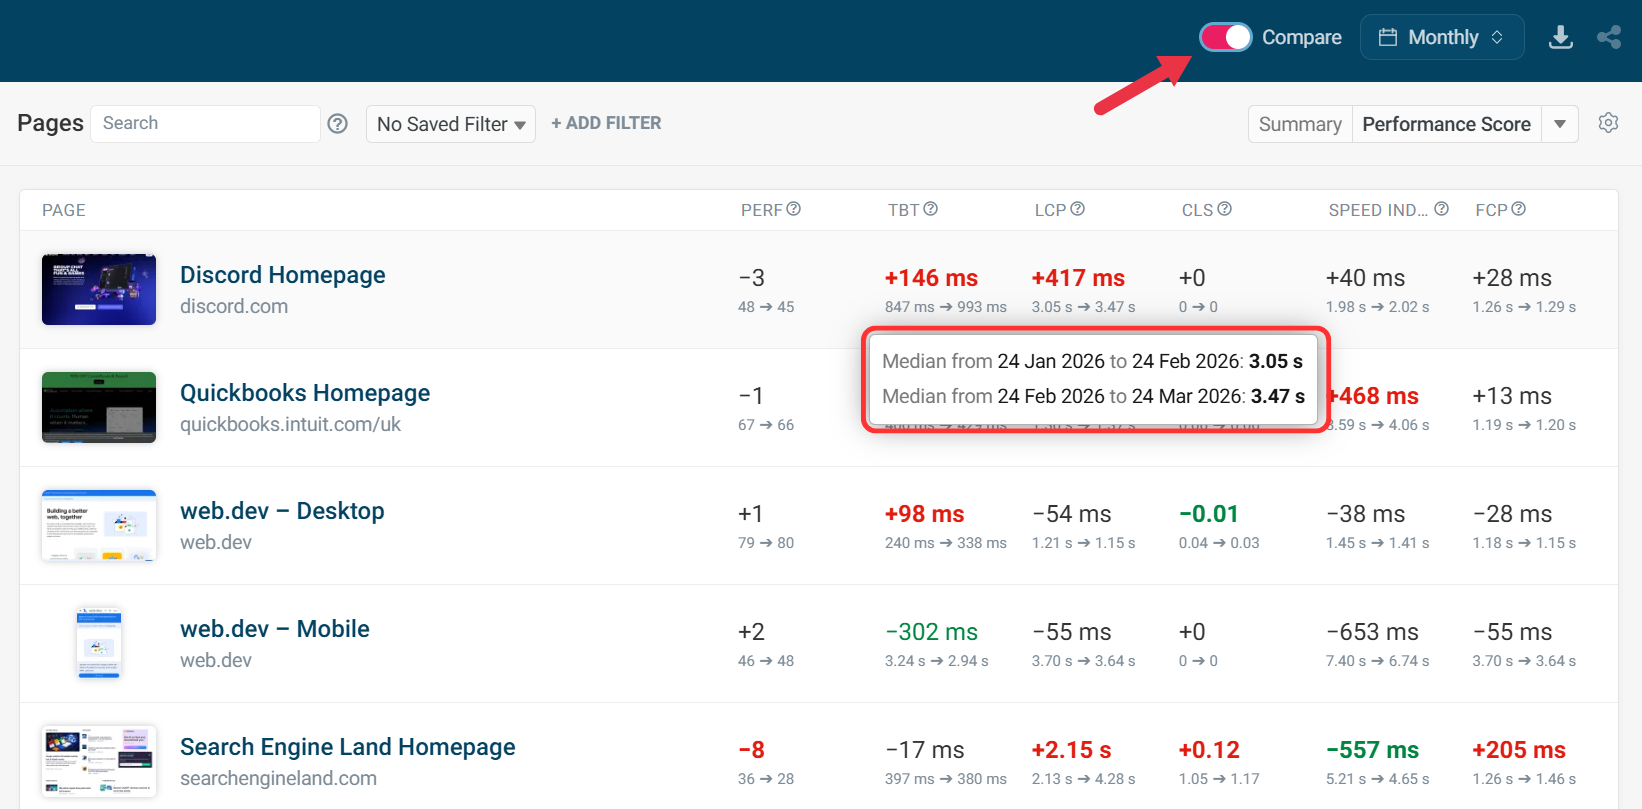
Compare Date Ranges
Comparing date ranges shows the median metric value between two periods.
Filters
Clicking Add Filter lets you quickly find all pages with a certain tag, domain, URL, or device.
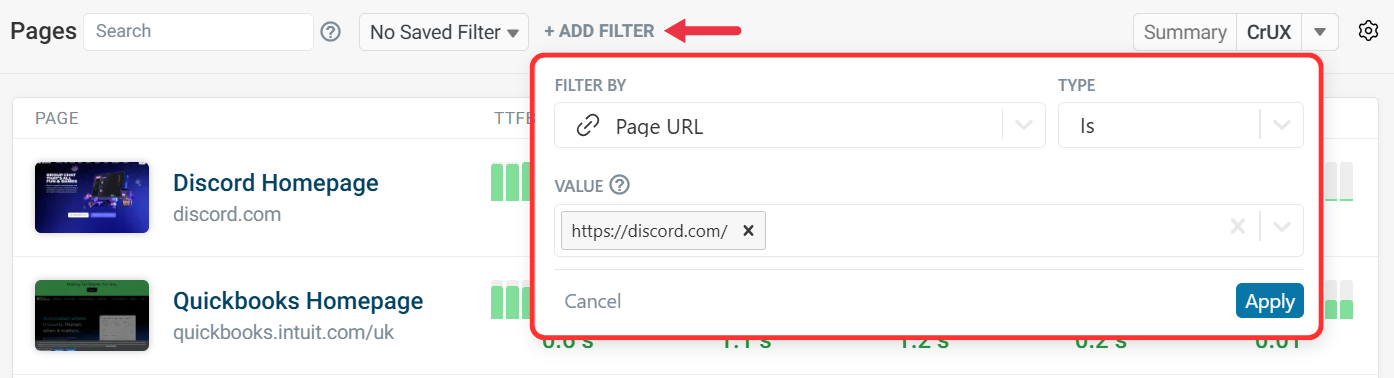
These settings can be used as Saved Filters for future use.
Search
The text search lets you filter based on a range of page properties, including:
- Page Name
- Page URL
- Device Name
- Page Tags
- Page Test Location
Use brackets to search for tags specifically, for example [my-tag].
Search Operators
The search input supports NOT and OR operators.
!discordwill match all pages that don't matchdiscorddiscord or squarespacewill match pages that match eitherdiscordorsquarespace
Sorting
Click on the metric column headers to identify your slowest pages.
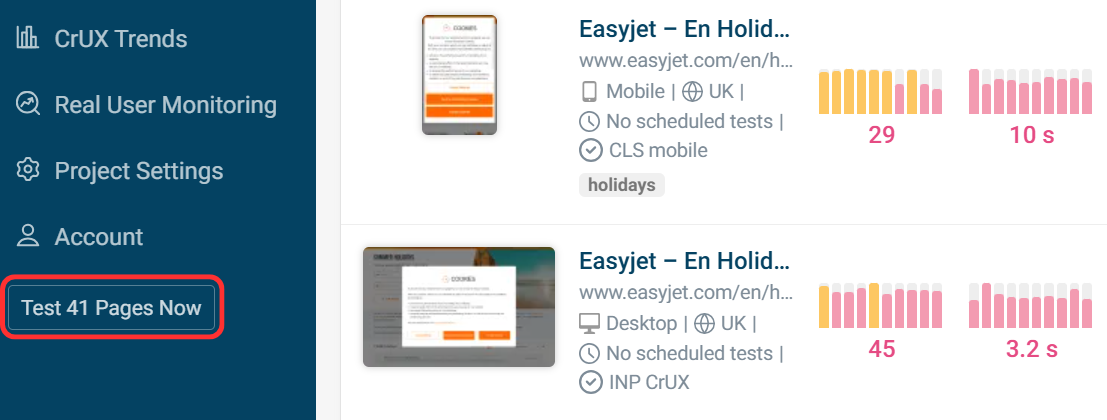
Triggering tests
You can trigger page tests on demand, for example, after a recent website deployment. Click the Test N pages now button in the sidebar.
After tests are complete, any normal alerts will be sent, for example, via email or Slack.