Site builders let you create your own website without writing any code, but the websites they generate aren't always fast. Slow page load times not only affect the experience of your visitors, but can also hurt SEO.
I built a similar website using 14 different website builders and tested their site speed. This post first presents the overall results and then looks at each website maker in detail.
- Site builder performance results
- Rendering performance
- A look at the performance of each site builder
- Takeaways for site builder developers
- More metrics
Site builder performance results
The table below shows the test results for each website builder. It's sorted by the site's Lighthouse score, which gives an overall assessment of the performance of a web page. (This is also the score you would get from PageSpeed Insights.)
The Performance score isn't always the best metric to evaluate website performance. You can click on the column headings in the table to sort the different site builders by a different metric.
While Versoly has the highest Lighthouse score on mobile, Wix has the highest score on a desktop device. Strikingly renders initial content the fastest, but it takes a long time for the page to become interactive.
| Site Builder | ▾ Score | FCP | SI | LCP | TTI | CPU | Size |
|---|---|---|---|---|---|---|---|
| Versoly | 80 | 2.11 s | 3.43 s | 4.37 s | 4.38 s | 672 ms | 453 KB |
| Webflow | 77 | 1.74 s | 3.13 s | 4.95 s | 4.96 s | 1.35 s | 671 KB |
| Wix | 72 | 1.67 s | 2.67 s | 5.24 s | 6.69 s | 3.26 s | 759 KB |
| Site123 | 67 | 2.61 s | 3.21 s | 3.40 s | 5.57 s | 2.30 s | 558 KB |
| GoDaddy | 63 | 2.30 s | 3.02 s | 3.93 s | 7.02 s | 3.77 s | 783 KB |
| Jimdo | 58 | 3.62 s | 5.54 s | 5.70 s | 4.34 s | 1.35 s | 517 KB |
| Yola | 54 | 2.08 s | 4.60 s | 4.62 s | 3.65 s | 3.22 s | 615 KB |
| Webnode | 48 | 3.75 s | 4.92 s | 9.05 s | 6.26 s | 2.21 s | 855 KB |
| Weebly | 39 | 3.40 s | 6.74 s | 7.33 s | 7.40 s | 3.74 s | 996 KB |
| Wordpress.com | 34 | 2.65 s | 4.88 s | 5.54 s | 15.9 s | 9.46 s | 878 KB |
| Strikingly | 32 | 1.12 s | 4.01 s | 22.5 s | 28.7 s | 10.6 s | 2.32 MB |
| SquareSpace | 31 | 2.09 s | 8.29 s | 8.79 s | 6.97 s | 3.56 s | 994 KB |
| Weblium | 23 | 3.68 s | 6.44 s | 6.93 s | 19.0 s | 3.67 s | 1.14 MB |
| UCraft | 18 | 2.67 s | 10.6 s | 15.6 s | 22.7 s | 10.4 s | 3.29 MB |
Performance metrics
Lighthouse Performance Score
This is an overall assessment of the website's performance, combining 6 different metrics into a score ranging from 0 to 100.
First Contentful Paint, Speed Index (SI), and Largest Contentful Paint (LCP)
The First Contentful Paint measures when the user first starts seeing page content, such as text or an image.
Speed Index visually measures how quickly the page content reaches its final state.
The Largest Contentful Paint measures when the largest element on the page was rendered. Unlike Speed Index, the LCP will increase even if the newly painted element is similar to the previous element content.
TTI (Time to Interactive)
Time to Interactive measures how quickly the page becomes idle, meaning there isn't much ongoing network or CPU activity. This usually means that any interactive elements on the page are ready to be used by the visitor.
CPU Processing Time
This measures how much time the browser spends on things like running JavaScript code or rendering page content.
Page Size
This measures the overall (compressed) download weight of the page.
Rendering performance
Minimizing the time it takes for page content to appear after navigating to a page is one of the most important aspects of site performance.
The image shows a side by side view of the rendering timelines of all tested website builders.
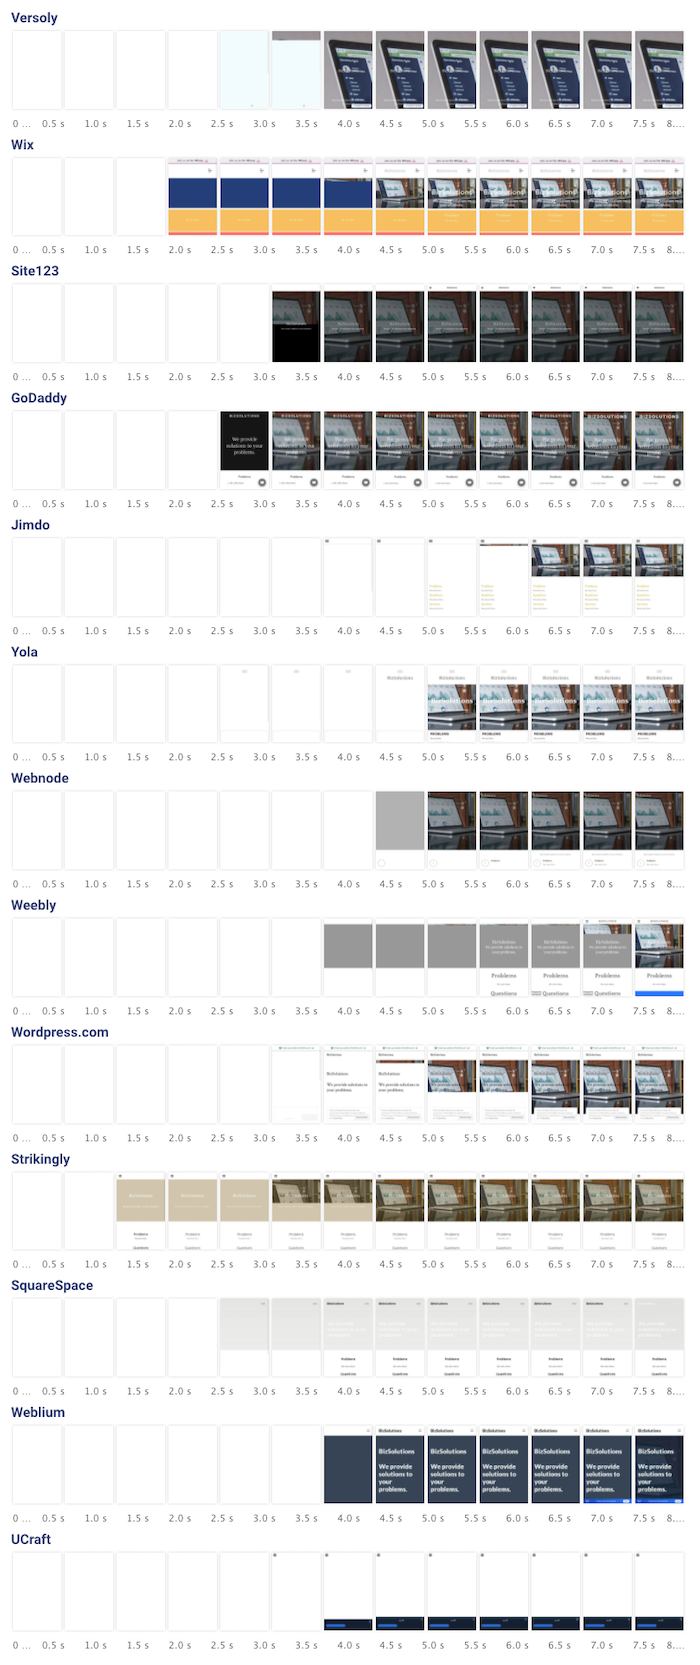
(I added Webflow later, so it's not included in this image.)
A look at the performance of each site builder
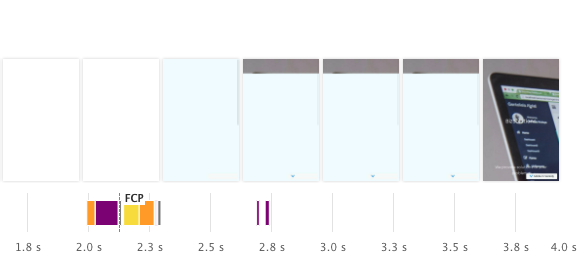
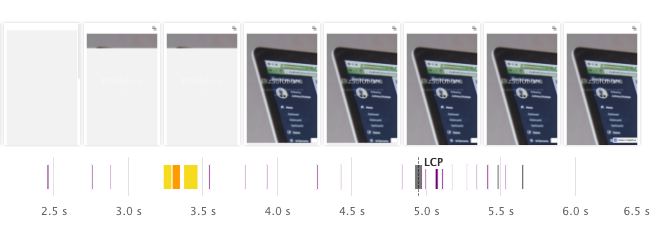
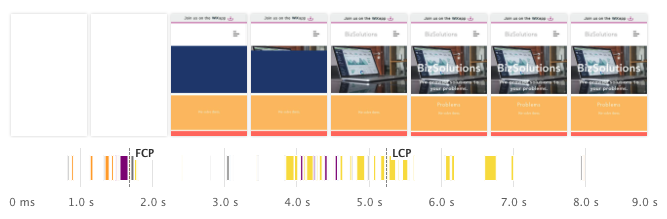
Versoly
Versoly takes a while to render the image, but doesn't run any additional JavaScript processing once the page has loaded.
A different default background color for the image would make it easier to read the text early on.
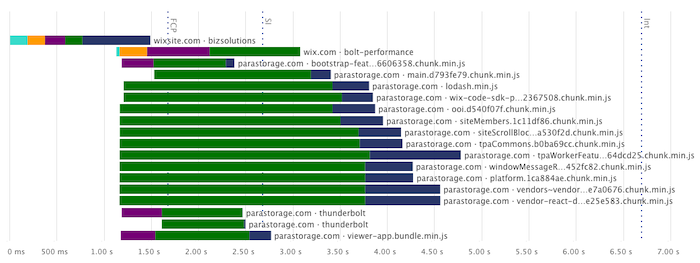
There are two render-blocking CSS files, both on different domains. That means the existing server connection can't be re-used. The background image does not start loading until the render-blocking CSS has been finished loading.
This request waterfall shows the server connections being made and list the network requests.
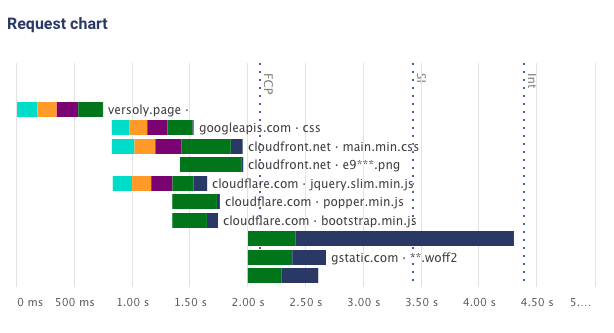
Versoly only makes 10 requests overall, which is the lowest request count among all tested site builders.
Webflow
Webflow also starts to render quite quickly, but then takes a while to start downloading the image.
With a size of just 2KB, the initial page HTML loads very quickly. However, there are two render-blocking CSS and JavaScript requests, both on different domains that require a new server connection.
The hero background image is defined in the render-blocking CSS file, and therefore doesn't start to load until after the CSS file.
At 355KB the background image is also fairly large and takes a while to download. It could be worth first serving a low-resolution version of the image before starting the full download.

Wix
Wix quickly renders the general page layout and then loads the image. It looks like the text doesn't show up until a web font is loaded, however this doesn't seem to be the case when testing with a newer version of Chrome.
Compared to Versoly, the Wix site is a lot chunkier with 66 network requests and 2s of JavaScript execution time.
Wix does not have any render-blocking resources apart from the root document, but downloading the 102KB HTML document can take half a second on a slow connection.
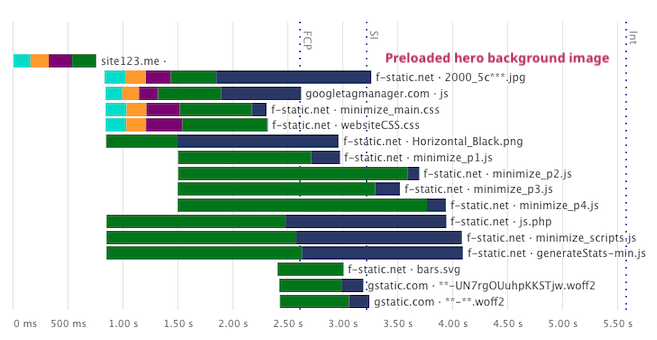
Site123
The Site123 page loads fairly quickly, loading two render-blocking CSS files in addition to the document. Once the site has rendered there isn't much additional work that's done by the CPU.
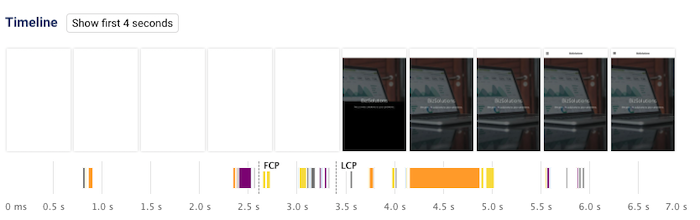
The background image starts loading immediately after the HTML response has arrived, thanks to a rel="preload" tag.
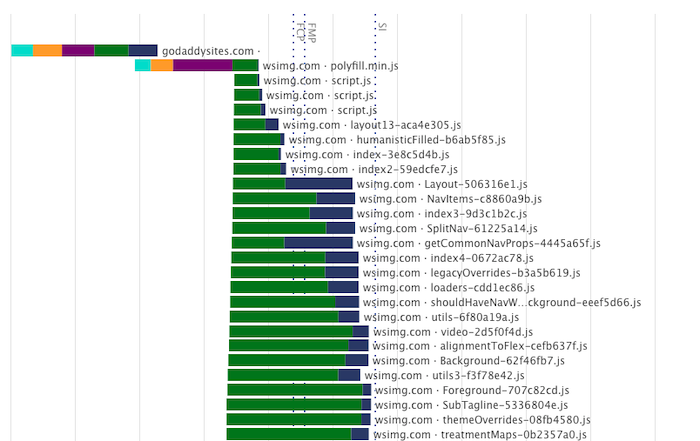
GoDaddy
The GoDaddy site contains several render-blocking scripts and stylesheets. The background image loads quickly, as GoDaddy first serves a 1.3KB low-resolution image before serving the higher-resolution version.
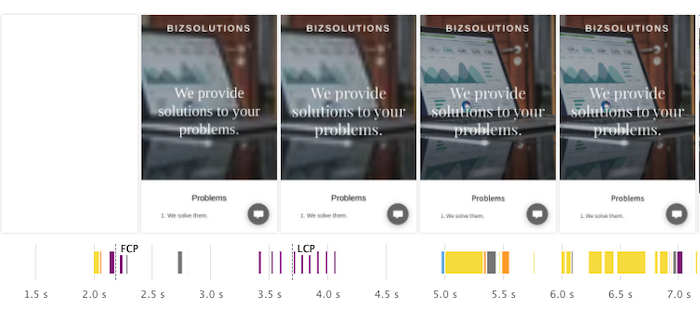
In total, GoDaddy makes 148 network requests when loading the page. Part of this consists of initializing a service worker, so that the site is available offline after the initial load.
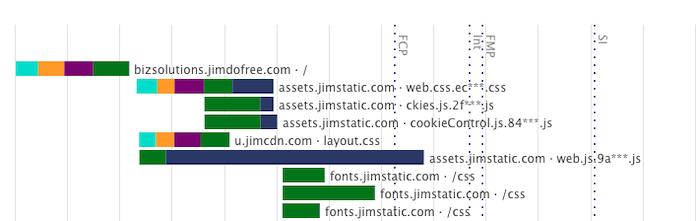
Jimdo
The initial render for the Jimdo site is quite slow, and it takes over 6s for the image to show up.
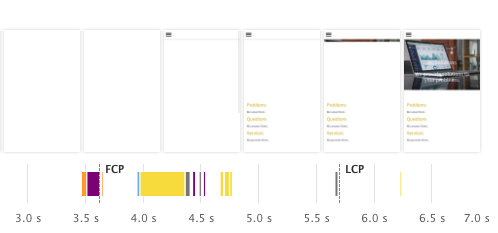
The cause of this is a chain of render-blocking CSS requests. First, Jimdo loads layout.css, which in turn contains an @import statement fetching a font definition.
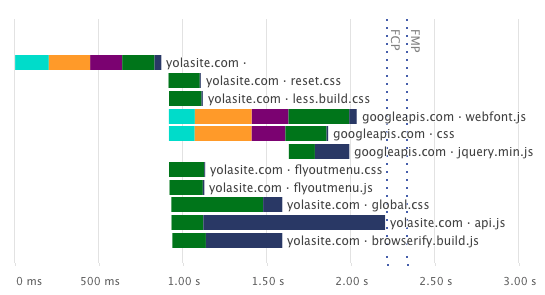
Yola
The Yola site only has partial server-side rendering, most of the work is done by client-side JavaScript. As a result, the page spends 1s running JavaScript before starting to load the background image.
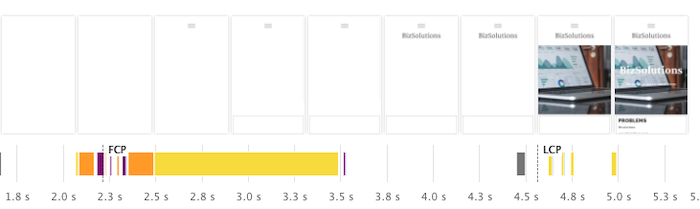
The JavaScript application code, as well as multiple CSS files, also block the initial render for a while.
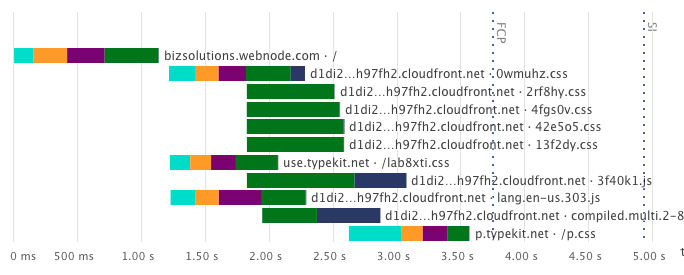
Webnode
On the Webnode site, no content is rendered for the first 4s.
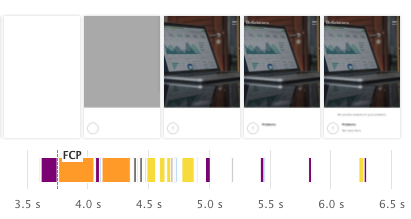
Again we can see a chain of render-blocking CSS requests. The first Typekit CSS file uses @import to load another CSS file.
Importantly, this CSS file is on a different domain, meaning a new server connection has to be set up. This could be sped up by preconnecting to the p.typekit.net domain.
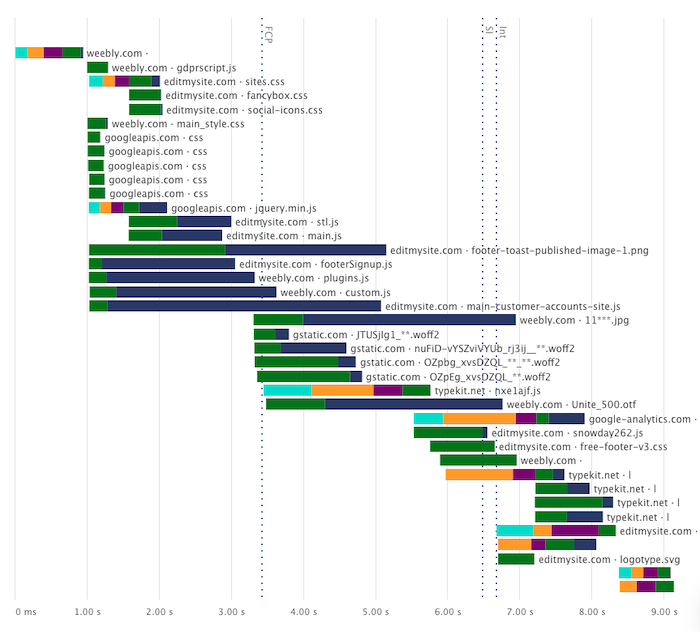
Weebly
Weebly starts rendering after 4s, but text doesn't appear until 5 seconds after opening the page.
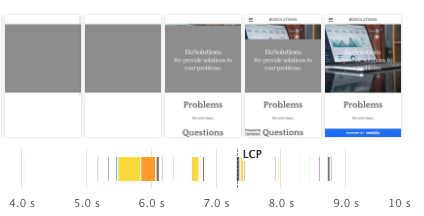
This is because the page is waiting to load the web fonts before rendering the text. This delay could be avoided by using the CSS font-display: swap option, which would use a default font until the desired font is available.
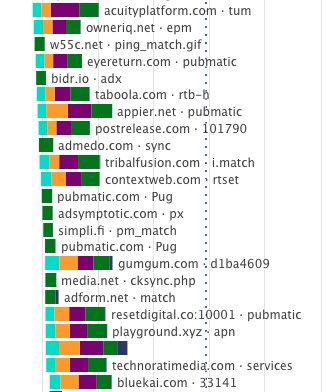
Wordpress.com
The Wordpress.com site starts to render after about 4s and the image loads after 6s.
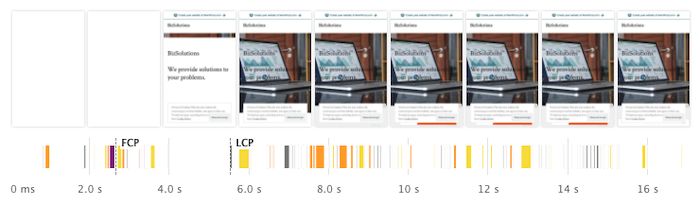
After the initial load it takes a while for the page to become idle. It makes a total of 355 requests, mostly contacting various advertising domains.
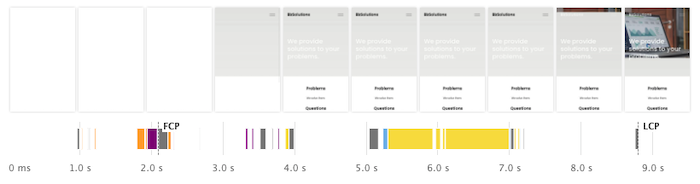
Strikingly
Strikingly inlines all necessary CSS into the initial document request. As a result, there are no render-blocking scripts or stylesheets, and Strikingly has the fastest First Contentful Paint with a value of just 1.1s.
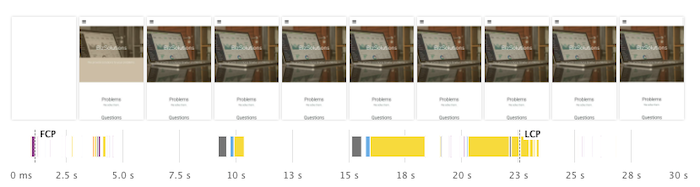
However, the site then continues to download 1.8MB of JavaScript code. All of this needs to load and execute before the page becomes interactive, for example so that visitors can click on the menu icon.
To speed up that process, the bundle size could be reduced and the two scripts could be loaded in parallel.
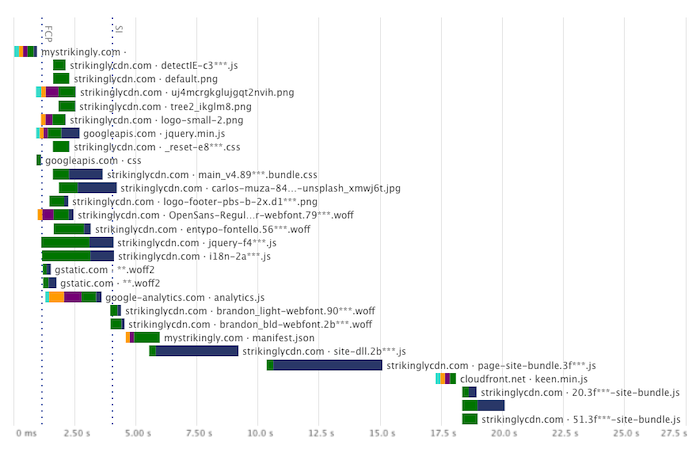
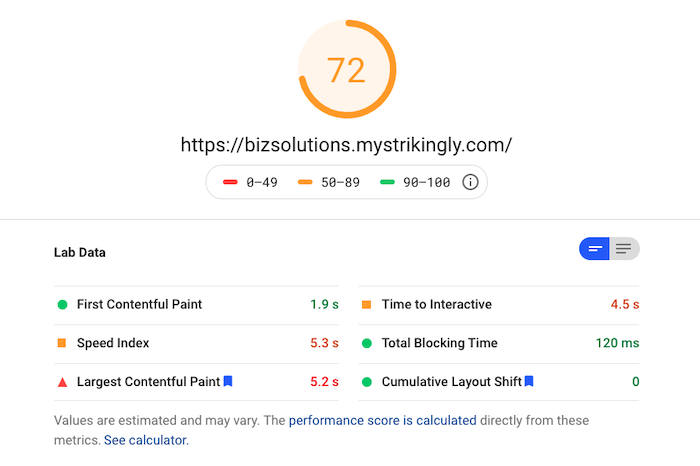
When testing the site with PageSpeed Insights, Lighthouse actually prematurely ends the test before the page finishes loading and becomes interactive. As a result, it reports a Time to Interactive of just 4.5s, and an overall Performance score of 72.
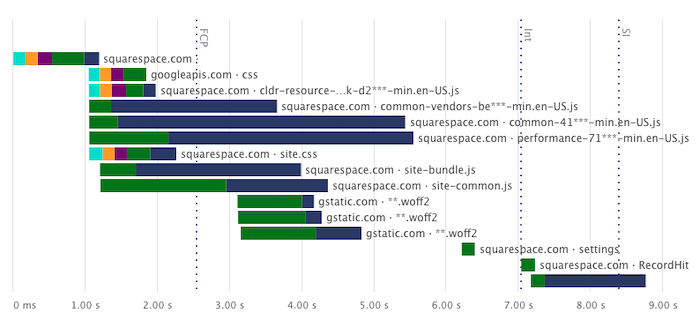
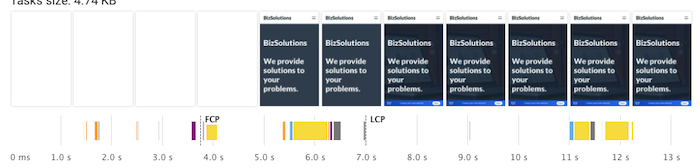
SquareSpace
SquareSpace starts loading reasonably quickly, but it then takes a long time before the background image shows up.
This is because the image is not included in HTML that was rendered on the server, and as a result the browser first needs to download and run 609KB of JavaScript code before starting to load the image.
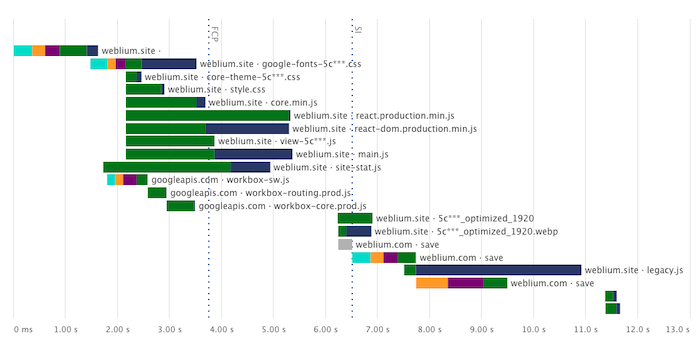
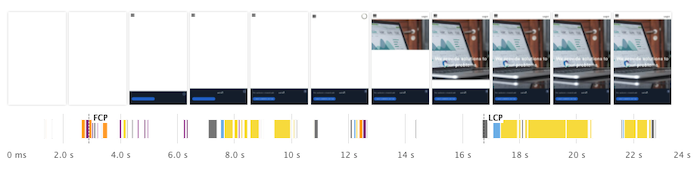
Weblium
Rendering of the Weblium site is blocked for a while due to various CSS files, including a 172 KB stylesheet with embedded web fonts.
After the initial render, Weblium launches a React app and starts downloading the background image. Later on in the process a 475 KB JavaScript file called legacy.js is loaded and run.
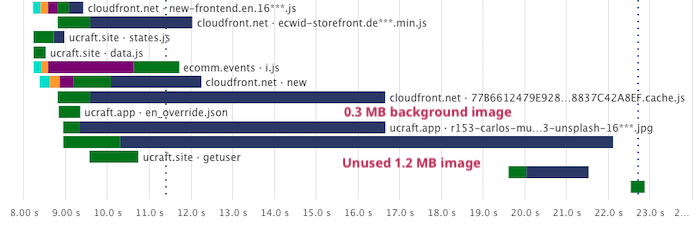
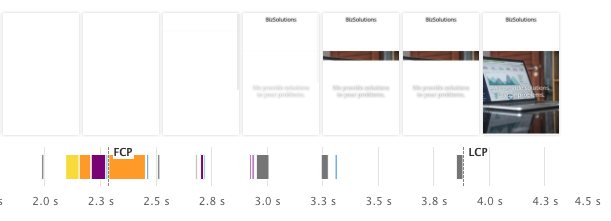
UCraft
The UCraft site starts rendering fairly quickly, but the background image is lazy loaded and depends on JavaScript code to run and trigger the image download.
Once that JavaScript code has run, the page not only downloads the background image but also another 1.16MB that isn't used on the site but appears to be part of the template I used.
Mozello
I tested Mozello as well, but didn't include it in the results because the free plan doesn't support HTTPS. HTTPS is good for security but slightly slows websites down, so it didn't feel like an apples to apples comparison.
Having said that, Mozello's mobile Lighthouse score of 83 was actually the highest overall score. I would expect Mozello sites to be fast even with HTTPS enabled.
With a page weight of 258 KB, Mozello also had the lowest download size. After the initial render there's no further network or CPU activity.
Methodology
In each website builder, I created a simple site with two components: a heading section with a background image, and a three column text section. I tried to remove all unnecessary content from the page and disabled parallax on the image background where it was enabled by default.

Tests were run in Chrome 84 using Lighthouse 6.3.0, packet-level network throttling, and CPU throttling using Chrome DevTools. The throttling settings were chosen to match the default mobile and desktop configurations in Lighthouse.
Each site was tested 7 times and the median run was picked based on the First Contentful Paint and Time to Interactive metrics.
To ensure consistent measurements, and to avoid ending tests prematurely, the default Lighthouse network idle and CPU idle timeouts were increased from 5s to 10s.
Takeaways for site builder developers
There are a few lessons that can be drawn from this post:
- avoid render-blocking request chains of more than 2 requests (e.g. using
@importin your CSS) - when rendering the page on the server, make sure that above-the-fold images are included
- avoid re-rendering the page using large JavaScript apps
More metrics
This table includes additional performance metrics for each website builder.
You can also find full, up to date performance results in the DebugBear project I used to run these tests.
| Site Builder | ▾ Score | #Req | CLS | TBT | Size | JS | CSS | HTML |
|---|---|---|---|---|---|---|---|---|
| Versoly | 80 | 10 | 0 | 69 ms | 453 KB | 43.1 KB | 36.1 KB | 2.15 KB |
| Webflow | 77 | 29 | 0.03 | 130 ms | 671 KB | 54.1 KB | 14.4 KB | 2.27 KB |
| Wix | 72 | 66 | 0.01 | 252 ms | 759 KB | 484 KB | 1.38 KB | 102 KB |
| Site123 | 67 | 25 | 0 | 802 ms | 558 KB | 253 KB | 62.2 KB | 8.96 KB |
| GoDaddy | 63 | 148 | 0.1 | 707 ms | 783 KB | 484 KB | 6.02 KB | 14.1 KB |
| Jimdo | 58 | 16 | 0 | 389 ms | 517 KB | 267 KB | 71.4 KB | 5.93 KB |
| Yola | 54 | 24 | 0.01 | 1.40 s | 615 KB | 164 KB | 6.85 KB | 8.51 KB |
| Webnode | 48 | 29 | 0 | 514 ms | 855 KB | 148 KB | 57.0 KB | 9.68 KB |
| Weebly | 39 | 39 | 0.02 | 676 ms | 996 KB | 429 KB | 43.2 KB | 6.68 KB |
| Wordpress.com | 34 | 355 | 0.01 | 1.64 s | 878 KB | 197 KB | 84.0 KB | 67.7 KB |
| Strikingly | 32 | 52 | 0 | 7.28 s | 2.32 MB | 1.80 MB | 76.5 KB | 29.9 KB |
| SquareSpace | 31 | 15 | 0.05 | 1.91 s | 994 KB | 610 KB | 72.9 KB | 18.5 KB |
| Weblium | 23 | 21 | 0 | 1.83 s | 1.14 MB | 839 KB | 199 KB | 37.2 KB |
| UCraft | 18 | 34 | 0.12 | 6.21 s | 3.29 MB | 1.35 MB | 196 KB | 20.7 KB |
#Req Number of network requests
CLS Cumulative Layout Shift
TBT Total Blocking Time
Sizes Overall page weight and page weight for each resource type
What makes sites built with website builders slow?
Unlike custom-built websites, website builders face a special problem: their developers don't know what the final page will look like. It might be a simple static website with a contact form. Or there might be a blog or a store, or both.
Because many layout elements need to be supported a lot of unnecessary code is loaded. While ideally only the necessary modules should be loaded, this requires more architecture work for the makers of the website builder.
Adding to this each page element needs to be renderable in the site editor, and it's not always easy to split out the editor code from the code for the published site.
Site builders make it easy to create your own website, but how fast are the sites created with them? I tested 13 different tools to find out. (1/n)https://t.co/MmY8bqWMe2
— DebugBear (@DebugBear) November 19, 2020