
Depending on where you run Lighthouse you might see different Performance scores for the same URL. For example, PageSpeed Insights might report a different score than running Lighthouse locally in Chrome DevTools.
In this article, I'll explain the most common reasons for these discrepancies and how you can identify what's causing different scores.
Step 1: Compare key test settings
When comparing Lighthouse scores from different tools, start by checking these settings:
- Device type: are both tests using mobile or desktop emulation?
- Test URL: are you testing the same URL?
- Final screenshot: is the same content showing?
You might see that one test result is rendering a cookie banner while the other isn't. Or your server might be blocking one test agent as a bot but not the other.
In the example below, most of the page is covered up by a cookie banner, which will typically take longer to load than other content.

Step 2: Check score variation between runs using the same tool
Lighthouse scores vary even when running the same test multiple times. This can be due to various reasons:
- Differences in server response time (e.g. whether your server or a third-party server was busy)
- Load order of resources: for example, if a non-critical script sometimes runs before the page is rendered it can delay the page load
- Background processes on your computer may be using CPU or network resources
Once you've completed this step you'll know how much of the score differences actually come from differences between tools. For example, you might find one tool has a score range from 45 to 55 while the other ranges from 50 to 75.
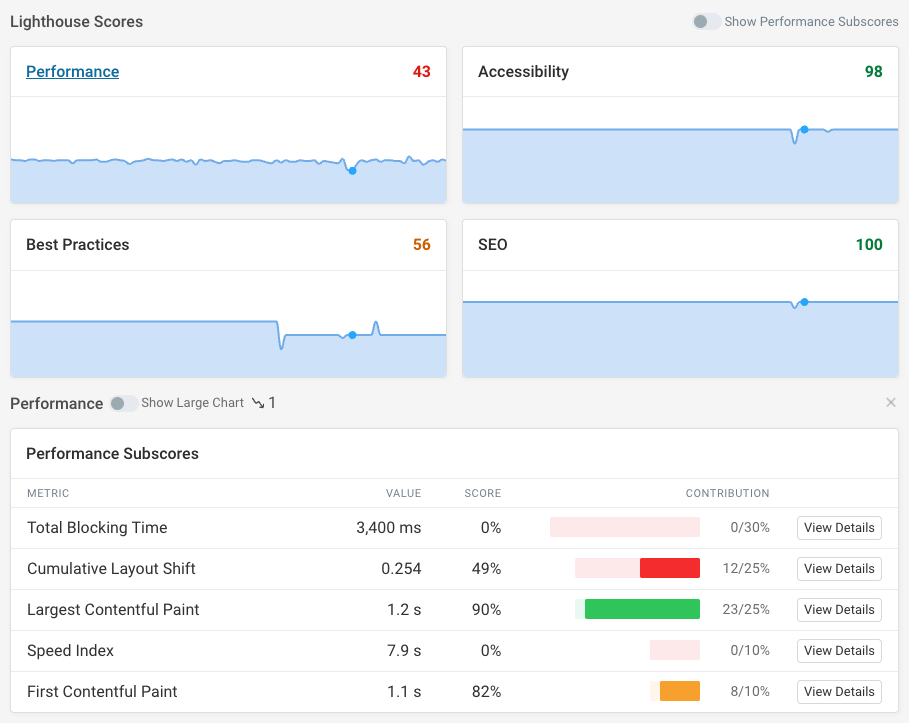
Step 3: Identify what subscores are different
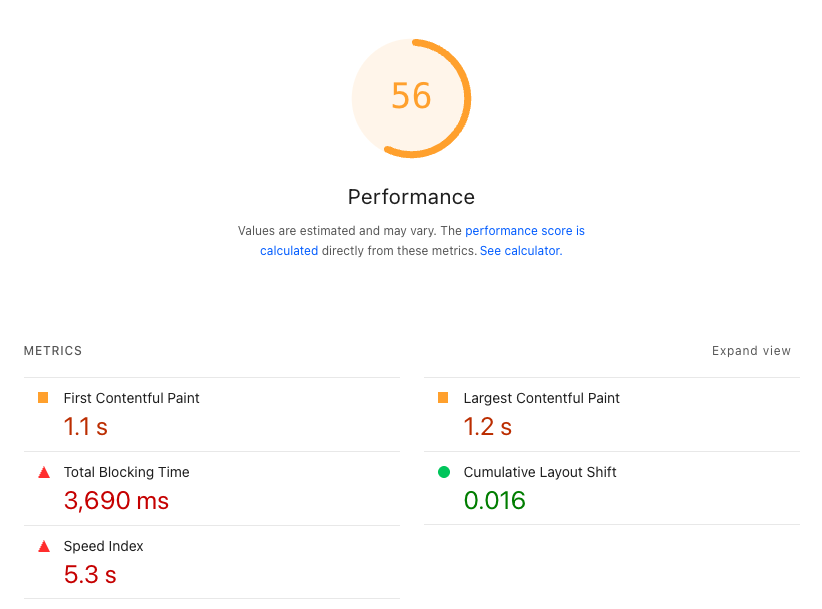
The Lighthouse performance score is calculated by combining five different metrics:
- Total Blocking Time (TBT) makes up 30% of the score
- Cumulative Layout Shift (CLS) makes up 25% of the score
- Largest Contentful Paint (LCP) makes up 25% of the score
- Speed Index makes up 10% of the score
- First Contentful Paint (FCP) makes up 10% of the score
The last three scores all measure rendering performance and are closely related. However, you might find that a difference in CPU blocking time or visual stability explains the overall score discrepancy.
Step 4: Compare configuration differences
Once you know which subscores are different, you can start diagnosing the reasons for the differences.
Compare the network throttling settings
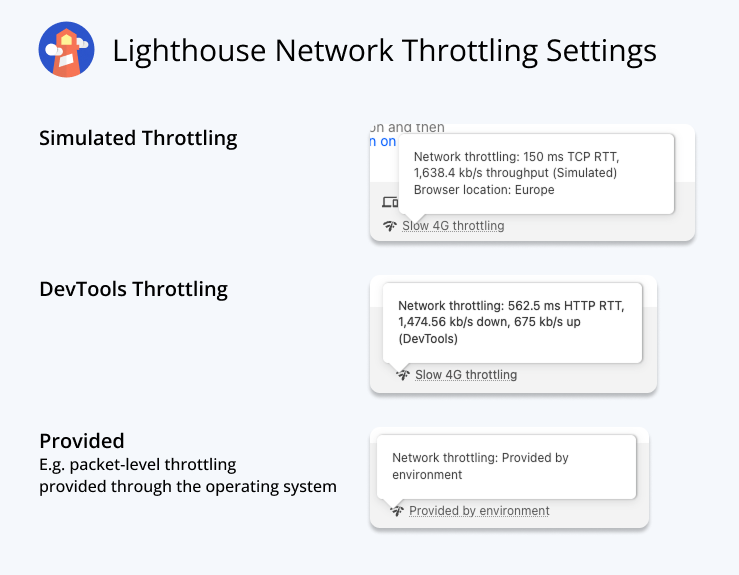
There are different ways to throttle the network speed to match a mobile or desktop connection:
- Simulated throttling is the default: it doesn't collect data on a throttled connection but instead just simulates a slower network.
- DevTools throttling uses the built-in network throttling feature in Google Chrome. It adds a minimum request duration, but has no concept of server connections, request priorities, or other factors that impact real-world performance.
- Packet-level throttling slows down the network outside of Lighthouse. This means each packet can be delayed by the operating system, providing the most realistic results.
Also compare the specific network latency and round trip time that have been configured.
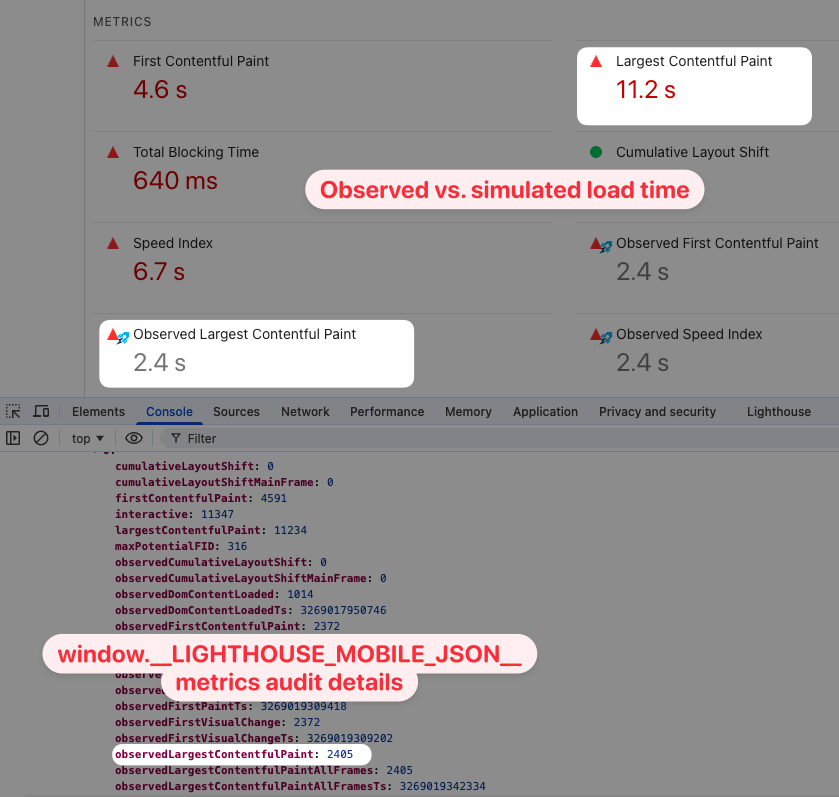
If your test is using simulated throttling, check how the simulation impacts the reported score.
Our Site Speed Chrome Extension can show you the original observed data on PageSpeed Insights. Otherwise you can check the result JSON for observedLargestContentfulPaint and other metrics.
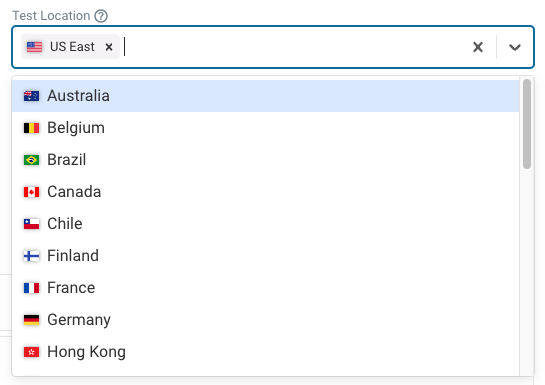
Compare test locations
Where you run the test from determines the network latency to your server. The further away the test location is, the longer it takes for data to travel back and forth.
Depending on the location your server might also serve different content or not load specific third-party scripts by default.
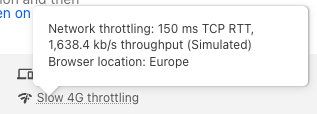
When running tests on PageSpeed Insights, you can find the test location in the network settings tooltip. Depending on where the test is run from, PSI picks one of four data centers.
DebugBear lets you pick one of 30 different test locations when setting up your performance tests.
Compare CPU speed
Both page load time and Total Blocking Time depend on how fast the CPU can process code on your website and render the page content.
Hovering over the Lighthouse emulation settings tells you:
- What level of CPU throttling was applied
- Whether the throttling was simulated or applied during the test
- The CPU/memory power of the environment where the test was run
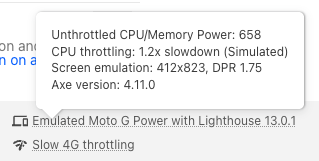
Normally Lighthouse uses a 4x CPU slowdown for mobile tests. However, PageSpeed Insights uses a relatively slow test environment, so it only uses a 1.2x slowdown.
Other factors that impact Lighthouse scores
Beyond comparing the test settings mentioned above, consider whether these settings vary between different tools:
- Do both environments use the same version of Chrome and Lighthouse?
- Are you setting any special flags or cookies that impact how the page loads?
- Do the Lighthouse configuration options vary in any way?
- Are Chrome extensions impacting performance?
- Is one test result hitting a CDN cache while the other isn't?
What tool reports the correct Lighthouse score?
Lighthouse can be run in many different environments, whether that's locally on your computer, on PageSpeed Insights, or in a web performance monitoring tool. Each synthetic test just measures one experience in specific test conditions.
Tools that simulate a slower connection can provide test results more quickly, but can also be unreliable.
Ultimately what matters is how real visitors experience your website. Lighthouse just helps you monitor performance over time and identify specific ways to improve page speed.
What if we need scores to match across tools?
Sometimes you might need to configure your test environment to match an existing service, for example if a client expects a specific Lighthouse score.
If this is the case, you can adjust the network and CPU throttling settings until the scores are more in line. Reducing network latency, increasing bandwidth, and reducing CPU throttling will result in a higher Performance score.
Monitor Lighthouse scores over time
DebugBear can help you monitor Lighthouse scores continuously and alert you to regressions. When a change happens you can easily compare the two test results to see exactly what changed.
We collect data in a realistic throttled test environment. You can pick from 30 different test locations and configure custom CPU and network throttling settings.
Each test result includes detailed analysis that goes beyond what the Lighthouse report provides.
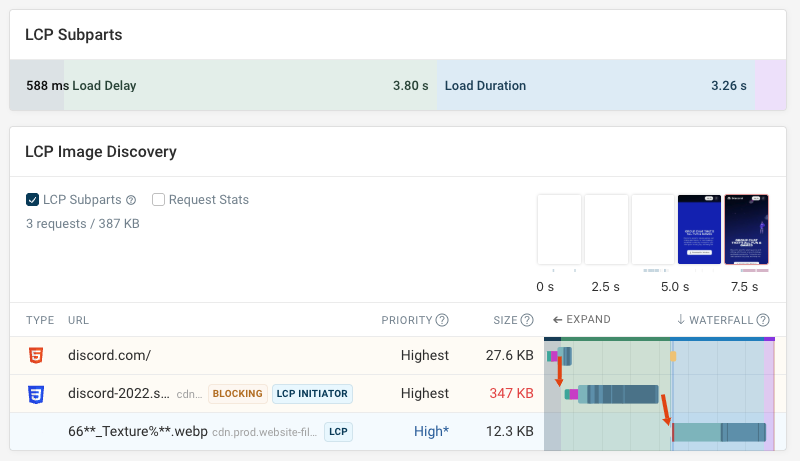
Our request waterfall view makes it easy to see what resources are loaded on your website, how long they take to load, whether they block rendering, and how loading them impacts rendering progress.
You can also run experiments to try out optimizations and measure their impact without deploying any code changes on your live site.
Ultimately, what matters isn't Lighthouse scores but real user experience. Our real user monitoring product lets you track Core Web Vitals and other performance metrics for actual visitors on your website.
You can also get detailed diagnostics showing you what network resources and CPU tasks are having a negative impact on user experience. Sign up for a free trial.


Monitor Page Speed & Core Web Vitals
DebugBear monitoring includes:
- In-depth Page Speed Reports
- Automated Recommendations
- Real User Analytics Data