
Google Search Console (GSC) is a free service Google offers to website owners. It provides insight on how much Google search traffic your websites get, what pages are showing up in Google, and what you can do to optimize your website.
Since the Page Experience Update in 2021, Google has used the Core Web Vitals metrics as a ranking factor. This article will take a closer look at the Web Vitals data that's available in Google Search Console.
What is Google Search Console?
GSC, formerly known as Webmaster Tools, provides verified website owners with a wide range of information:
- How many clicks does my website get from Google?
- What keywords does my website rank for?
- How many pages are included in the Google index?
- Is my website mobile friendly?
- Does my website use a secure connection (HTTPS)?
- How fast is my website?
This information allows website owners to make their website rank higher in Google, debug indexing and performance issues, and track their rankings over time.
Setting up your Search Console account
As this information is only shown to website owners, you first need to sign up to GSC and verify your website.
1. Sign into Search Console
Go to the Search Console homepage and click Start now.
Then log into your Google account or create a new one.
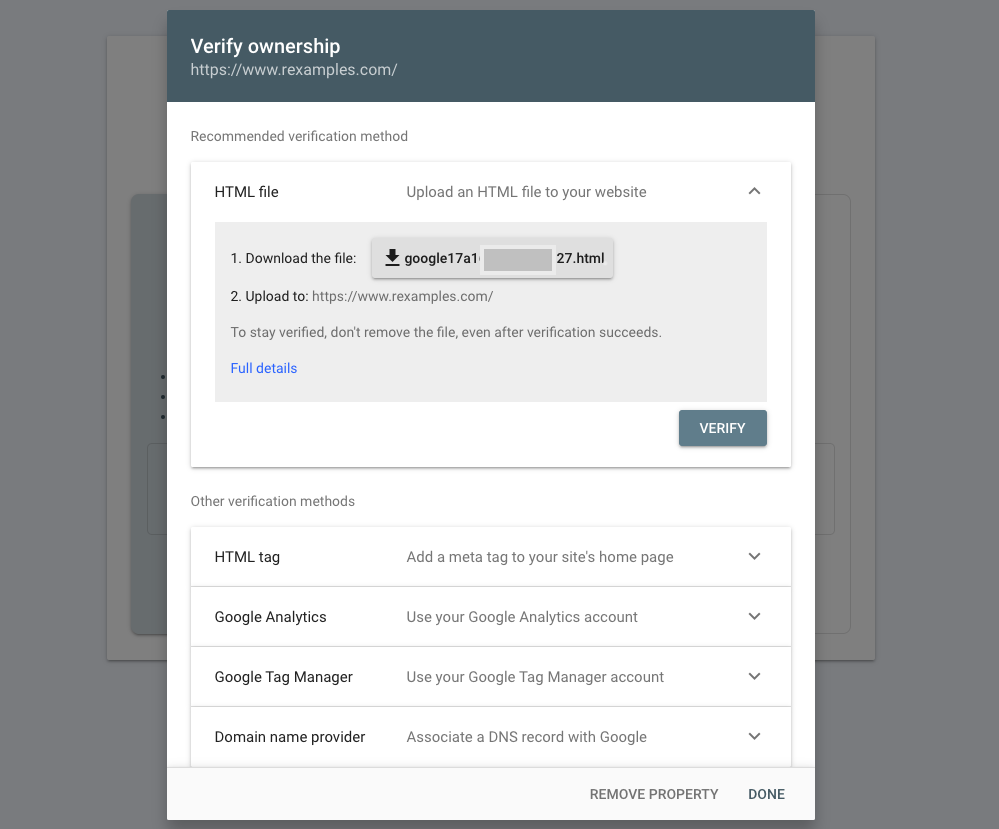
2. Verify your website
GSC then asks you what website you want to verify. You have two options here:
- Verify ownership of an entire domain including all subdomains
- Verify ownership of a specific subdomain (or even a subpath of a subdomain)
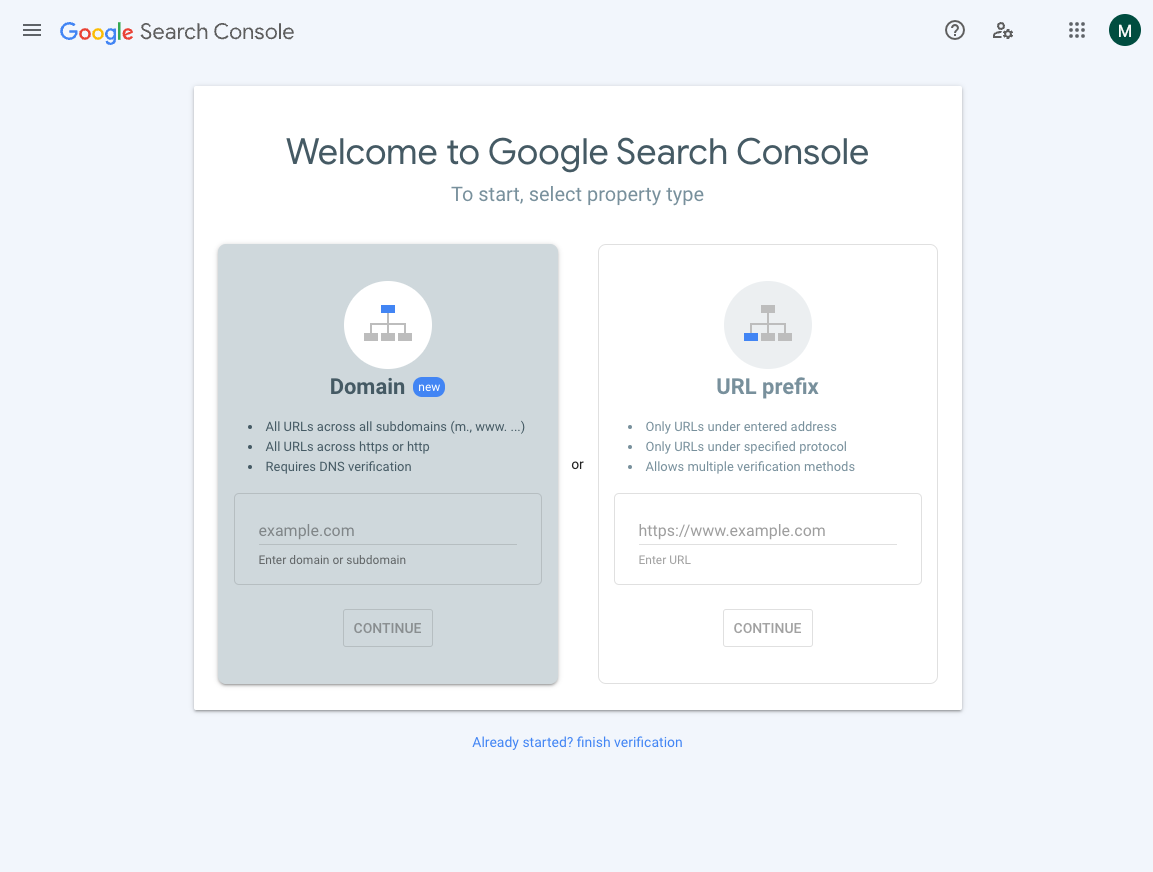
Option 1 requires you to edit DNS records with your domain name provider, so option 2 is often easier.
For example, you can:
- Add a meta tag to your homepage HTML
- Use your existing verified Google Analytics or Google Tag Manager accounts
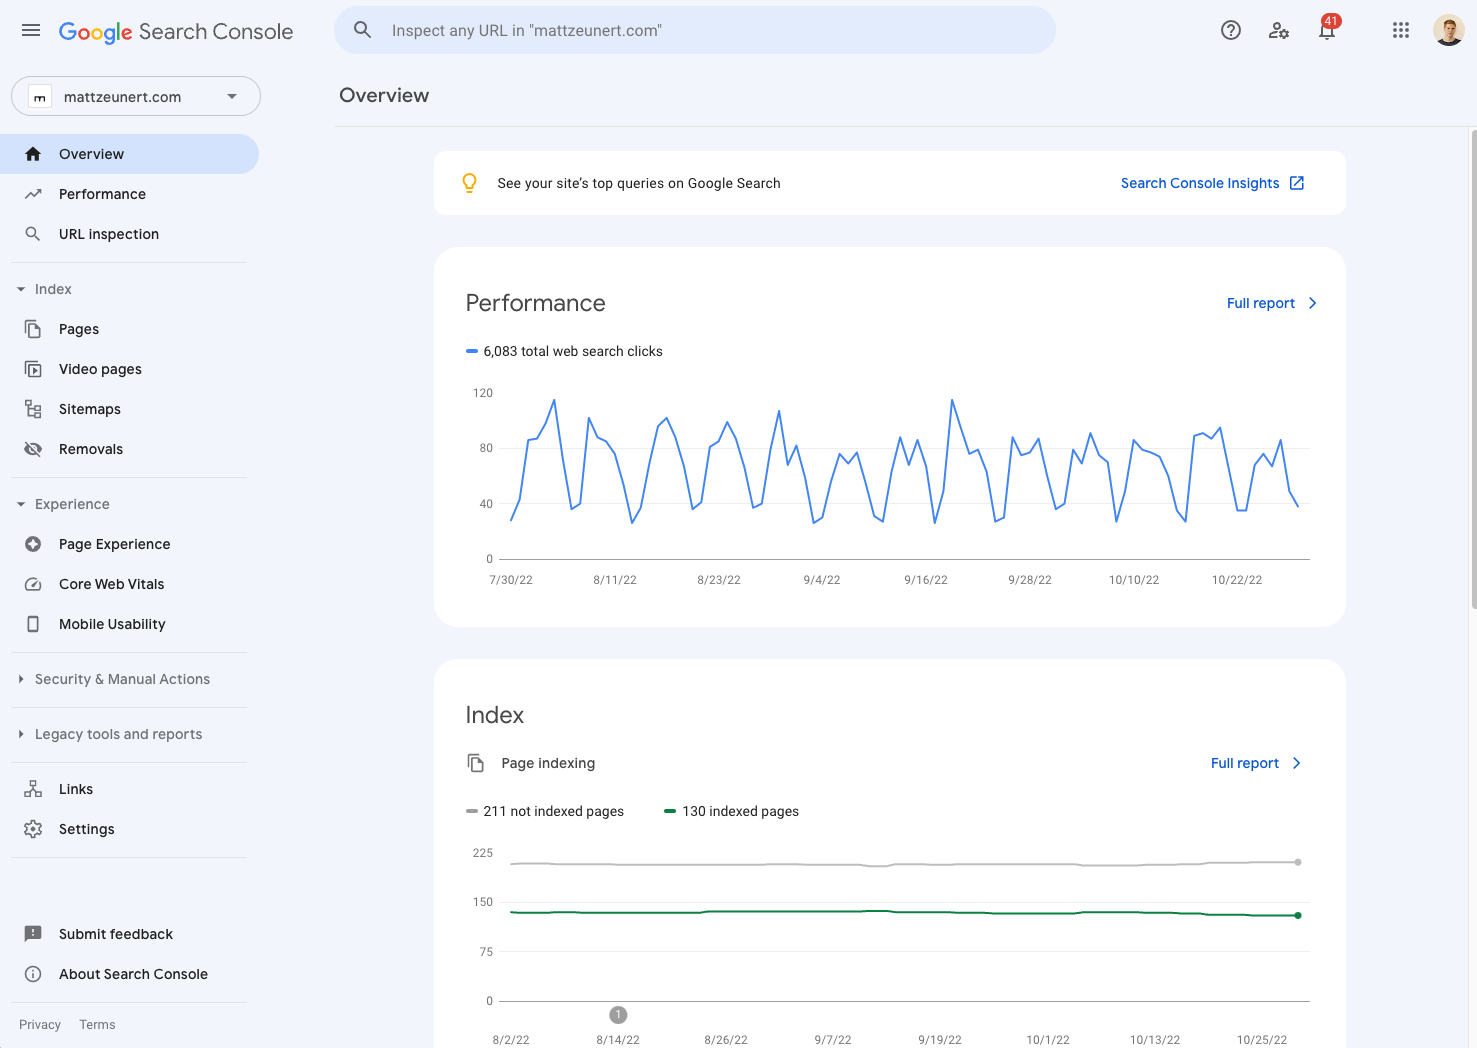
Once your website is verified you can see data about its search performance.
How to view Core Web Vitals data in Google Search Console
Google collects Core Web Vitals as part of the Chrome User Experience Report (CrUX) and uses them as a ranking signal.
To see how your users experience your website, select the Core Web Vitals tab in the Search Console sidebar.
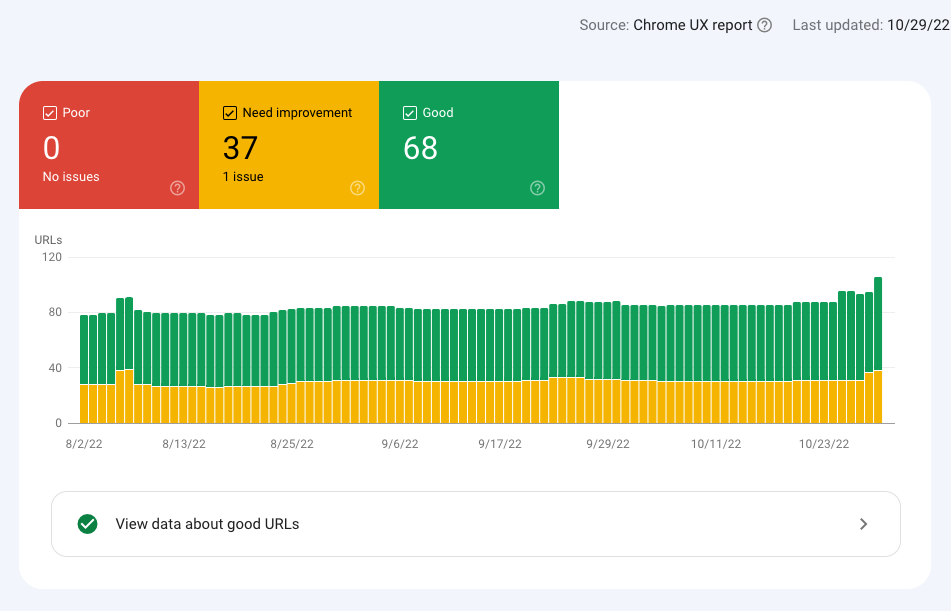
Google then shows you how many pages on your website it views as "Good", "Needs Improvement", or "Poor". The report is grouped into mobile and desktop experiences.
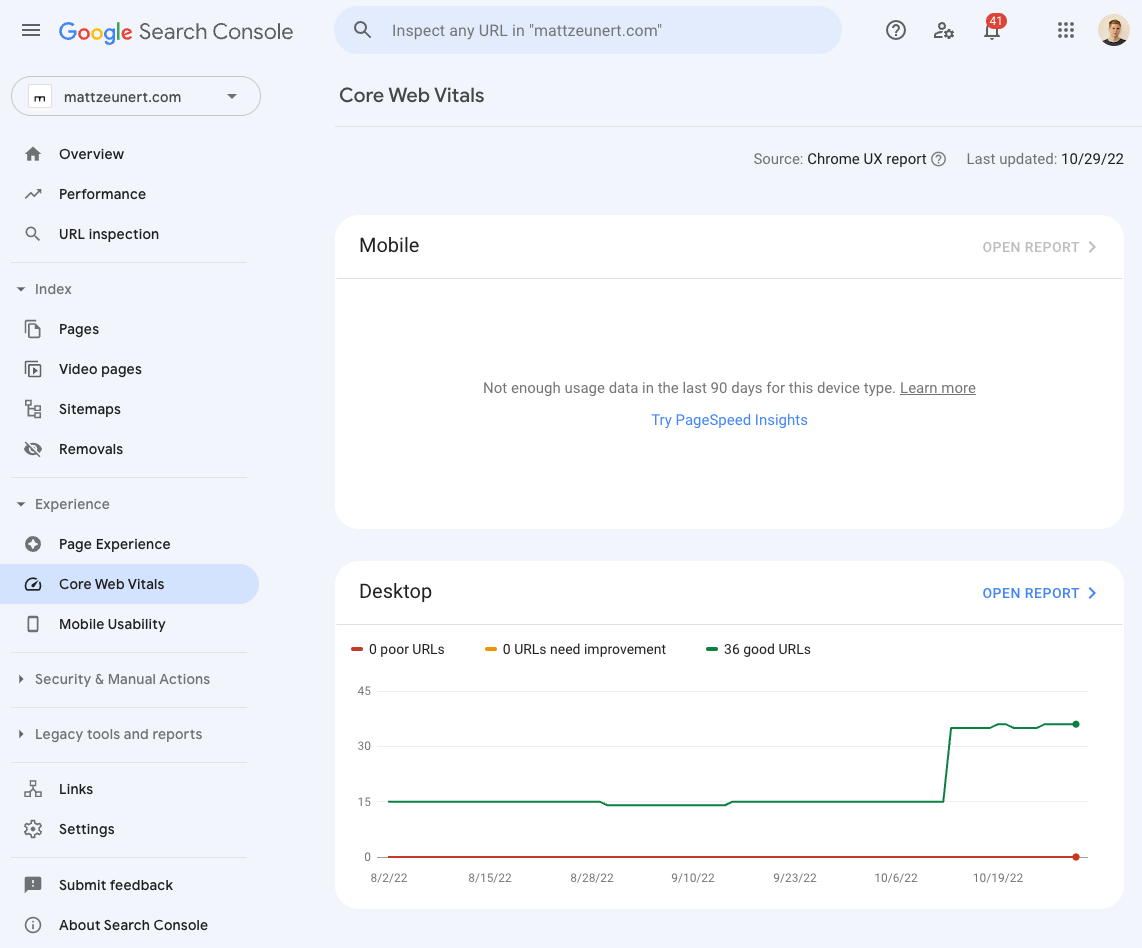
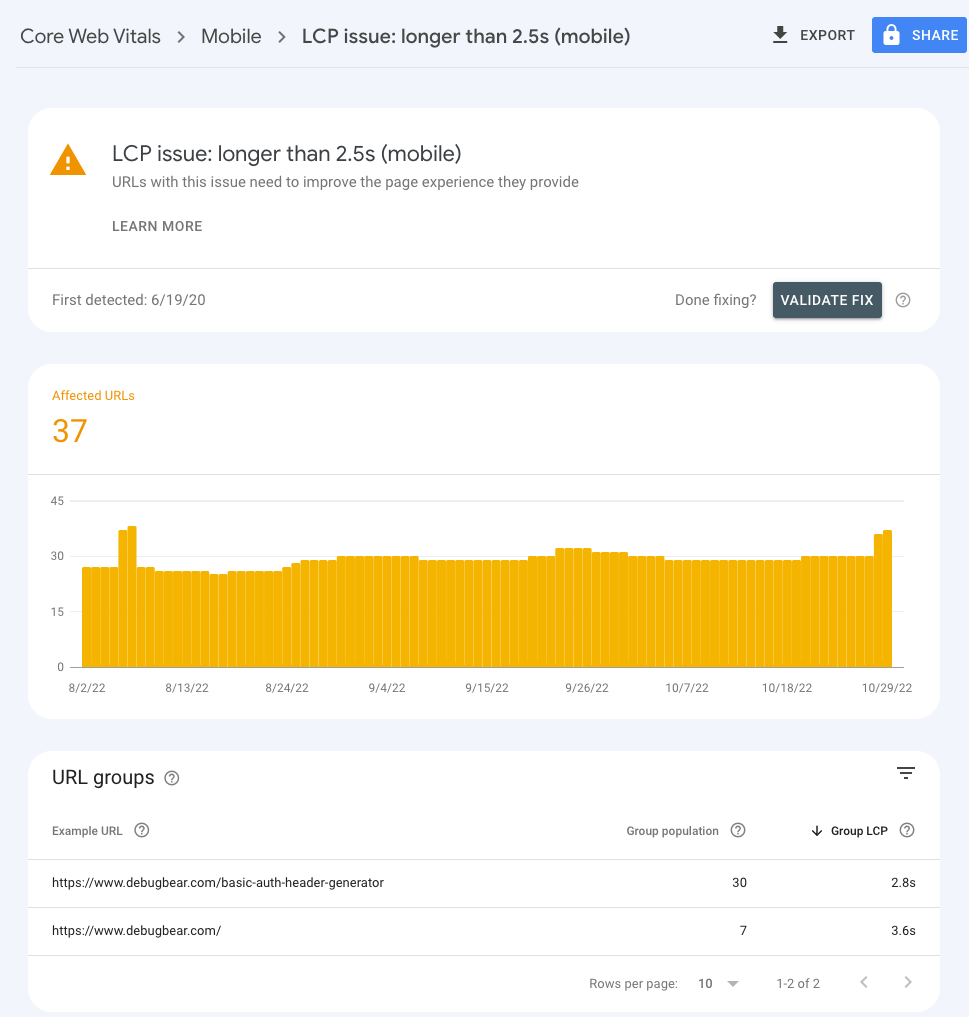
Click Open Report to see more details about Core Web Vitals on your website.
The bar chart shows you how many pages meet the Web Vitals thresholds, and how many you need to work on. By default only "Poor" experiences are shown, so click on the "Need improvement" and "Good" headers to see all data.
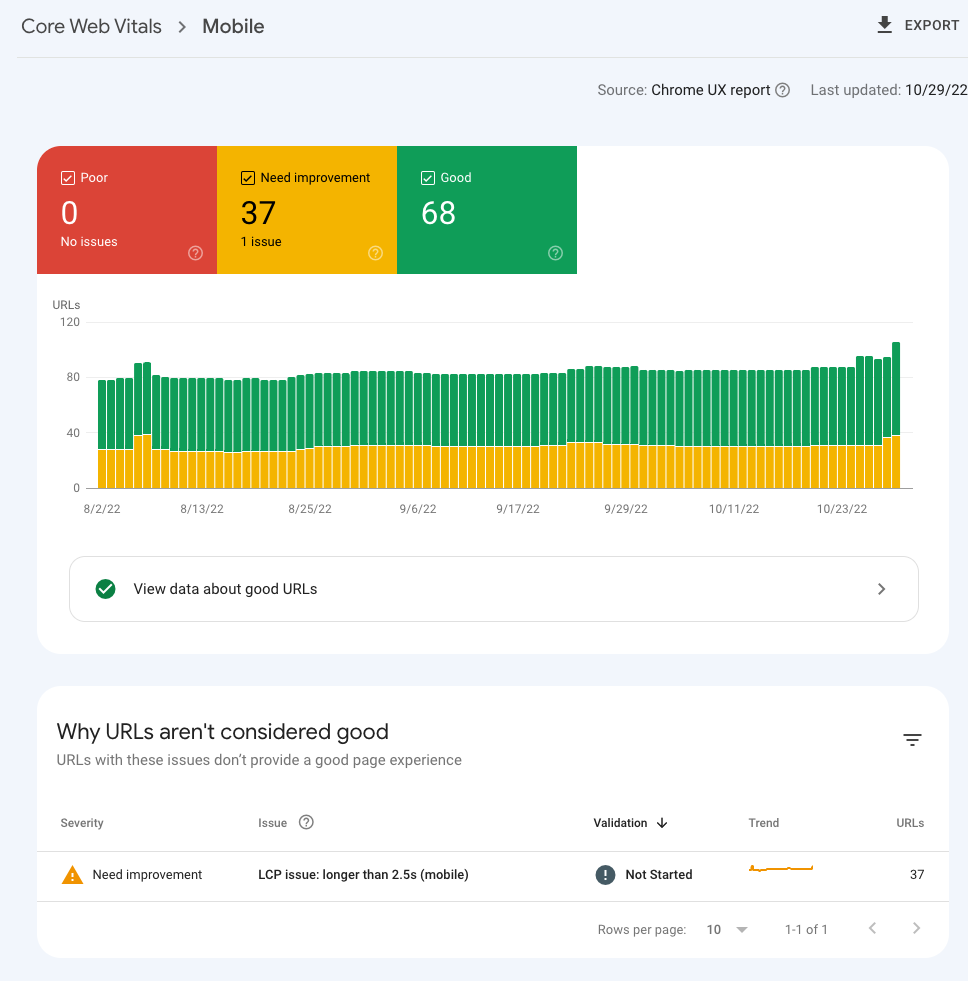
Under the chart there's a Why URLs aren't considered good section that tells on which of the three Core Web Vitals your website isn't doing well on:
- LCP issue: Largest Contentful Paint is too high, the page takes too long to load
- CLS issue: Cumulative Layout Shift is too high, page content shifts around after rendering
- INP issue: Interaction to Next Paint is too high, user interactions are slow
For each issue you can also see the number of URLs that are affected in rankings.
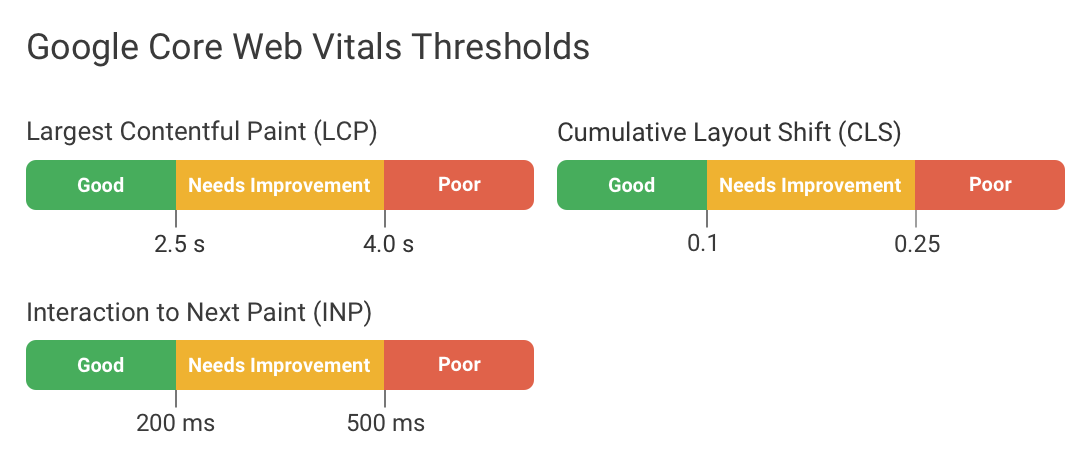
To pass the Core Web Vitals assessment your LCP needs to be below 2.5 seconds, CLS should be less than 0.1, and INP should be below 200 milliseconds.
How to view what website URLs have slow Core Web Vitals
You can click on each of the web vitals issues in Google Search Console to see specific groups of pages that are impacted.
By default just one example URL is shown, but you can get a longer list of URLs in that group by clicking on the group.
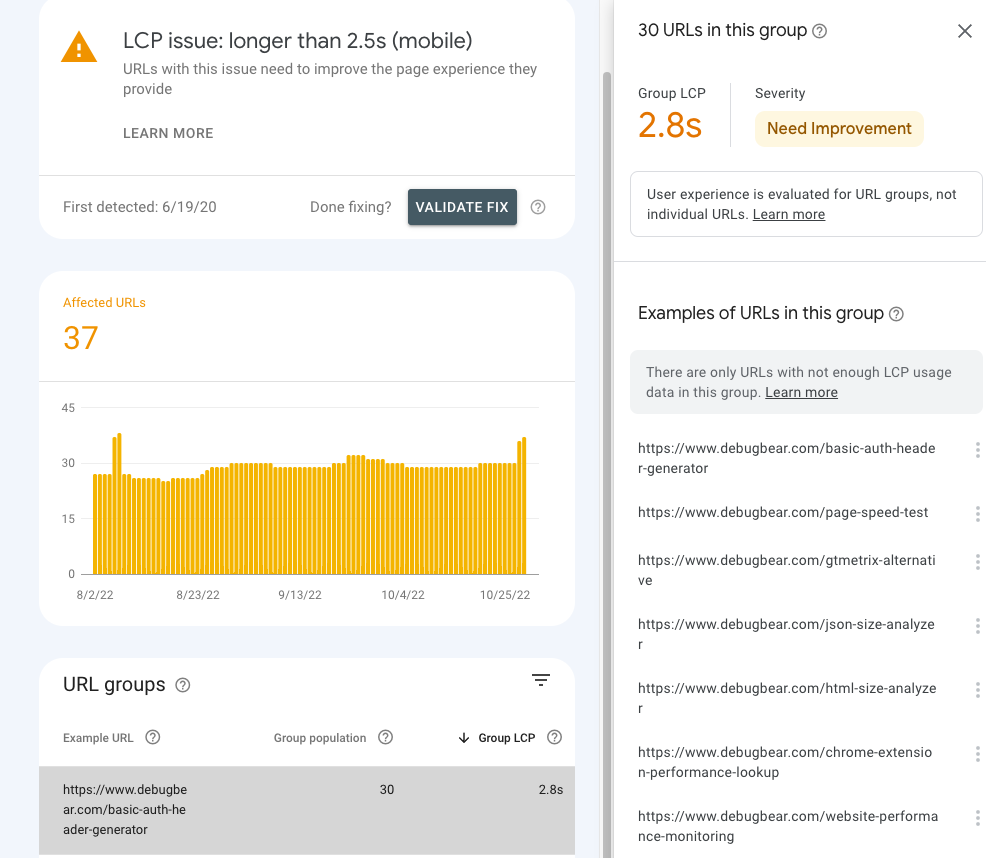
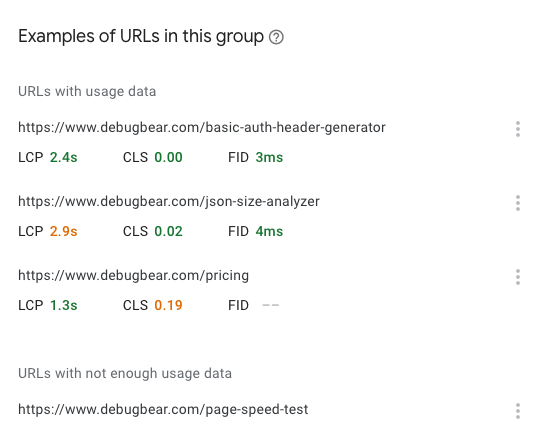
What are URL groups?
Google doesn't have enough data about every page on your website in order to assess its Core Web Vitals.
Therefore, URLs are put together into URL groups if Google thinks that the pages have a similar type. For example, if you have many product pages Google might group them together and they would share the web vitals ranking signal.
However, this process isn't perfect and sometimes fast pages might be grouped with slower pages. Being included in a slow group doesn't necessarily mean that a particular URL is slow.
URL groups with Core Web Vitals issues are likely to contain both pages that pass the Core Web Vitals assessment and pages that need to be optimized. If individual pages get a lot of traffic, Search Console will also report URL-specific data.
How to fix Core Web Vitals issues
To fix Core Web Vitals issues you can follow these steps:
- Identify failing metrics
- Check what pages are impacted
- Investigate performance issues on those pages.
Our article on how to improve website performance provides a detailed guide on how to investigate and fix web vitals issues on your website.
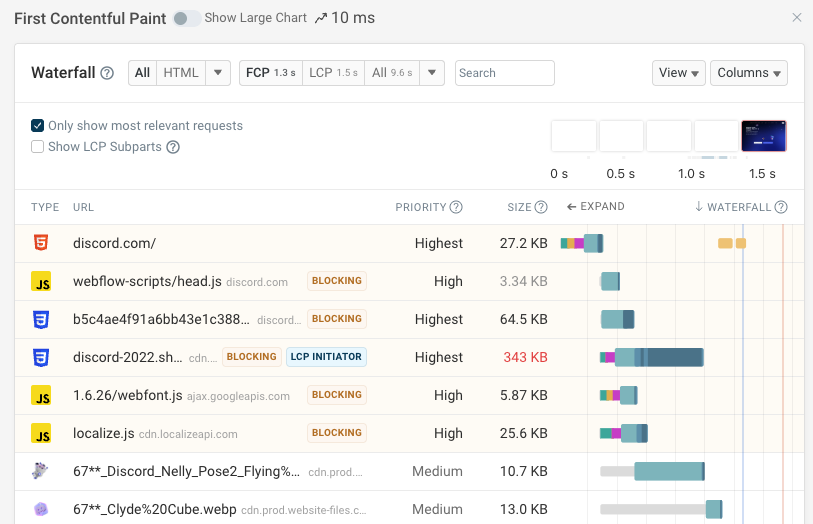
To fix LCP issues you can:
A request waterfall chart can help you understand what resources your website is loading and how they impact rendering.
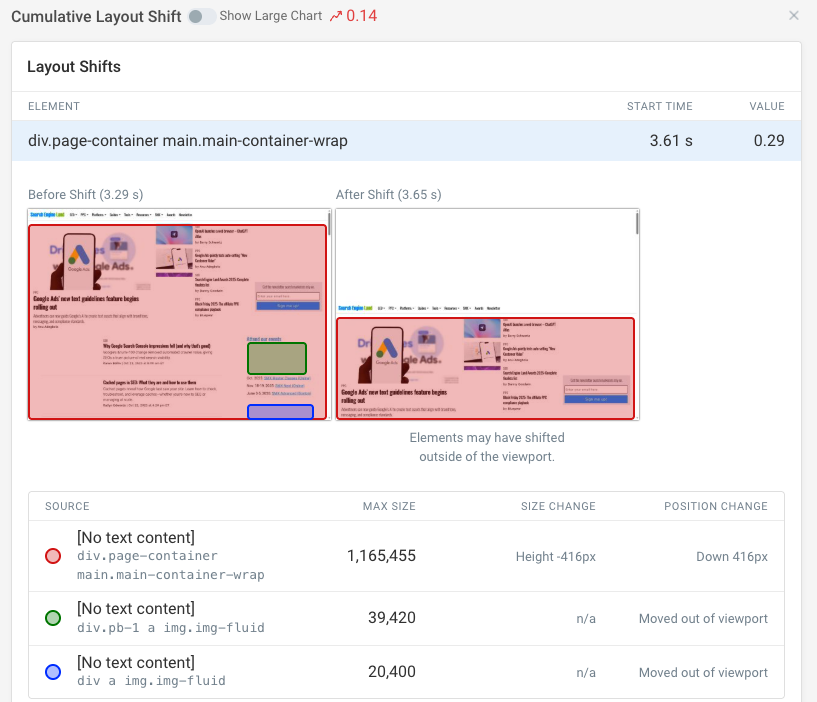
Try this to fix CLS issues:
- Set a min-height for dynamic content
- Define a fixed size or aspect ratio for images
- Prevent layout shifts caused by font changes
A website performance test can tell you not just the exact CLS score but also shows individual elements that have shifted.
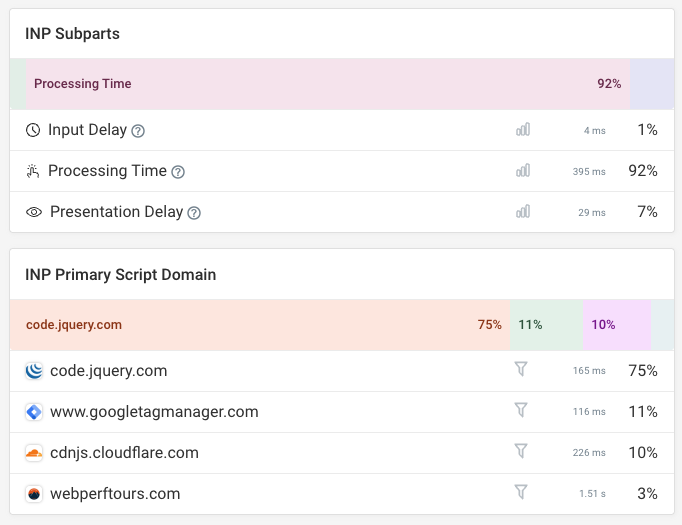
And for fixing INP issues:
- Identify elements causing slow interaction with real user monitoring
- Reduce background tasks on the main thread to fix input delay
- Identify specific slow scripts with the Long Animation Frames API
- Optimize your JavaScript code
Real user monitoring data can tell you what scripts are delaying rendering and what elements cause slow interactions.
Deciding what pages to optimize
If your website gets a lot of traffic Search Console will show URL-specific data that you can use to decide what pages to optimize.
However, if you don't have URL-level data from real users, you need to test each URL in the lab. For example, you can use our free website speed test tool.
You can then focus your efforts on the slowest URLs, and those that get the most traffic.
Scan your website for slow pages
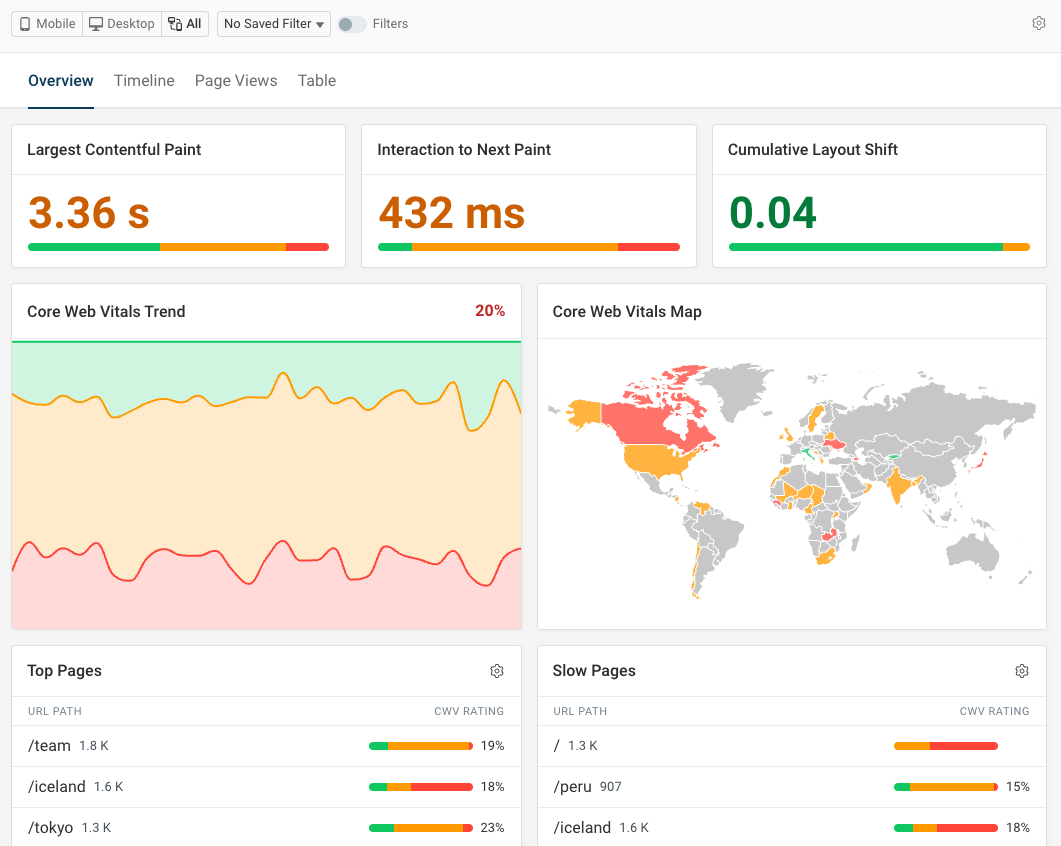
If your website gets enough traffic you can use the DebugBear website scan to identify slow pages on your website based on real user data from Google's Chrome UX report.
You can then focus on fixing performance on pages that actually cause poor experience for many visitors.

Continuous real-time Core Web Vitals reporting
Google Search Console will show a timeline of how many pages meet the "Good" Core Web Vitals thresholds. But this is based on data from the last 30 days, so it will take a while for the data to update. You also won't be able to track the values of specific metrics over time.
DebugBear can help you optimize your pages and keep them fast by monitoring your website over time. We run daily lab tests on mobile and desktop devices across 30+ locations. But we also keep track of the URL-level Core Web Vitals data by Google.
You can also use real-user monitoring to see how actual visitors experience your website. Unlike CrUX data, these metrics update in real-time and include detailed debug data to help you fix issues.
Get alerted to regressions and check that your optimizations have the impact you were hoping for.
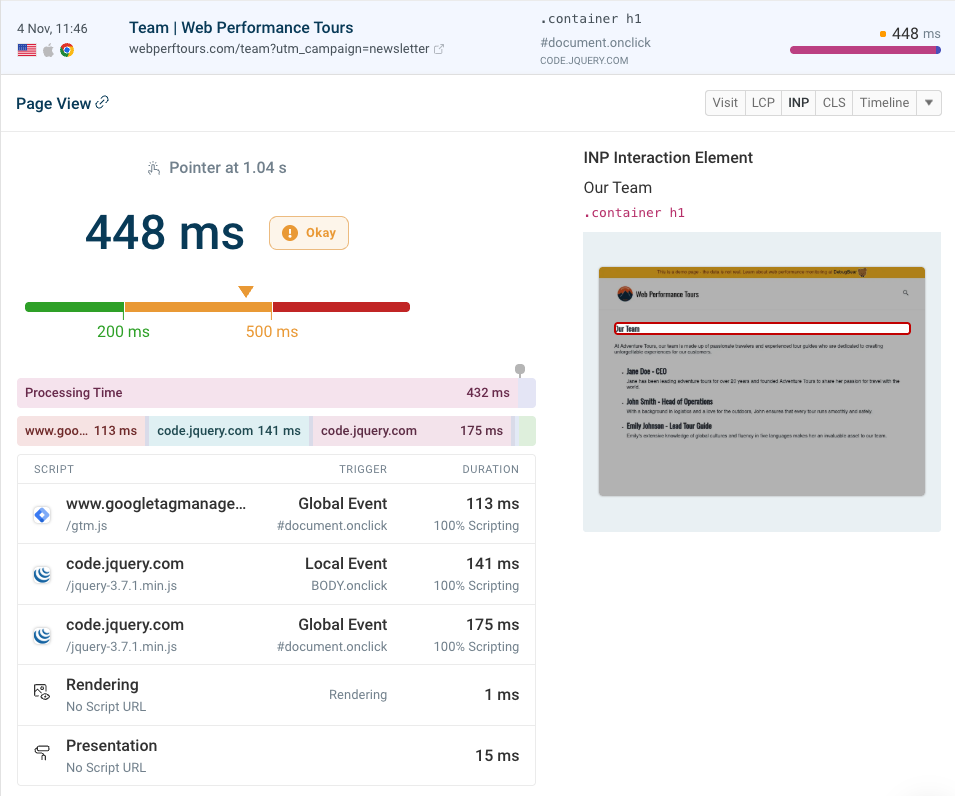
Investigate individual page views to see what caused performance problems for specific users. For example, you can see:
- Information on device and network speed
- What network requests were made when loading the page
- What scripts slowed down an interaction


Monitor Page Speed & Core Web Vitals
DebugBear monitoring includes:
- In-depth Page Speed Reports
- Automated Recommendations
- Real User Analytics Data