RUM Snippet API
You can configure DebugBear Real user monitoring (RUM) directly from the DebugBear dashboard. However, you can also control the behavior of the snippet with code on your website.
When to call the DebugBear RUM code
You can call the DebugBear RUM API code from anywhere on the page as long as the dbbRum global is first initialized like this:
// Initialize the dbbRum array in case the DebugBear script hasn't loaded yet
window.dbbRum = window.dbbRum || [];
// Call the DebugBear RUM API or queue an API call
window.dbbRum.push(["API_CALL", "PARAMETER"])
Controlling the sampling rate
You can set the page view sampling rate via the dashboard or configure it on the page like this:
<script>
  window.dbbRum = window.dbbRum || [];
  //Track 20% of page views
  window.dbbRum.push(["sampling", 20]);
</script>
Tagging page views
You can tag page views using the tag1, tag2, tag3, tag4, and tag5 API actions. Each tag takes a string parameter as its value.
<script>
  window.dbbRum = window.dbbRum || [];
  // Your custom logic to decide what tag value to set
  const tag1Value = userIsLoggedIn ? "LoggedIn" : "LoggedOut";
  window.dbbRum.push(["tag1", tag1Value]);
  window.dbbRum.push(["tag2", "UserType_Editor"]);
</script>
Tags then show up as part of the individual page view details:
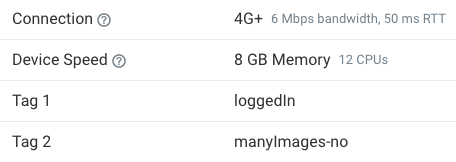
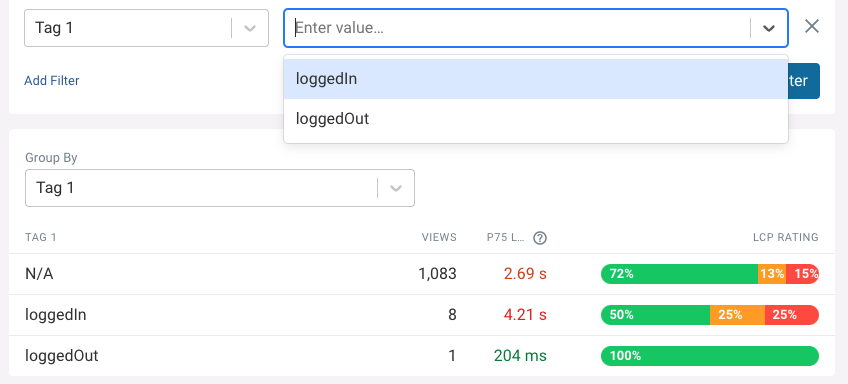
You can also view breakdowns by tag or filter for a specific tag value.
Recording custom metrics
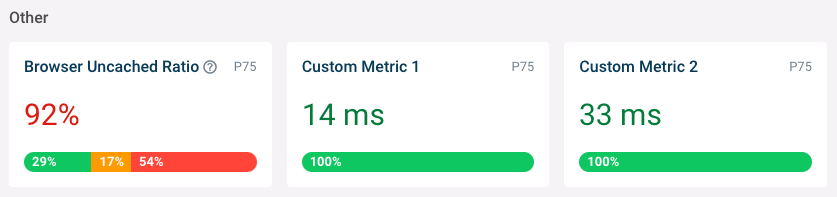
You can record custom performance metrics as metric1 to metric5.
For example, you can save milestones marked with the user timing API.
<script>
  window.dbbRum = window.dbbRum || [];
  const customTimingMark = performance
    .getEntriesByType("mark")
    .find((m) => m.name === "Run index.tsx");
  window.dbbRum.push(["metric1", customTimingMark.startTime]);
</script>
You can then find this metric data at the bottom of the More Metrics tab.
Recording conversions
If you use session tracking and conversion monitoring you can report conversion events to correlate them with your performance metrics.
window.dbbRum = window.dbbRum || [];
window.dbbRum.push(["conversion", "Open Checkout"]);