
The GTmetrix speed test provides a number of high-level page speed metrics, including the overall GTmetrix letter grade.
In this article we'll take a look at how this grade is calculated, how much it matters, and what you can do to optimize it.
What does the GTmetrix grade measure?
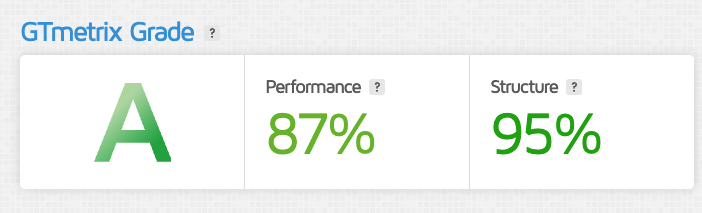
The GTmetrix grade provides a score indicating how fast your website is. A fast site gets an A while a very slow page gets a failing F grade.
The GTmetrix grade itself combines two subscores:
- The Lighthouse Performance score makes up 60% of the grade
- The GTmetrix-specific Structure score makes up the other 40%
Both of these scores in turn are based on a number of different page speed metrics and audits.
How is the GTmetrix grade calculated?
The Performance and Structure score are combined into a percentage score which is then converted to a grade:
| Grade | Score Range |
|---|---|
| A | 90% to 100% |
| B | 80% to 89% |
| C | 70% to 79% |
| D | 60% to 69% |
| E | 50% to 59% |
| F | 0% to 49% |
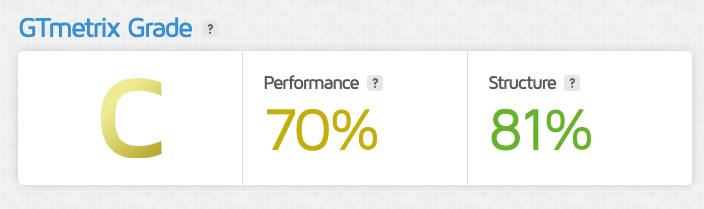
Let's look at an example:
- The Performance score is 70%
- The Structure score is 81%
The overall GTmetrix score is therefore 70% * 0.6 + 81% * 0.4 = 74%. Since this is between 70% and 79%, the resulting GTmetrix letter grade is a C.
How is the Performance score calculated?
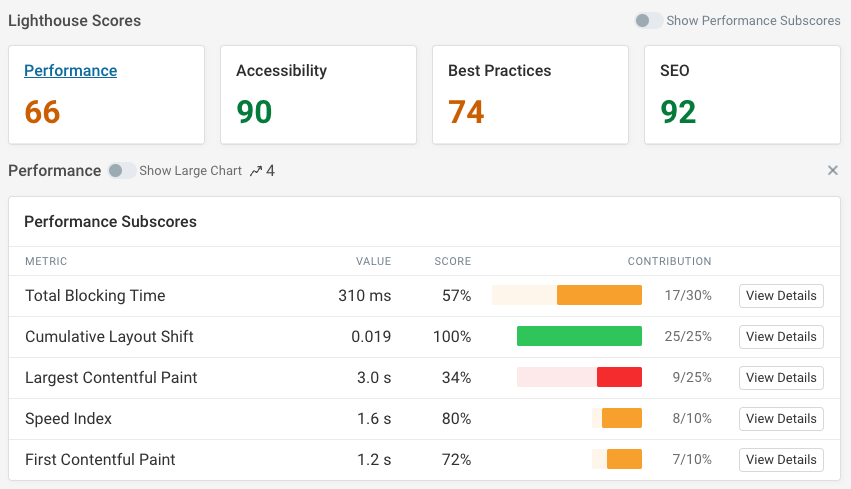
GTmetrix is built on top of Google Lighthouse. Therefore it follows the same score calculation:
- 30% Total Blocking Time: how much time is spent on CPU processing?
- 25% Cumulative Layout Shift: does content shift around after rendering?
- 25% Largest Contentful Paint: how soon does the main page content render?
- 10% First Contentful Paint: how quickly does any content render?
- 10% Speed Index: how quickly does the page render overall?
If you run a free website speed test with DebugBear you can find the score breakdown by opening the Lighthouse tab and then clicking on Performance.
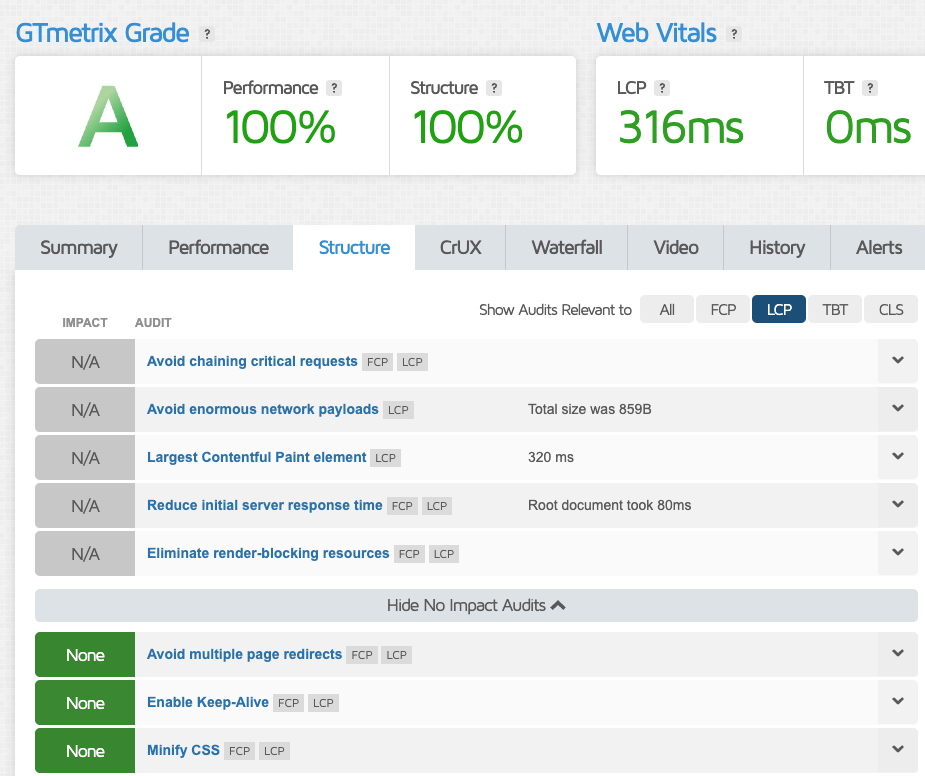
How is the Structure score calculated?
While the Performance score is based on different page speed metrics, the Structure score combines several more qualitative assessments of your page speed into one metric.
The Structure tab in the GTmetrix results shows the different audits that impact this score. The more passing audits you have, the better your Structure score will be.
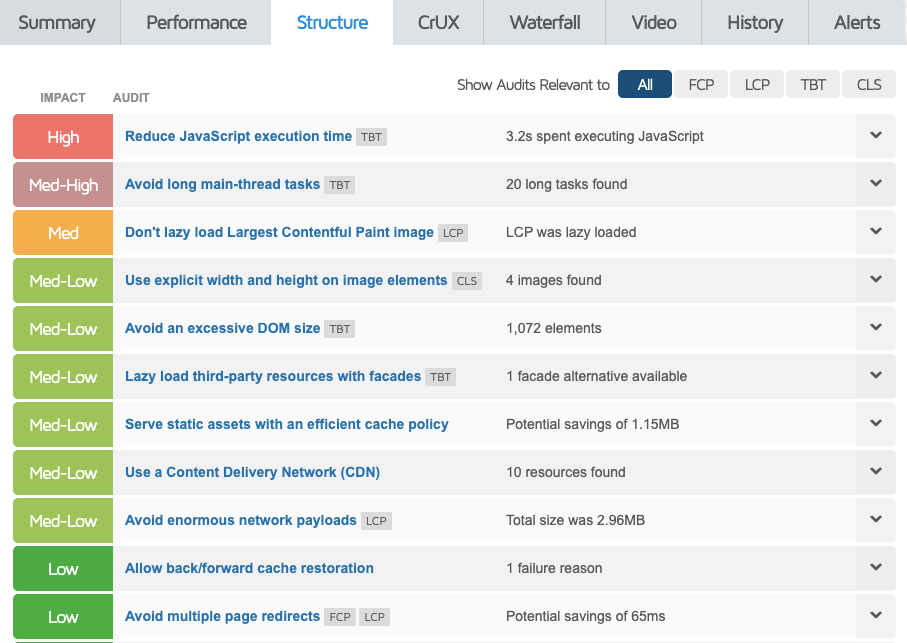
When GTmetrix can't detect any problems you'll get a score of 100%.
GTmetrix grade vs. Core Web Vitals
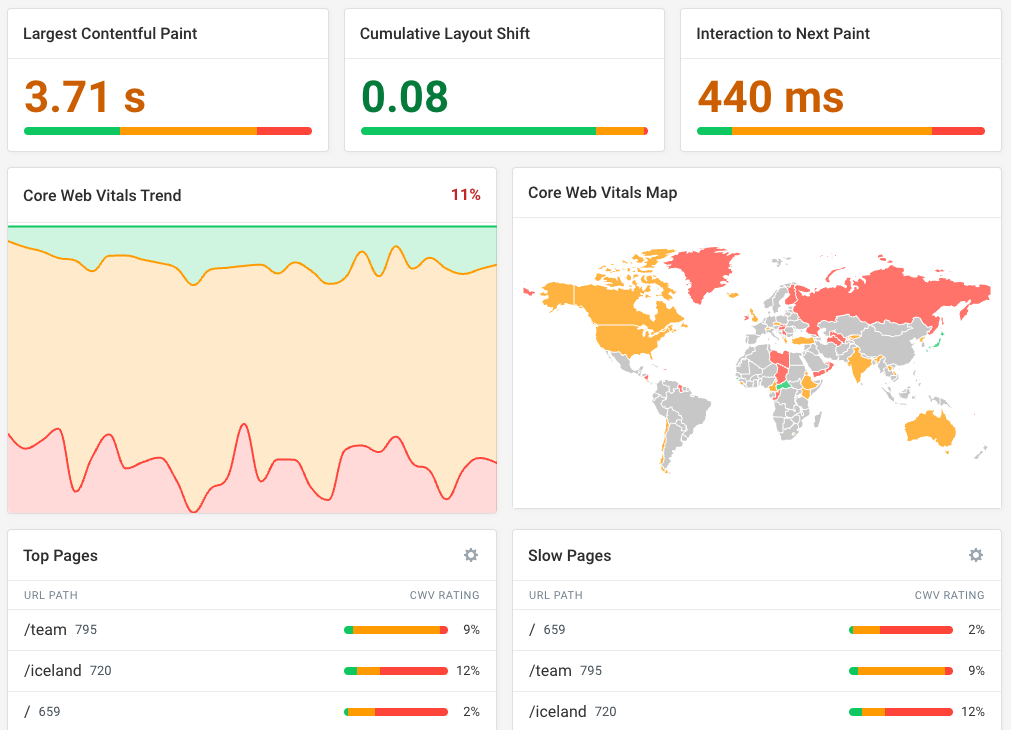
The GTmetrix grade is a purely lab-based performance measurement, based on data collected in a GTmetrix cloud data center. In contrast, the Core Web Vitals are often used to measure real user experience.
Lighthouse and GTmetrix are focused on helping you find ways to improve your page speed. Real user data instead tells you how fast your site is for actual visitors, and it's also what Google uses as an SEO ranking signal.
The third Core Web Vitals metric, Interaction to Next Paint requires a user interaction to be measured. As a result, it's typically not available as part of lab-based test results.
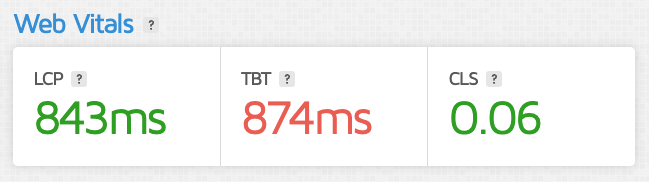
Note that the web vitals section at the top of the GTmetrix report is based on synthetic data. Because of that, it shows the Total Blocking Time (TBT) metric as a substitute for Interaction to Next Paint.
GTmetrix vs. PageSpeed Insights
Google's PageSpeed Insights tool does not provide a letter grade for your website. But the Performance score is based on Lighthouse, just like GTmetrix.
You may sometimes see score differences between PageSpeed Insights and other Lighthouse-based tools. There can be many reasons for this, for example:
- Different network and CPU speeds used to collect the data
- Limitations in how PageSpeed Insights measures performance
- Regional differences depending on the test device location
- Different Chrome and Lighthouse versions
It's common for different tools to report different scores. Ultimately lab test scores don't matter: it's all about real user experience!
Try out Debugbear real user monitoring if you want to measure Core Web Vitals for visitors across your website!
How to improve your GTmetrix grade
The web performance audits in GTmetrix can provide a starting point to speed up your website and improve your grade.
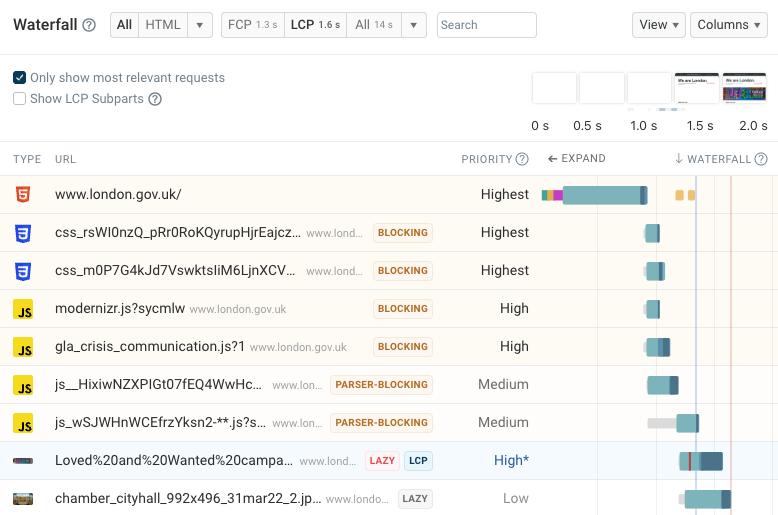
Request waterfalls also provide a lot of insight into what's slowing down your website. They highlight when different page resources load and how that correlates with what visitors can see at that point.
Optimizing the most important requests and making sure low-priority resources load later ensures that your website loads as quickly as possible.
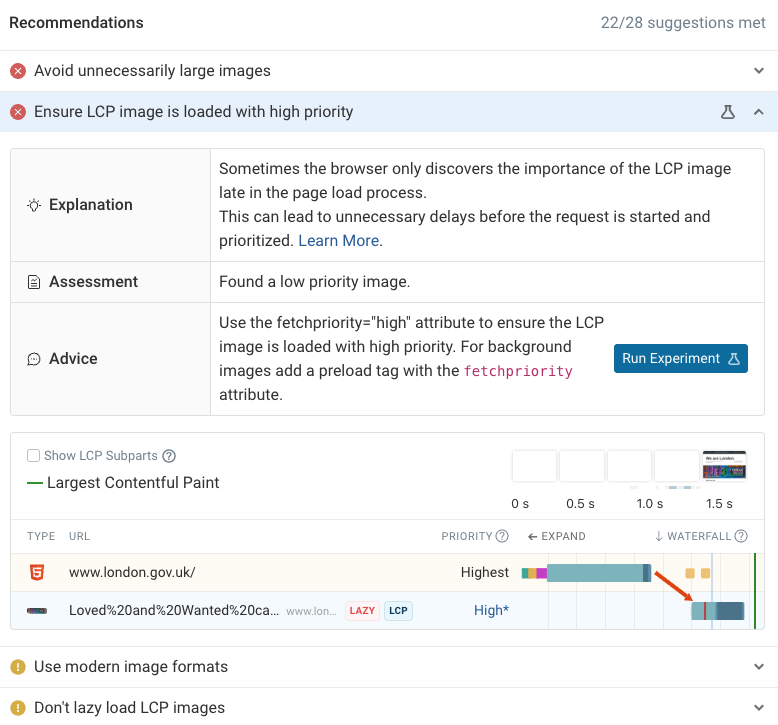
You can also use DebugBear to go beyond the performance audits that come with Google Lighthouse and get custom performance recommendations for your website.
For some of these you can also run automated experiments to quickly try out each change and measure its impact.
Comprehensive site speed monitoring data
If you want to go beyond what GTmetrix can do, DebugBear is a great alternative. It combines three types of data:
On top of that it's built to handle your complete web performance workflow: from finding slow pages on your website, to identifying fixes, to continuous monitoring checks to confirm your optimizations are working and that there are no regressions.


Monitor Page Speed & Core Web Vitals
DebugBear monitoring includes:
- In-depth Page Speed Reports
- Automated Recommendations
- Real User Analytics Data