Single Page App (SPA) Monitoring
In a traditional website every navigation loads a new HTML document. In contrast, new pages in single-page apps are generated by client-side JavaScript code.
DebugBear can report performance metrics and Core Web Vitals for your single-page app using two different approaches.
Two approaches to measuring SPA performance
There are two ways to track Core Web Vitals for a single-page app:
- Track one page view per full page load. This approach matches how Google's Chrome User Experience Report (CrUX) works, and it's the default option in DebugBear RUM.
- Track one page view per client-side navigation. This provides better insight into the user experience for each individual page view.
With the CrUX approach to SPA reporting, the URL where a slow interaction or layout shift occurs is always the initial page URL, which can be different after soft navigations have occurred on the page. DebugBear separates this information with the URL Path, INP Path, and CLS Path properties.
With full SPA soft navigation reporting, Core Web Vitals metrics are always attributed to the page where the paint, interaction, or layout shift occurred.
Enable SPA mode
To track each SPA page view you need to enable Track SPA Soft Navigations Individually in your RUM settings.
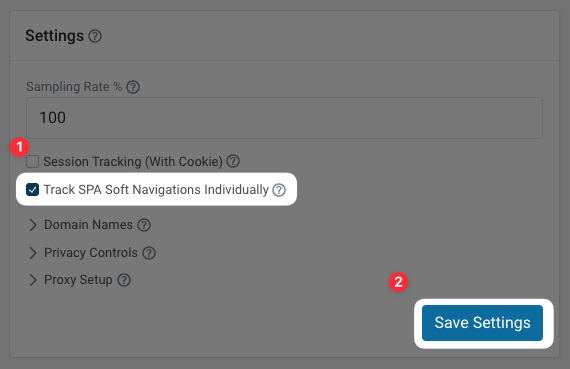
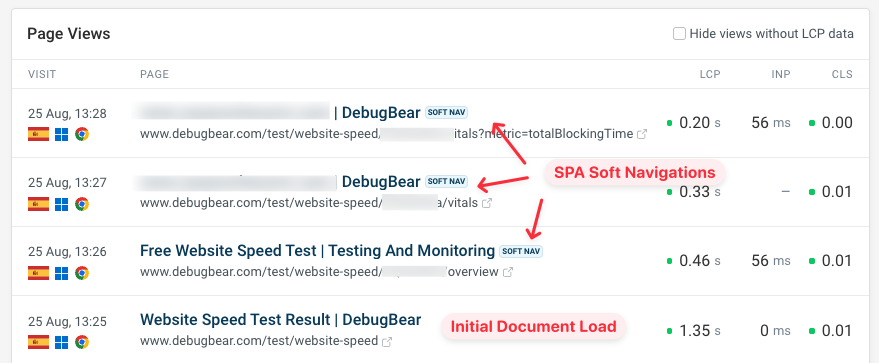
You will then see soft navigations reported separately.
This screenshot shows an initial page load followed by 3 soft navigations.
Support for measuring Core Web Vitals is a new feature in Chrome 151, which was released in August 2026. It is not supported in Safari or Firefox.
How SPA mode impacts your performance metrics
After enabling SPA mode you might see the following changes in your metrics:
- More page views will be tracked
- Your Core Web Vitals metrics are likely to improve
If a user opens a single-page app and triggers 10 client-side navigations, in total 11 page views will be reported for the 11 URLs that the user opened.
Better Core Web Vitals metrics
With soft navigations, the browser doesn't have to reload all page content. That means you'll typically see lower Largest Contentful Paint scores. If no additional data needs to be loaded, a new paint may happen in just a few hundred milliseconds.
CLS and INP are typically reported as (roughly) the worst layout shift and slowest interaction. With soft navigations, these are spread across more page views, so you'll see better scores reported here.
In some cases you may experience worse LCP scores. That could be the case if the initial page load is relatively simple, but later in-app navigations require complex backend processing.
With SPA mode disabled these paints would never be measured, as LCP is defined so that scores are finalized as soon as the user interacts with the page.
Time to First Byte scores will also improve, since it is zero for all soft navigations.
Exclude soft navigations to investigate just the initial page load
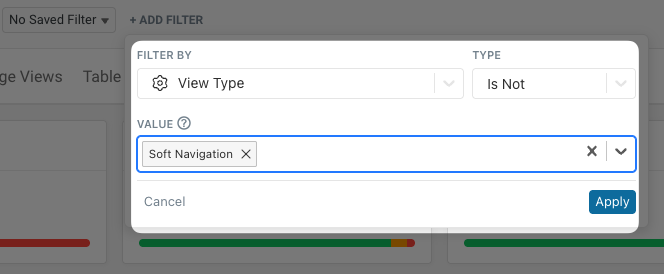
If you are interested in the initial page load speed of your app, for example because you want to optimize Google CrUX metrics, you can exclude soft navigations from your data.
- Add a filter
- Select View Type
- Select Is Not
- Select Soft Navigation
Viewing connected single-page app views
When viewing a soft navigation the page view timeline will show the initial page load, previous soft navigation, and the following page.
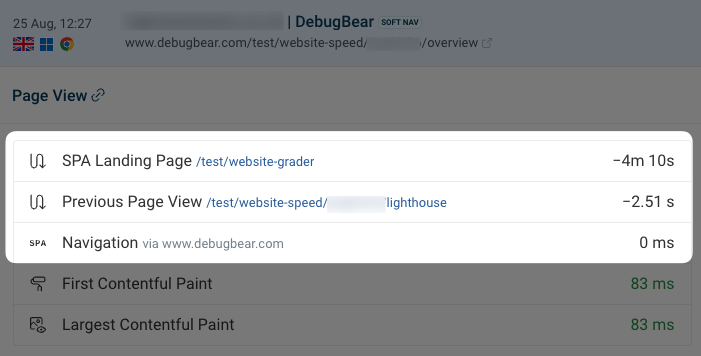
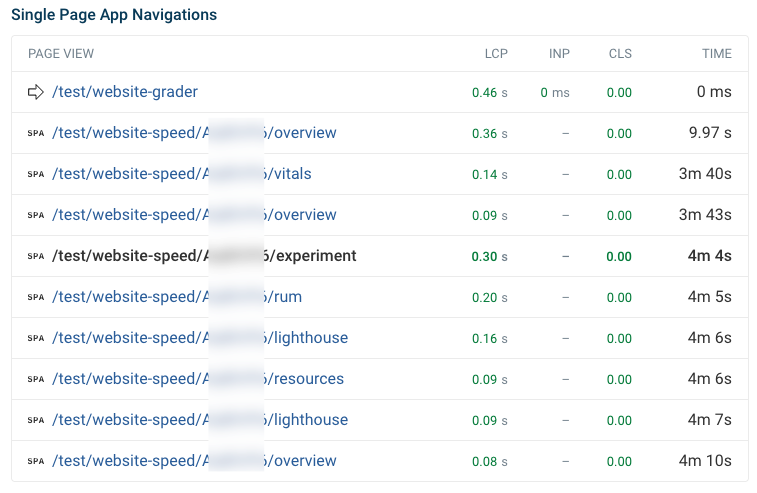
The Timeline tab of the page view can show the full list of soft navigations and their Core Web Vitals metrics.
Click on the link for each one to see detailed page view info for the navigations.