Reporting results to GitHub
You can run DebugBear as part of your Continuous Integration process. For every commit you'll be able to see how your changes affect factors like bundle size and Lighthouse scores.
If you've set up a performance budget builds will fail if the budget is breached.
Read this how-to article for a more detailed guide to setting up CI reporting with DebugBear.
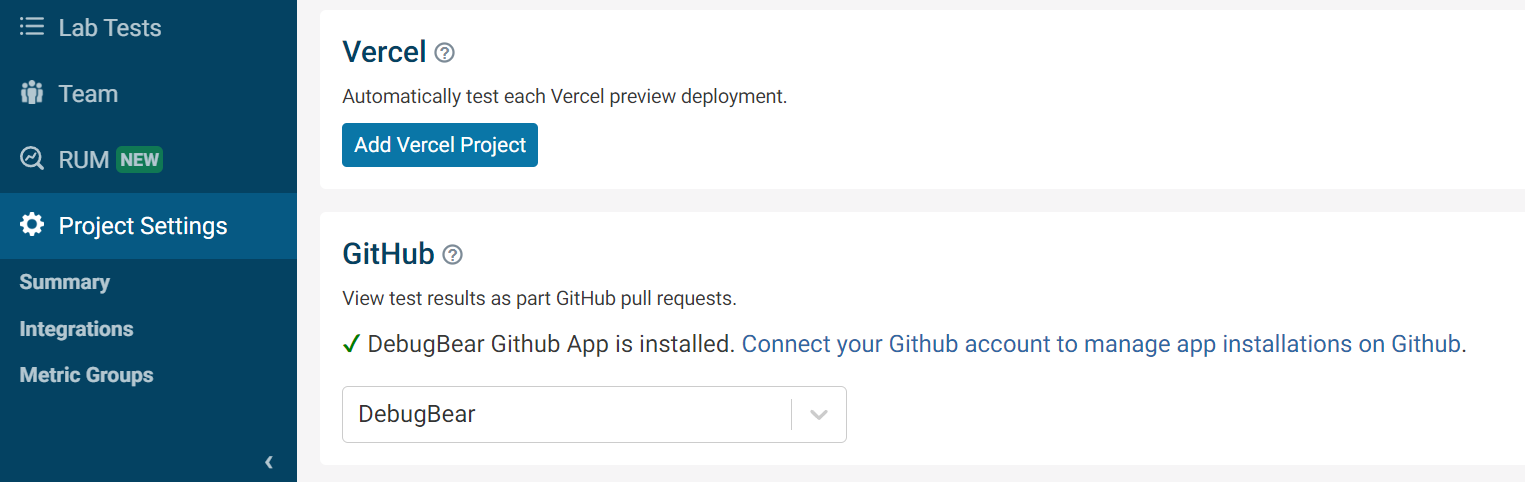
Part 1: Installing the DebugBear Github App
- Click Project Settings then the Integrations tab on your project dashboard
- Connect your DebugBear account to Github (if you haven't done so already)
- Click "Install Github integration" and give access to the relevant repositories
- The DebugBear Github App is now installed
Part 2: Analyzing pages in CI and reporting the results
Note: this is done automatically if you use the Vercel integration.
You can now use the CLI to analyze pages and report the results to GitHub.
Results are reported to Github if the following arguments are passed into the CLI. These can be inferred in CI environments like CircleCI or TravisCI if you pass the --inferBuildInfo flag.
--repoOwner--repoName--commitHash
You should also pass in a --baseBranch so that your tests are compared to other CI builds instead of the production URL. Usually the base branch will be master or develop.
By default your build will be compared to the most recent completed analysis on the base branch. You can use --baseHash to compare to a specific build.
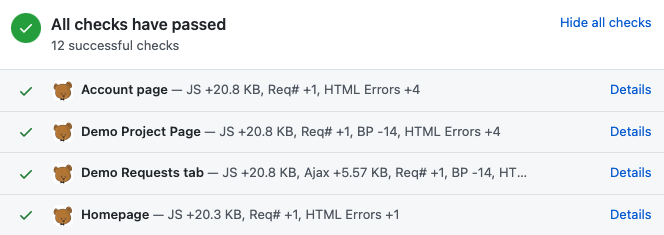
Viewing your results
For each page you analyze as part of your CI build DebugBear will add a status item to the commit on GitHub.
Click on Details to view the full build result on DebugBear.
Performance budgets
Setting up a performance budget for a page allows you to make your build fail if the budget is breached.
If no performance budget is set up builds will finish with a neutral status.