Real User Monitoring Metrics
This page lists all the metrics that are reported by DebugBear's Real User Monitoring (RUM) feature. Use the API ID to access these metrics via the DebugBear API.
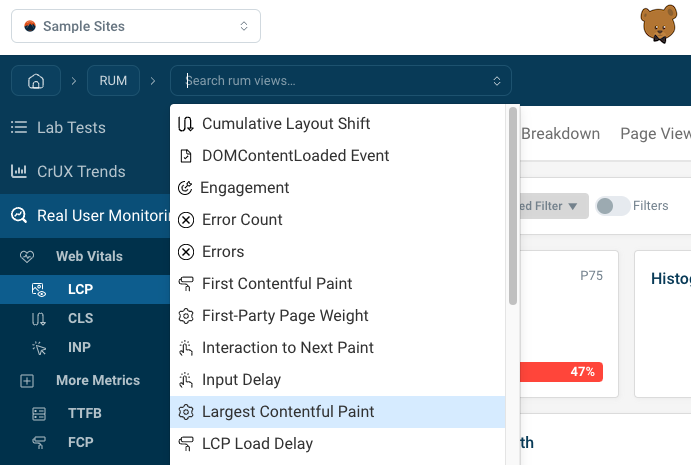
Available RUM metrics
DebugBear RUM currently supports 37 different metrics.
Time to First Byte
The Full Time to First Byte measures how quickly the server responds to the HTML document request. This includes time spent establishing a server connection or on redirects. More details.
API ID: ttfb
First Contentful Paint
First Contentful Paint measures how quickly content appears on the page after navigation. For example, text and images count as content. More details.
API ID: fcp
Largest Contentful Paint
Largest Contentful Paint measures how quickly the largest page element appears. This could be a hero image or a big heading. More details.
API ID: lcp
Cumulative Layout Shift
Cumulative Layout Shift measures how stable the page layout is. Layout instability is when content shifts around on the page after being rendered. More details.
API ID: cls
Interaction to Next Paint
Interaction to Next Paint measures how quickly the page updates after the user interacts with it. More details.
API ID: inp
DOMContentLoaded Event
The DOMContentLoaded event timing measures when the initial page HTML has been parsed. This milestone occurs before dependent resources like async scripts or images are loaded. More details.
API ID: dcl
Load Event
The load event marks the time when the page has loaded including any dependent resources like scripts and images. While the Load event has long been used as a page speed metric, it was not designed to be one. Where possible, prefer a paint timing metric like FCP or LCP. More details.
API ID: load
TTFB Redirect
Time spent on same-origin redirects, for example if example.com/a returns a 301 status code and redirects to example.com/b. More details.
API ID: ttfbRedirect
TTFB Other
Various wait times, for example service worker processing or cross-origin redirects.
Check the referrer and UTM campaign breakdown to see if a cross-domain redirect is likely to delay TTFB. More details.
API ID: ttfbWait
TTFB DNS
Time spent looking up the IP address for the domain name. More details.
API ID: ttfbDns
TTFB TCP
Time spent establishing a reliable connection. More details.
API ID: ttfbTcp
TTFB SSL
Time spent establishing a secure connection. More details.
API ID: ttfbSsl
TTFB Response
Time spent waiting for the server to respond with the HTML document content. More details.
API ID: ttfbResponse
TTFB Download
Time spent downloading the HTML document. More details.
API ID: ttfbDownload
LCP Render Delay
Render delay measures how long it takes for the LCP element to become visible. More details.
API ID: lcpRenderDelay
LCP Load Duration
If the LCP element is an image the resource load time measures how long it takes to request and download the image. More details.
API ID: lcpLoadTime
LCP Load Delay
If the LCP element is an image the load delay measures how long after the document TTFB the image resource is discovered by the browser. More details.
API ID: lcpLoadDelay
LCP Processing Time
Duration of CPU tasks prior to the LCP milestone.
Not all main thread tasks are reported by the browser, so this metric represents a lower bound.
API ID: lcpCpuTime
Input Delay
The Input Delay component of the Interaction to Next Paint metric measures how much time elapses between the interaction and when the browser starts processing the event.
A high input delay suggests that background tasks may delay interaction processing. More details.
API ID: inputDelay
Processing Time
The Processing Time component of the Interaction to Next Paint metric measures how long it takes to run the JavaScript event handlers that handle the event. More details.
API ID: processingTime
Presentation Delay
The Presentation Delay component of the Interaction to Next Paint metric measures how soon after an interaction the main thread becomes idle and the browser can display the next rendering frame.
A high presentation delay can suggest complex rendering logic or a series of queued-up user interactions. More details.
API ID: presentationDelay
INP Primary Script Duration
Duration of script with the greatest contribution to the Interaction to Next Paint score.
API ID: inpPrimaryScriptDuration
LCP Script Duration
Duration of the longest single script that runs before the Largest Contentful Paint.
API ID: lcpScriptDuration
CLS Scroll Top
The visitor's scroll position on the page when the largest layout shift occurred.
Layout shifts often happen when the user scrolls down the page and new lazy-loaded content is added.
API ID: clsScrollTop
First-Party Page Weight
Download size for first-party requests on the page.
Browsers can't consistently report third-party resource sizes.
If resources are served from the browser cache this will result in a smaller page weight. More details.
API ID: fppwTotal
Browser Uncached Ratio
Percentage of requests that were served from a server rather than the browser cache. More details.
API ID: uncachedRatio
Error Count
The number of unhandled errors and promise rejections that were recorded.
API ID: errorCount
Network RTT
Rough round trip time (RTT) estimate that the browser provides through the Network Information API. More details.
API ID: networkRtt
Network Bandwidth
Rough bandwidth estimate that the browser provides through the Network Information API. More details.
API ID: networkBandwidth
Window Width
Outer width of the visitor's browser window.
API ID: windowWidth
Window Height
Outer height of the visitor's browser window.
API ID: windowHeight
Page View Count
The number of page views for each item matching a category.
API ID: views
Custom Metric 1
A custom metric that was reported by the website. More details.
API ID: metric1
Custom Metric 2
A custom metric that was reported by the website. More details.
API ID: metric2
Custom Metric 3
A custom metric that was reported by the website. More details.
API ID: metric3
Custom Metric 4
A custom metric that was reported by the website. More details.
API ID: metric4
Custom Metric 5
A custom metric that was reported by the website. More details.
API ID: metric5